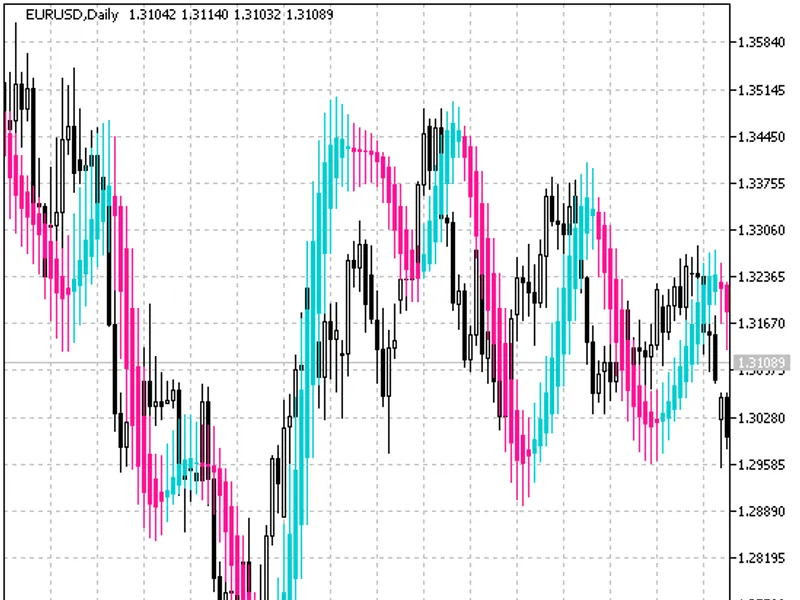
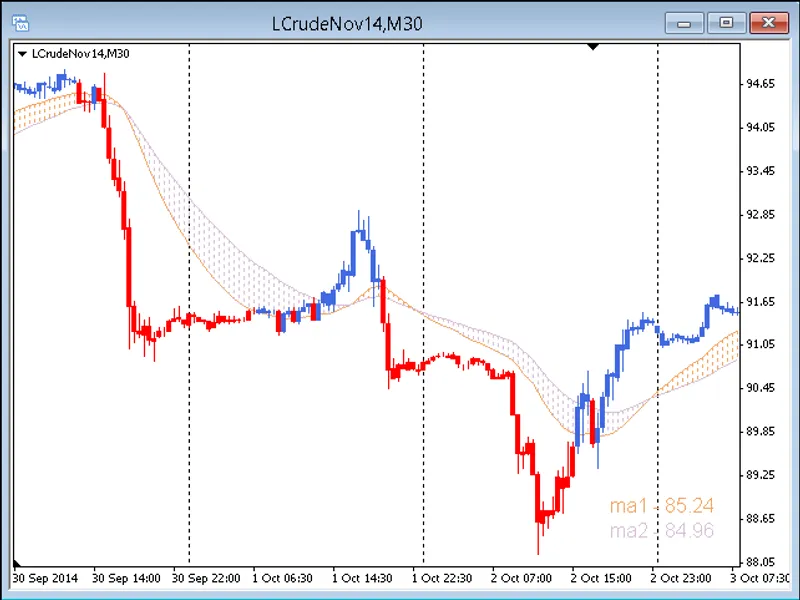
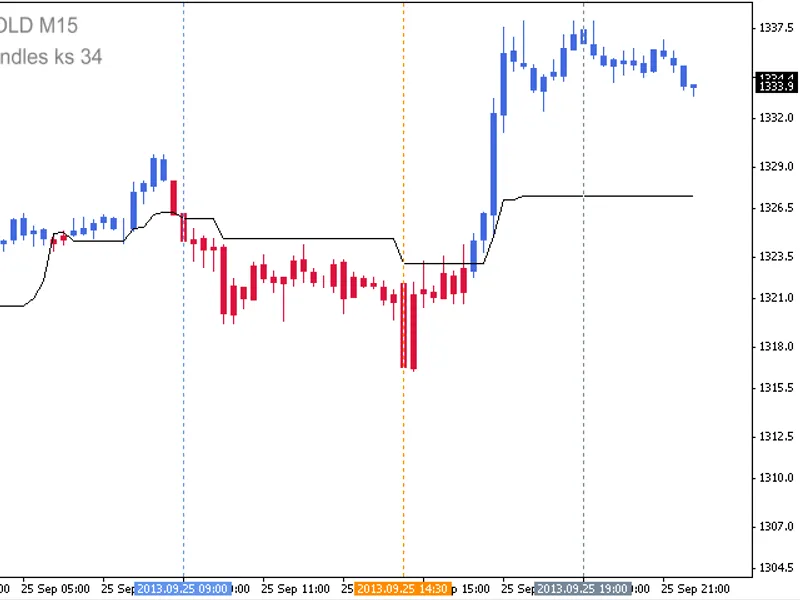
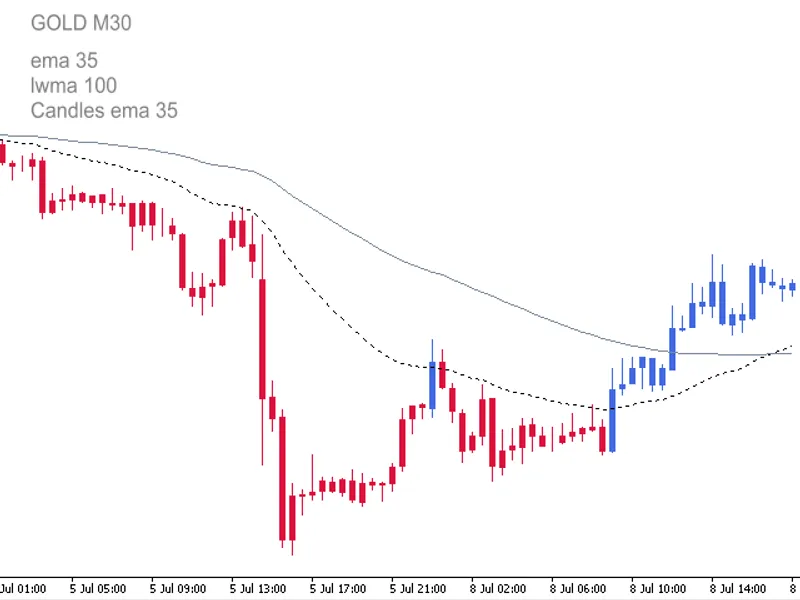
The Hull Candles indicator is a candlestick-based indicator that utilizes the Heiken Ashi algorithms and two averages.Indicator OverviewThe indicator was first implemented in MQL4 ...
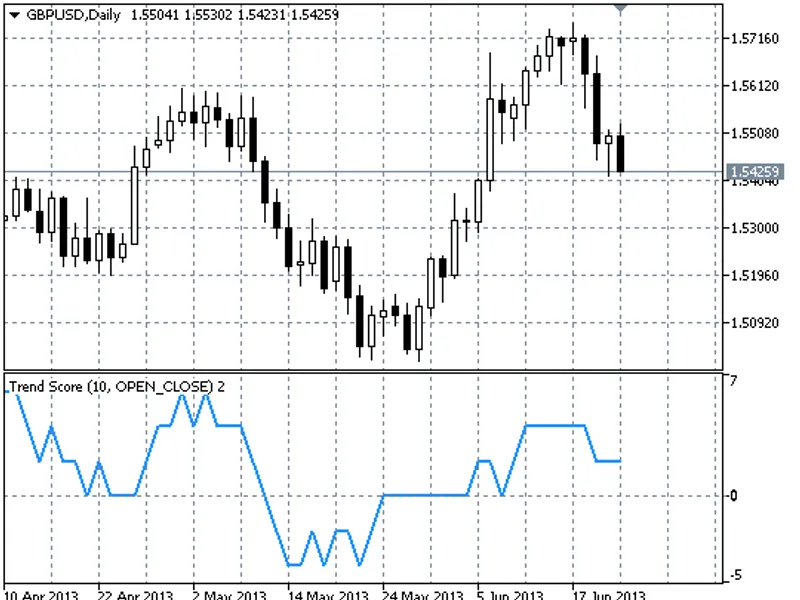
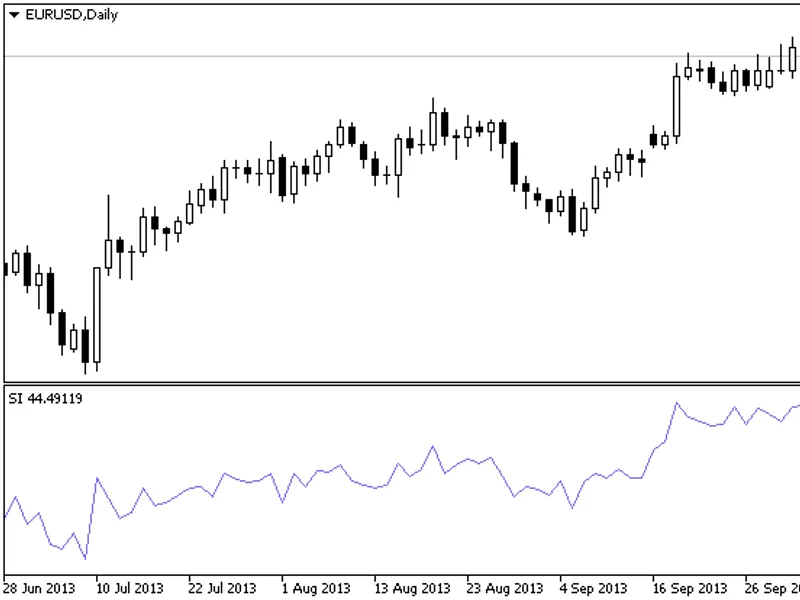
The trend score indicator can be calculated in two ways: with a specified period and without a period. When a period is used, the trend is determined by comparing the current price...
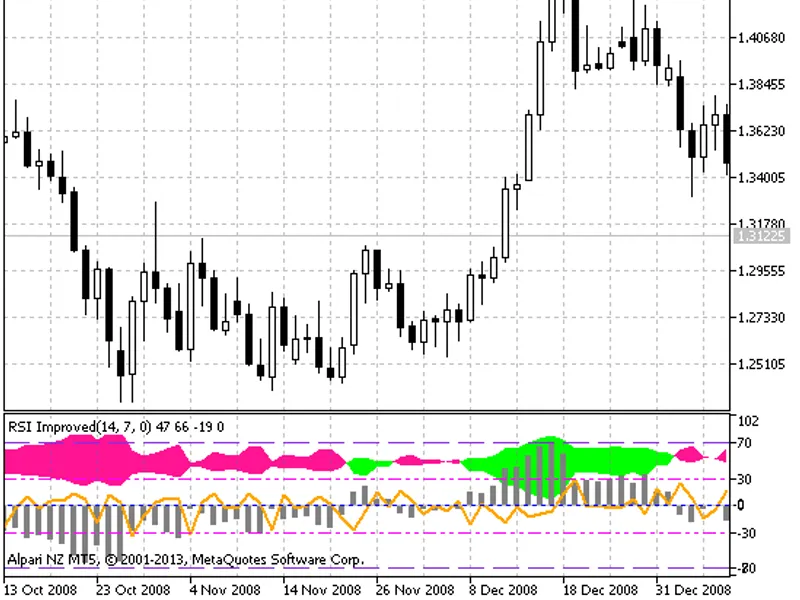
This is a combined indicator, built on the basis of two RSI oscillators.Indicator DescriptionThis indicator calculates the value of the RSI indicator with the RSI period and the va...
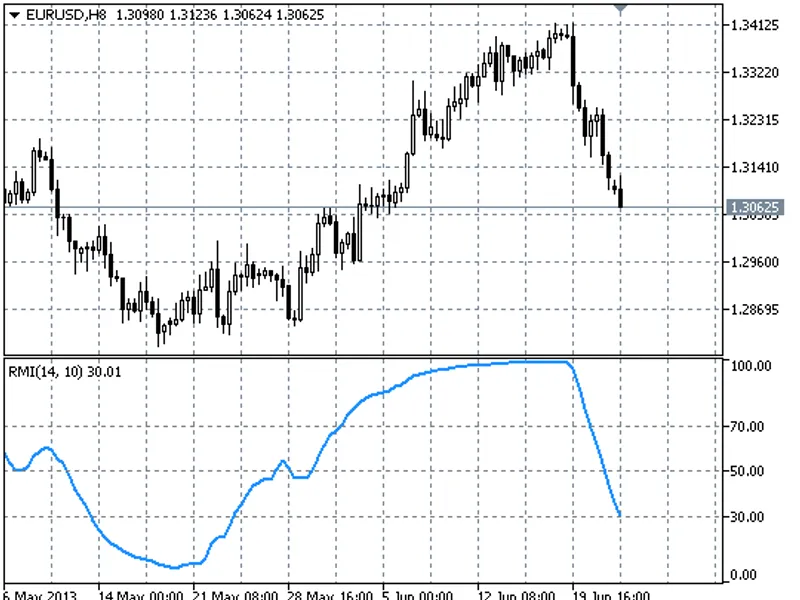
The Relative Momentum Index (RMI) is a technical indicator that calculates the momentum of price changes over a specified period.
It differs from the Relative Strength Index (RSI) ...
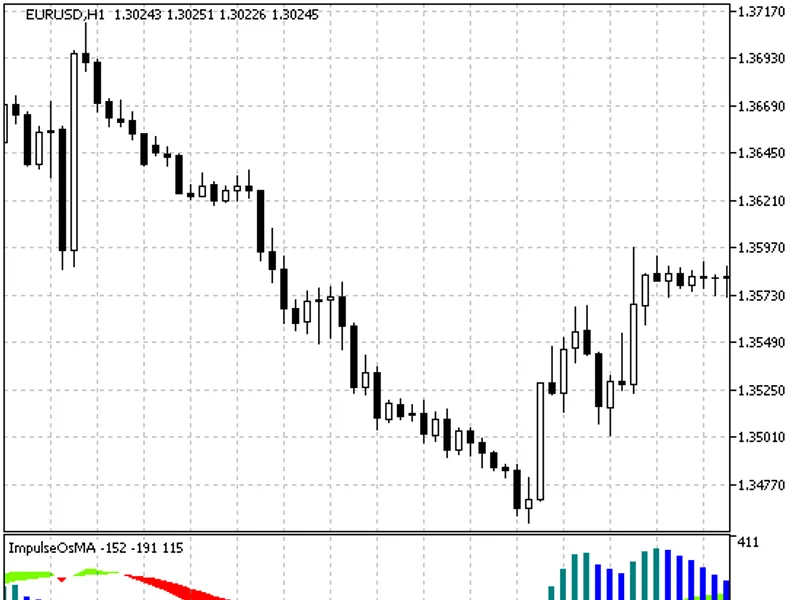
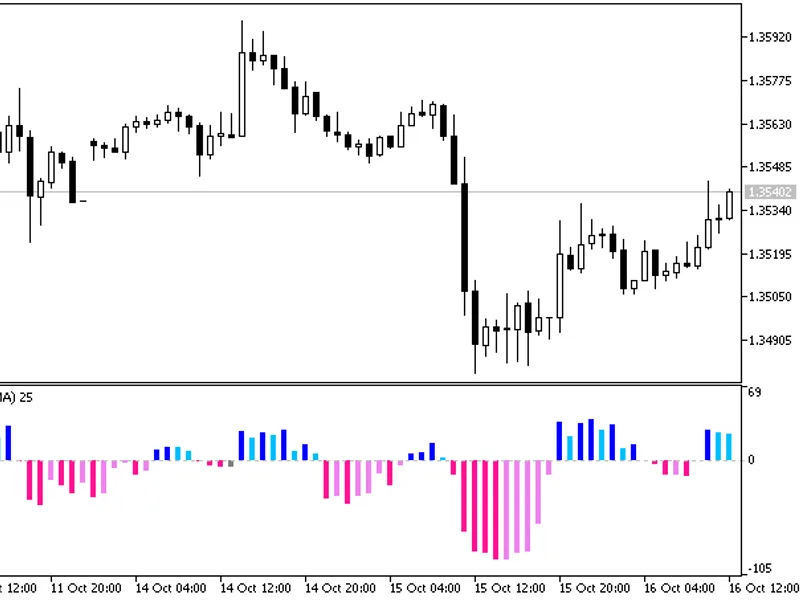
Impulse OS MAThis indicator is a hybrid of MACD, MACD Histogram, and the Impulse System.The histogram bar is colored green when both the histogram and the price chart MA are increa...
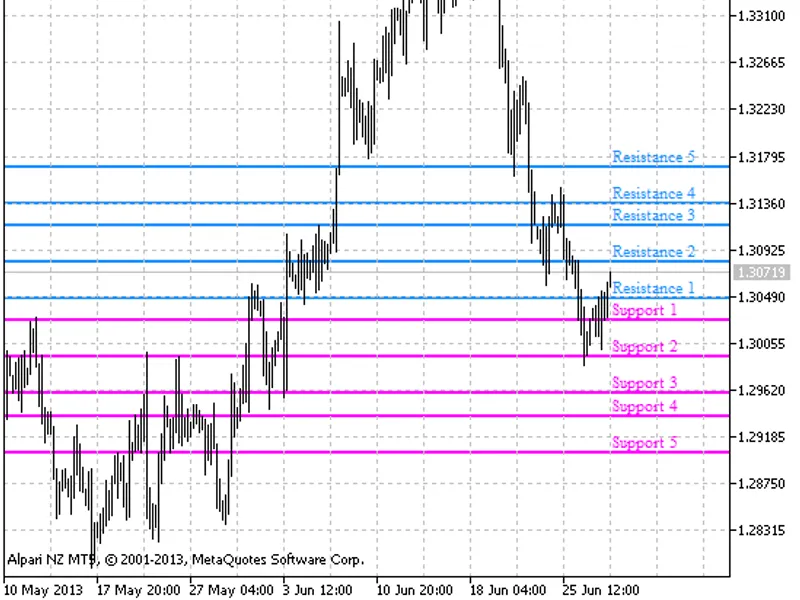
This indicator determines dynamic support and resistance levels using Moving Average lines and statistical lines calculated on a higher timeframe.The calculation method is based on...
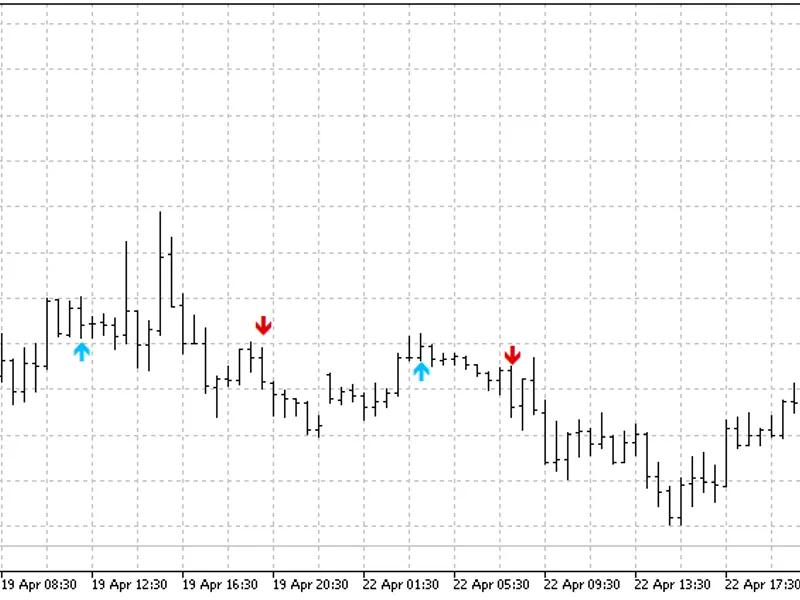
The Three Screen Elder Arrows Indicator is based on the Elder's Triple Screen trading system. It utilizes three distinct timeframes: a higher timeframe, a medium timeframe, and a l...
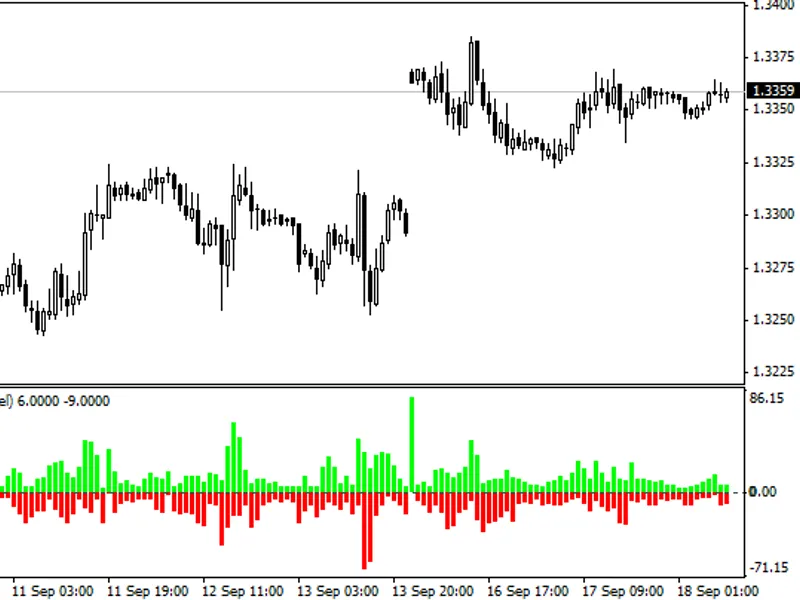
This indicator facilitates the quick assessment of the impact of the spread on the cost-effectiveness of strategies that predict market behavior one bar forward.It is particularly ...
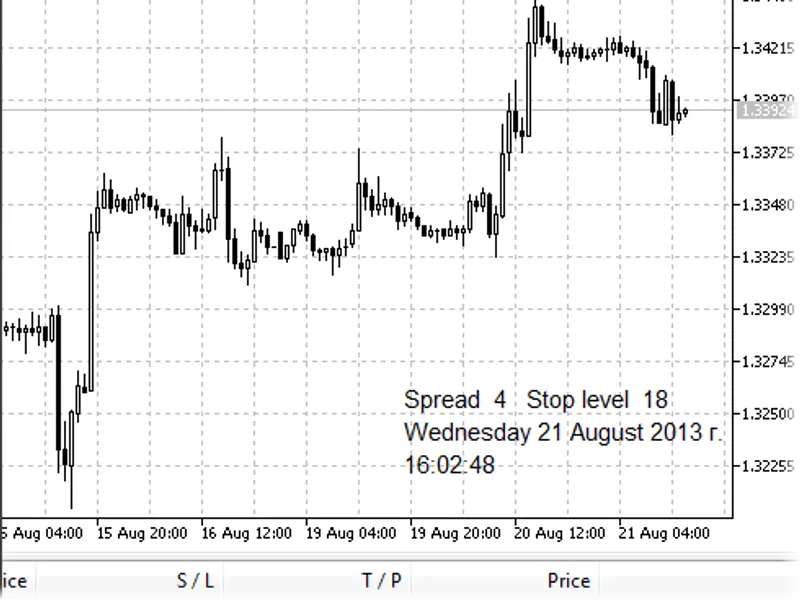
This indicator displays the current date, time, spread, and stop levels on your MetaTrader charts.Key Features:- Time Display: Choose between local (trader's computer) time or serv...
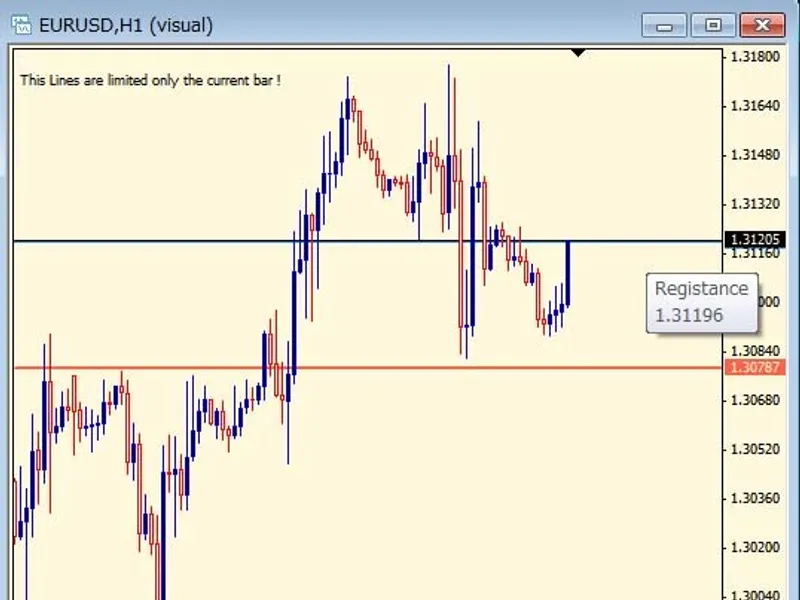
Simple Support and Resistance LinesThis indicator displays simple resistance and support lines.It is particularly effective in range-bound markets.Important Note: The two lines are...
Rogue Tick DetectorIntroductionTraders increasingly rely on automated trading and custom studies in MT4/MT5 to implement their strategies unattended. The effectiveness of these too...
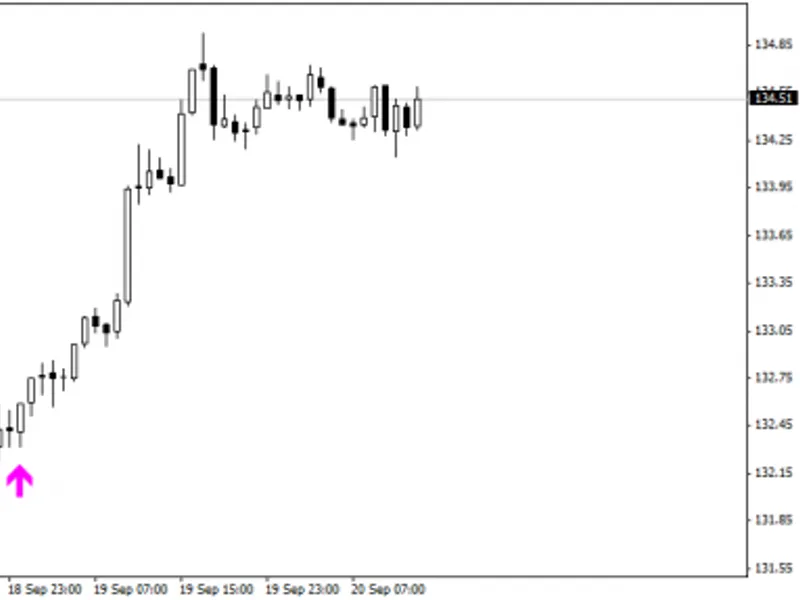
Indicator designed to alert you to significant market movements and potential future trends, specifically useful when you are asleep.The indicator aims to identify the start of tre...
This indicator identifies trends in their early stages, preparing users for potential breakout scenarios.The indicator displays the Positive Volume Index (PVI), smoothed by the MA ...
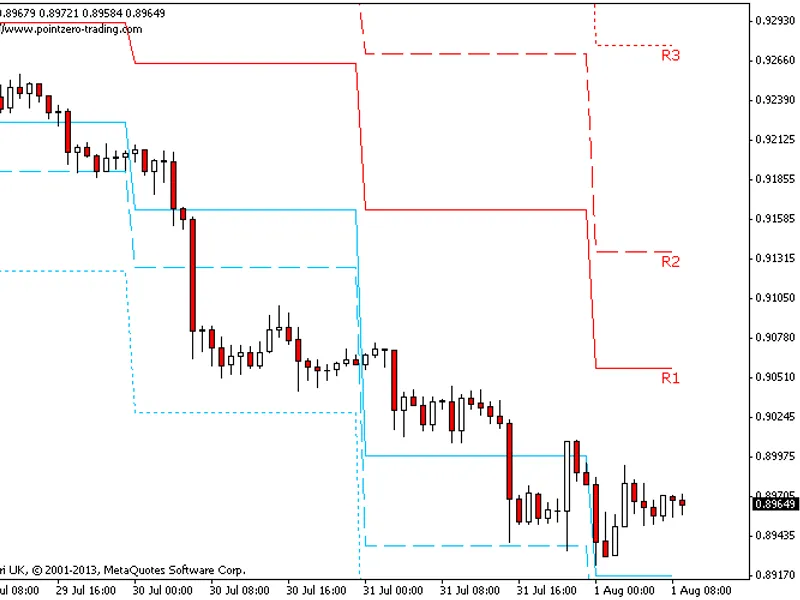
Pivot Point AnalysisA pivot point analysis is often used in conjunction with calculating support and resistance levels, similar to a trend line analysis. In a pivot point analysis,...
The Key Level Indicator draws true key levels on a chart based on Dinapoli Fibonacci levels, providing points of interaction by buyers and sellers.This indicator is designed to pro...
Brooky PSAR Levels Indicator
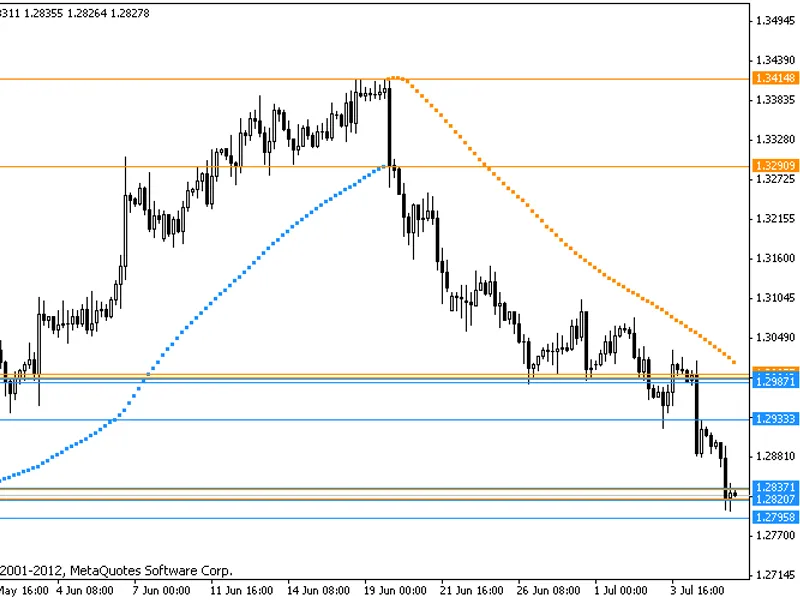
This indicator is an enhanced version of the original Brooky PSAR Levels indicator. It includes additional levels that were absent in the original, an...
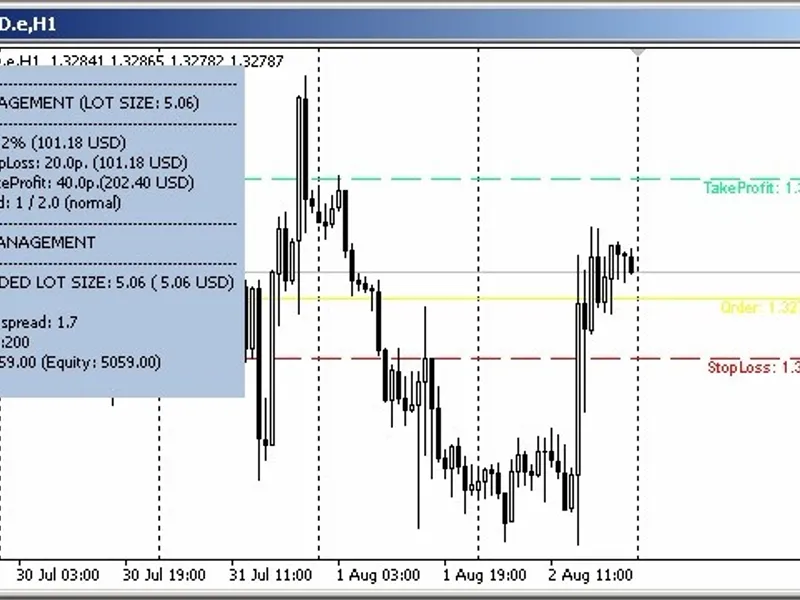
This indicator assists traders in calculating lot sizes by utilizing draggable horizontal lines for risk and money management.To use the indicator, add a horizontal line to your pr...
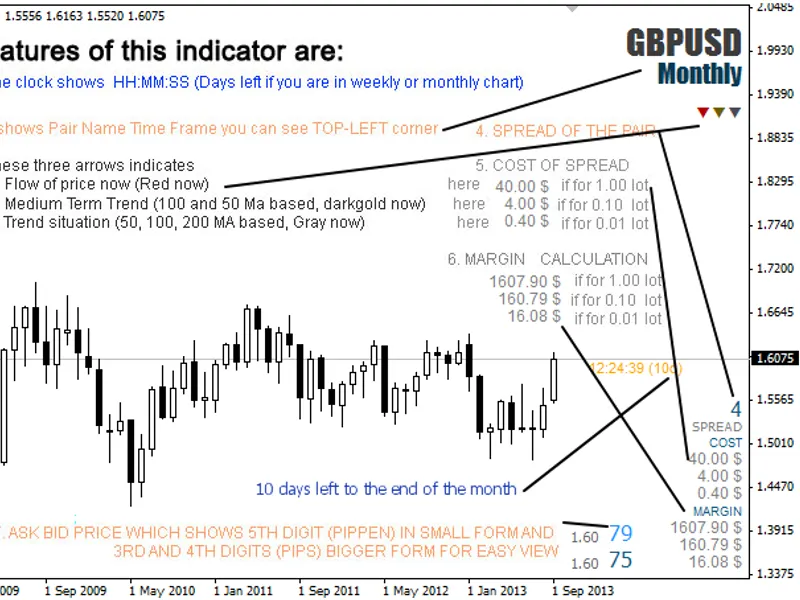
This tool displays the spread cost and margin requirements for trading volumes of 1.00 lot, 0.10 lot, and 0.01 lot.This information is crucial for calculating your account balance ...
This indicator utilizes two moving averages: one for the current timeframe and another for an upper timeframe. It can be used to identify the trend on the current chart. The indica...
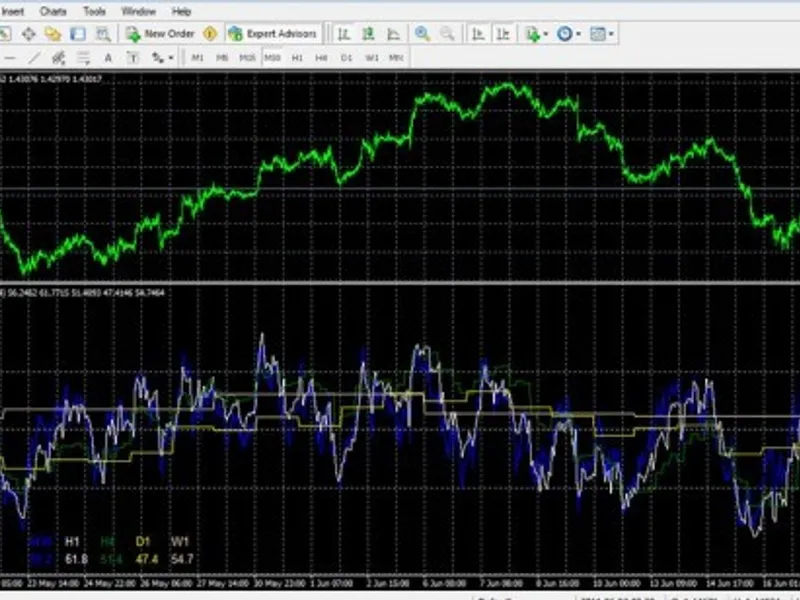
Multi-Timeframe RSI IndicatorWith the MTF RSI indicator, you can easily identify oversold/overbought levels on several different timeframes using only one chart. Short-term trades ...
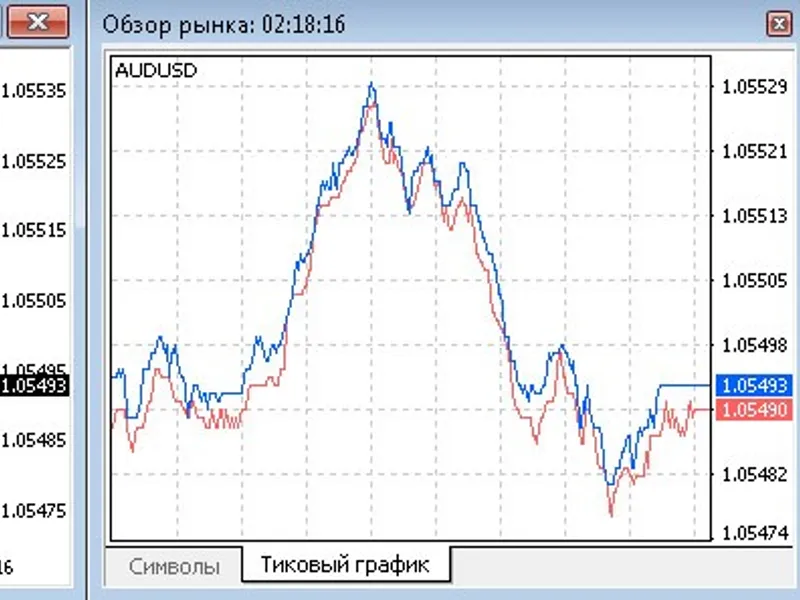
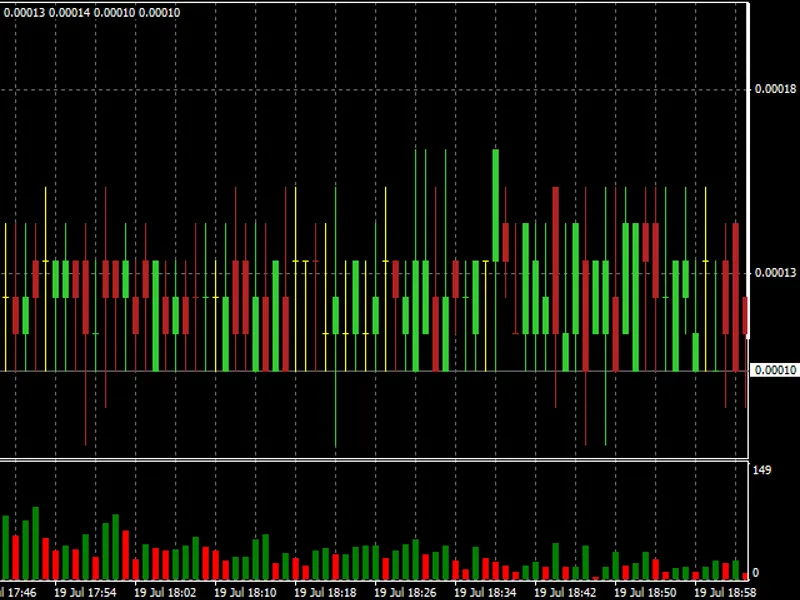
Tracking Variable Spreads with an Offline ChartMany brokers utilize variable spreads, but it can be challenging to ascertain average values and their fluctuations over time.This in...
This indicator generates trading signals by combining Stochastic and RSI indicators with a MACD confirmation.The Stochastic oscillator uses periods 8, 3, 3.The RSI indicator uses a...
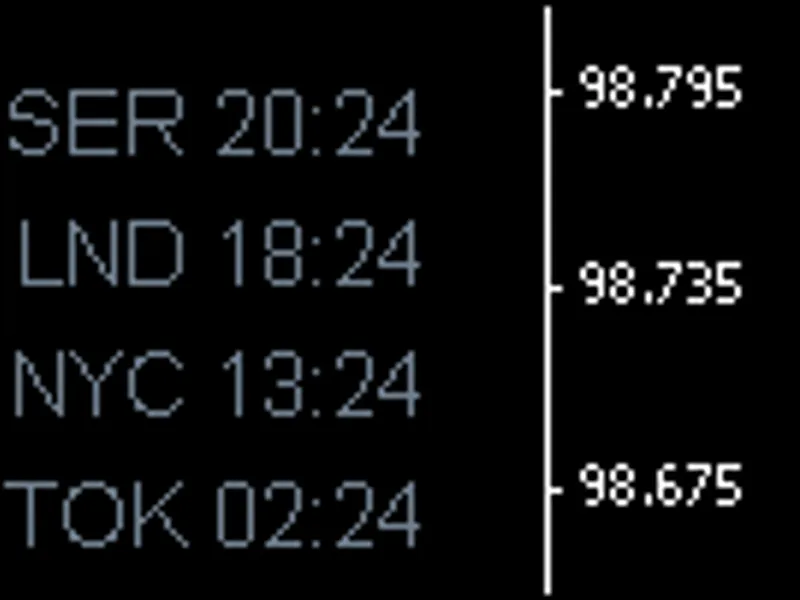
Time Zones Six Indicator v2.Allows for custom positioning on the chart.The indicator displays broker server time (SER), which cannot be altered.Five additional time zones can be co...
Open Positions v3a
This indicator has been updated for MetaTrader 4 (MT4) Build 600.
IMPORTANT: Please remove all old instances of Open Positions v2 from your charts and delete a...
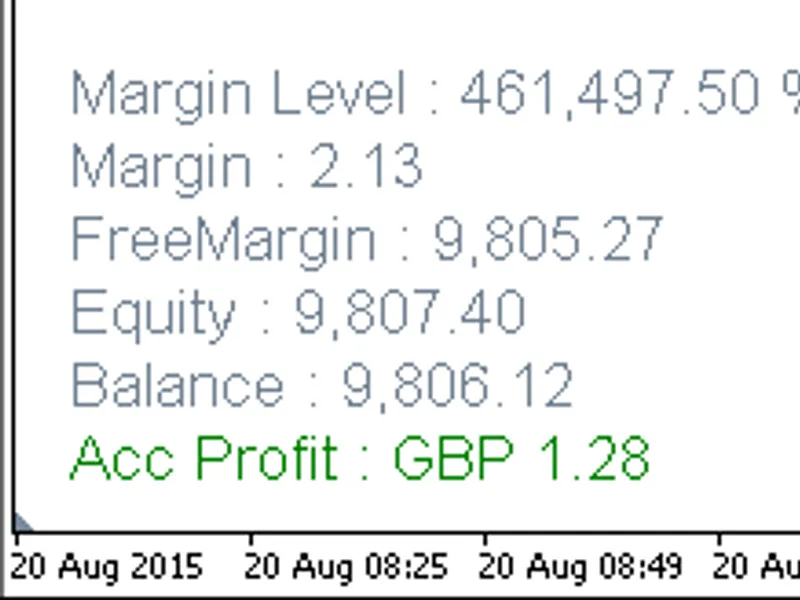
Display key account information directly on your trading chart with these intuitive indicators. Showcasing profit, balance, equity, free margin, margin level percentage, and more. ...
Color Fill Moving Average Indicator
This indicator enhances the visual perception of price action, assisting with trade entry, continuation, exit, and re-entry decisions on trend ...
Color Fill - Tenkan + Kijun
Available for MT4 and MT5.
The Color Fill indicator (also known as a color histogram) enhances the visual perception of price action, assisting with de...
This is a four-indicator tool named 'Two-Color Kijun-sen Candles'. It is designed to support traders by providing reliable functionality within the MetaTrader 4 and MetaTrader 5 en...
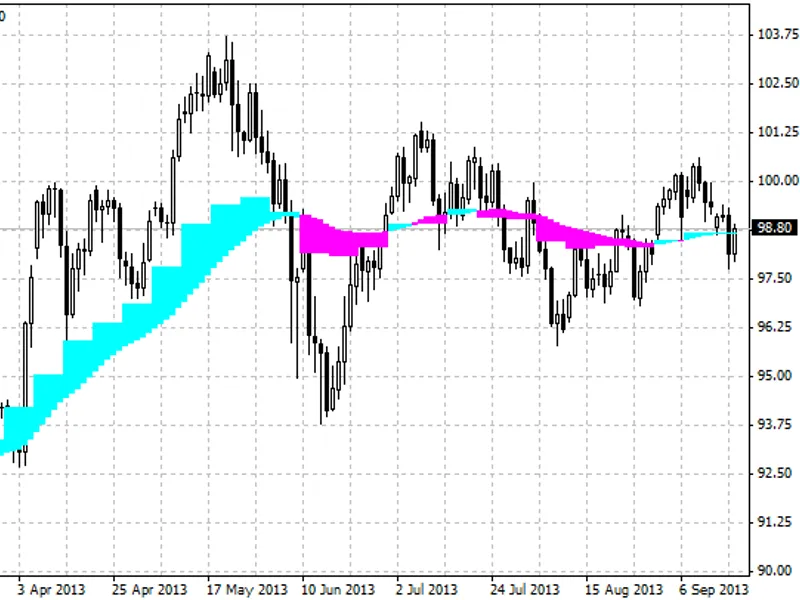
MA Candles Two Colors Indicator 2.0This indicator draws candles in two distinct colors, positioned above and below a Moving Average (MA) line.Supported MA Methods:- Simple- Exponen...
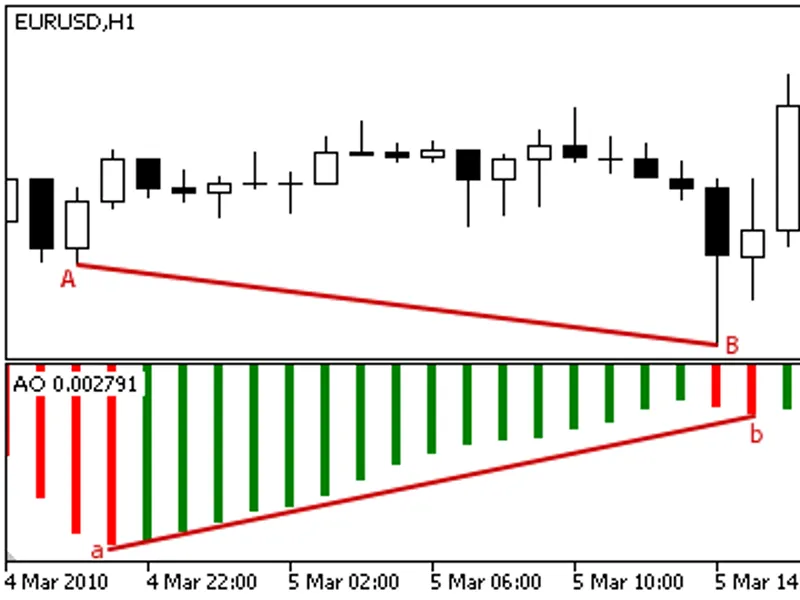
This indicator plots divergence lines on the Awesome Oscillator and provides buy and sell signals with arrows.Bullish regular divergence is shown in solid blue lines.Bullish hidden...
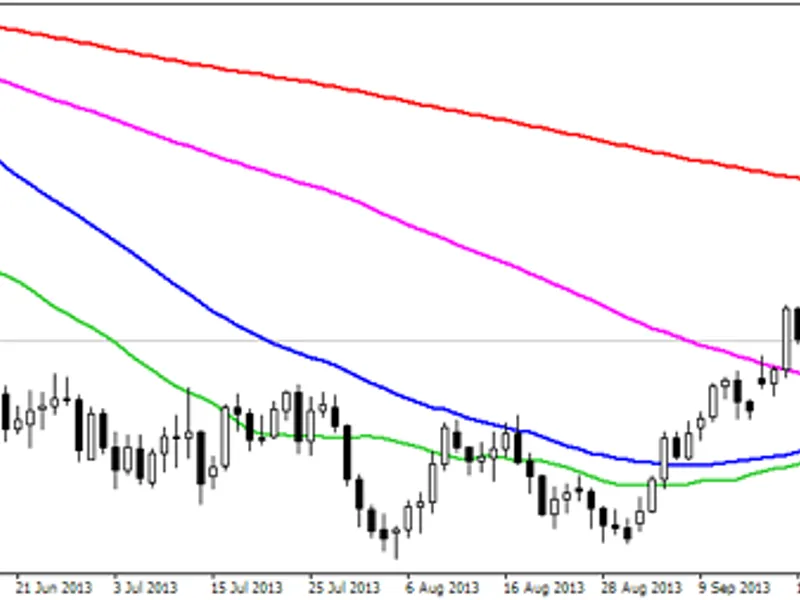
This indicator identifies potential target areas using Simple Moving Averages (SMA) of periods 20, 50, 100, and 200.It helps traders anticipate the next price level the market may ...
Filter over WPR Indicator
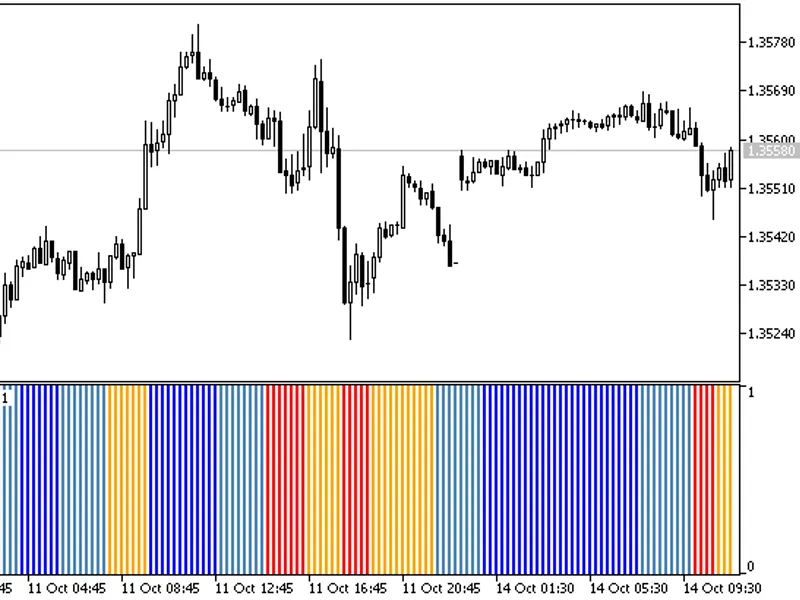
This is an indicator of trend power with four distinct states, utilizing the WPR (Williams Percent Range) as its source for signals. A strong upward tren...
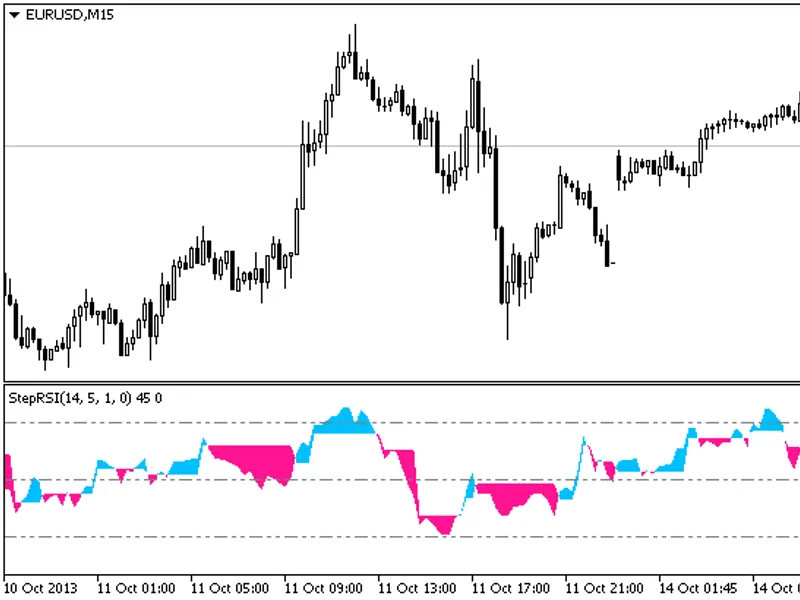
A trend indicator that utilizes the oscillator analogue of RSI and its signal line. It is visually represented as a colored cloud.This indicator was initially developed for MQL4 an...
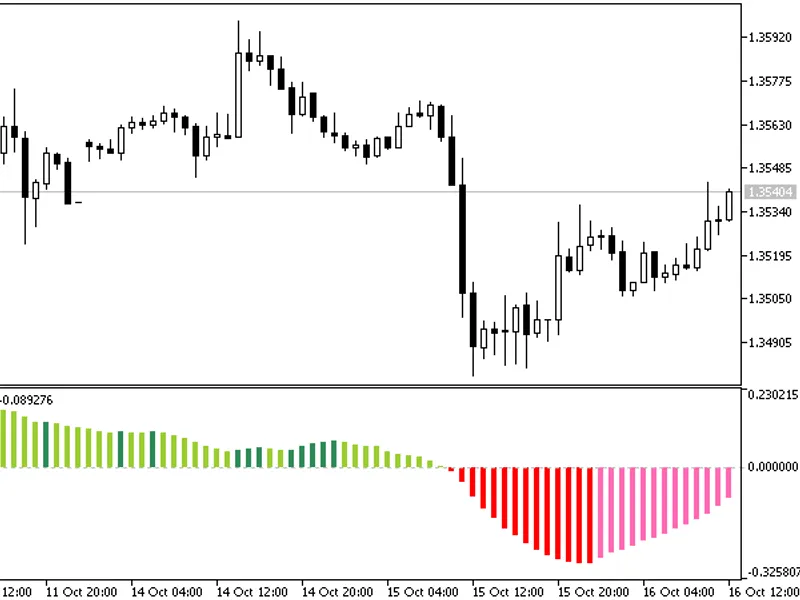
A smooth, non-normalized oscillator presented as a color histogram.This indicator addresses how to identify trend changes, select appropriate flat market conditions, and execute tr...
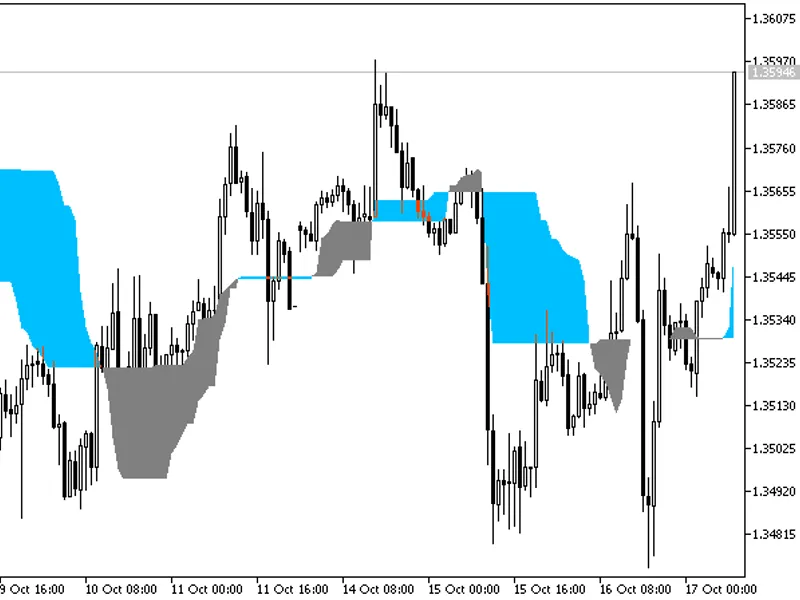
The Chande Kroll Stop is an indicator that visualizes trend strength using a colored cloud. A strong trend is depicted in blue, while a weak trend is shown in gray.This indicator w...
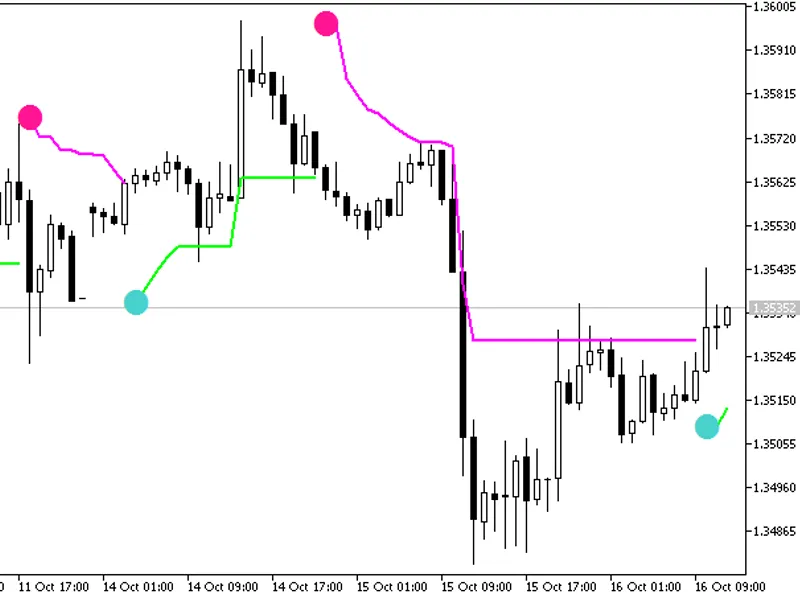
The Chandelier Stops indicator is a trend indicator implemented in the form of NRTR (Trailing Stop).This indicator was first implemented in MQL4 and published on 02/20/2026.Figure ...
The QStick indicator is a simple n-period moving average of the price difference.QStick can be used as a simple replacement of candlesticks. Positive values of QStick indicate a pr...
A trend indicator based on the crossover of a pivot level and its median.The pivot level is calculated using the following formula:pl = (max + min + close) / 3Where:pl - pivot leve...
Displays lines of support and resistance.The indicator features support and resistance lines set at 10 levels each. It functions across all timeframes and effectively indicates con...
This indicator uses the ADX with a period of 14 to predict the current market trend. The trend is identified if the DI+ is above the DI- and both are above the main ADX line.This i...
The Any Pair Stochastic Indicator allows you to display the Stochastic indicator for any chosen symbol on your current chart.This provides greater flexibility than standard indicat...
Donchian Channel is a volatility indicator based on the calculation of the current price range with the recent highest and lowest prices.Key Features- The indicator calculates the ...
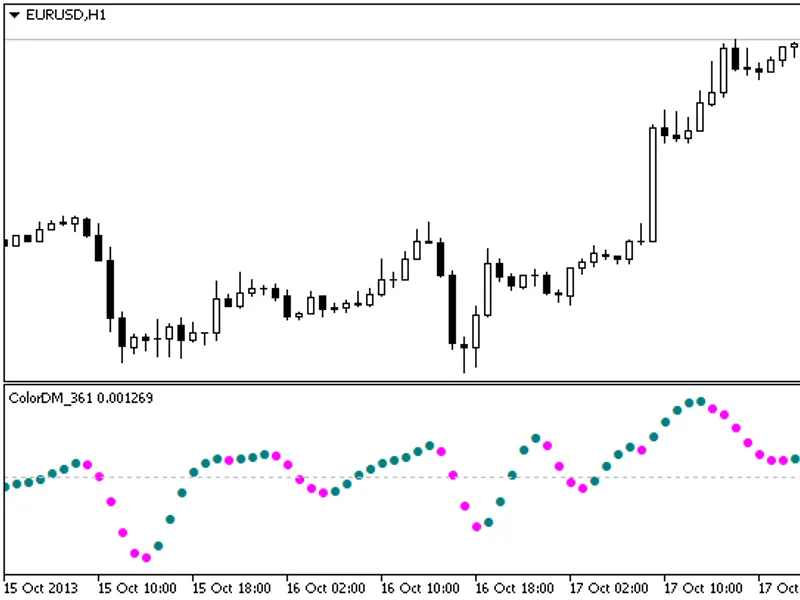
Finware.ru Ltd.A digital momentum indicator represented by colored characters.This indicator was first implemented in MQL4 and published on 11.02.2026.Figure 1. The ColorDM_361 Ind...
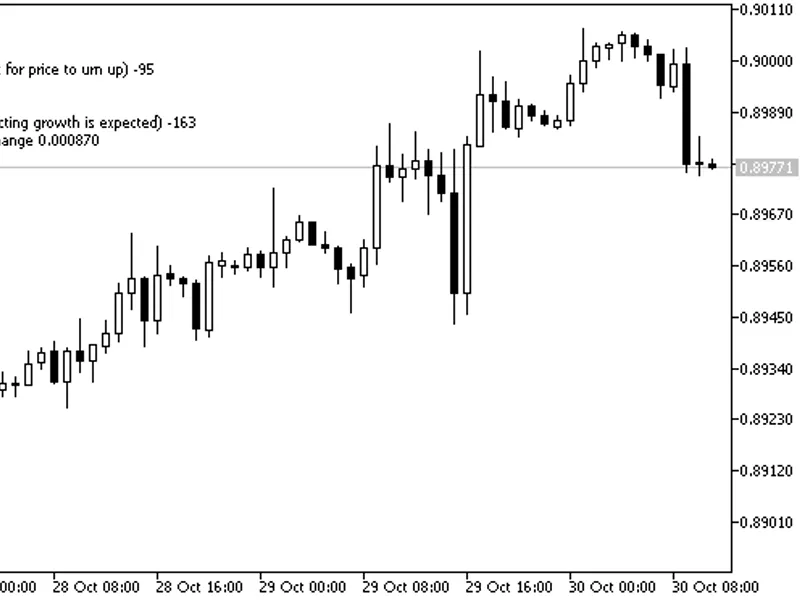
The Commentator Indicator analyzes a group of technical indicators and displays trade recommendations.This indicator was first implemented in MQL4 and published on 11.02.2026.Figur...
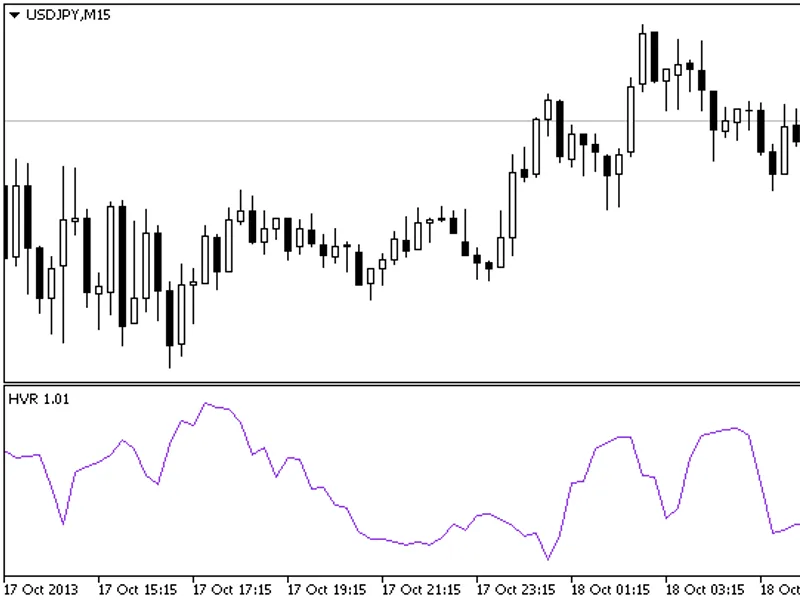
HVR IndicatorAn indicator of trend strength. The ratio of the price of the current bar to the price of the previous bar is used as the initial data for the calculation.This indicat...
I-Pass Lev CCI Indicator
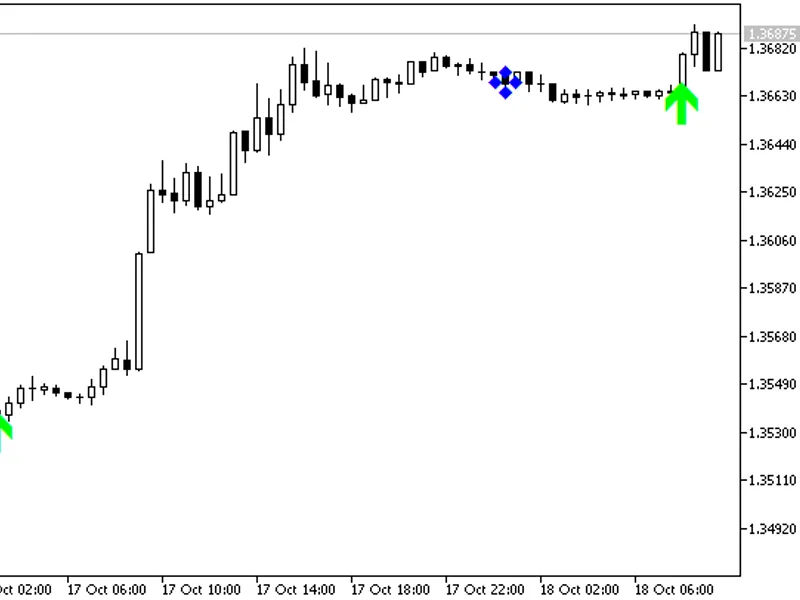
This indicator provides semaphore signals using an oscillator.
Entry signals are displayed on the chart as colored arrows.
Exit signals are indicated by...