





Price Levels Indicator
Info
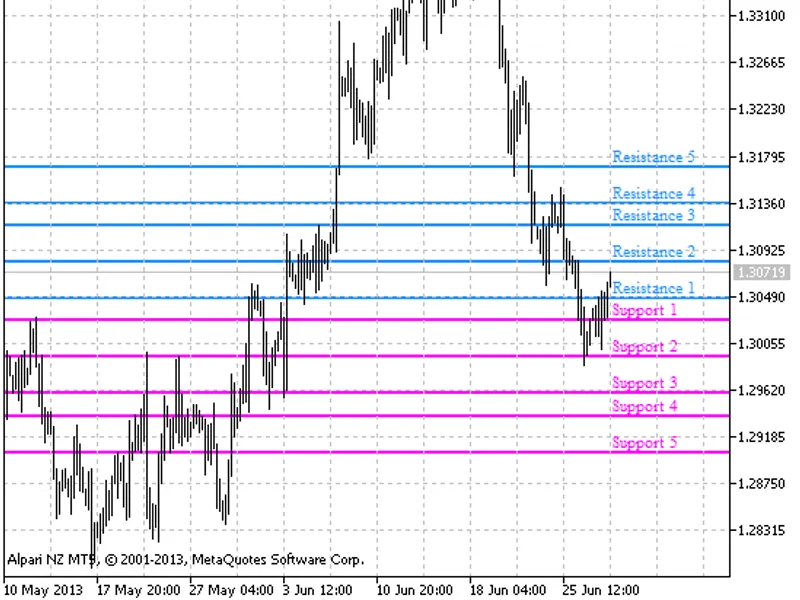
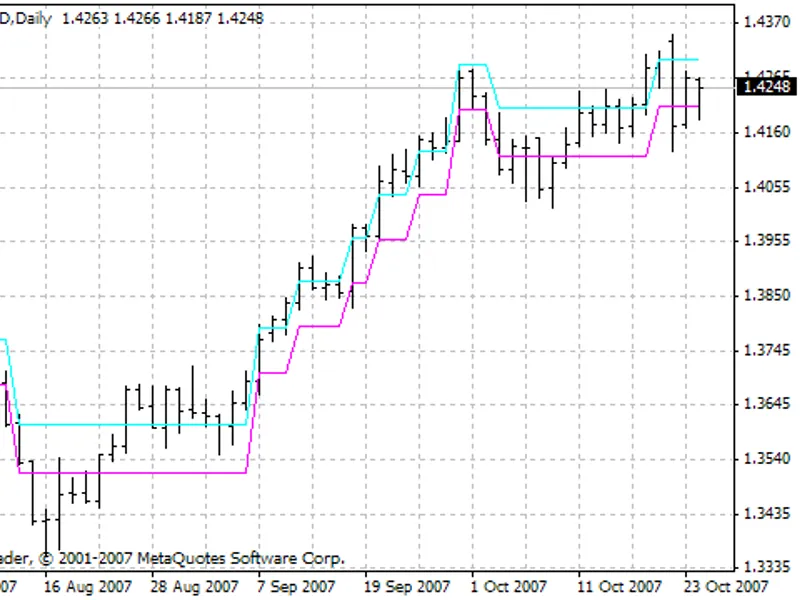
The Price Levels Indicator is a Indicator for MetaTrader 5 that this indicator determines dynamic support and resistance levels using moving average lines and statistical lines calculated on a higher timeframe. The calculation method is based on the principles described by Vladislav Antonov.
Usage
This tool is typically used for enhancing chart analysis and decision making.
Platform
This Indicator works exclusively on MetaTrader 5 (both build 600+ and newer versions).
Setup
Place the downloaded file in MQL5/Indicators folder via File ? Open Data Folder in MetaTrader 5.
How to Install and Use Price Levels Indicator
1. Installation: Place your file in the MQL/Indicators folder via "Open Data Folder" and restart your terminal.
2. Loading: Find the indicator in the Navigator, drag it onto your chart, and configure the input parameters in the popup window.
3. Customization: Press Ctrl+I to open the indicator list, select your tool, and click "Properties" to change colors, levels, or visual styles.
4. Updating: Replace the old file in the Indicators folder with the new version and restart the platform to apply changes.
Frequently Asked Questions
Q: Why is my indicator not showing? A: Verify the file is in the MQL/Indicators folder, or try right-clicking the "Indicators" tree in the Navigator and clicking "Refresh."
Q: Do custom indicators slow down the platform? A: Too many complex indicators can impact performance; remove unused ones via the "Indicator List" (Ctrl+I).
Q: Can I use MT4 indicators on MT5? A: No, MQL4 and MQL5 are distinct languages; ensure the indicator is compiled specifically for your platform version.
What this tool does
This indicator determines dynamic support and resistance levels using Moving Average lines and statistical lines calculated on a higher timeframe.
Typical Use Case
This Indicator excels in automated trading and technical analysis on MetaTrader 5.
Compatible Platform & Setup
This Indicator works on MetaTrader 5. Place the file in the MQL5/Indicators folder and restart the terminal.
Description & Settings
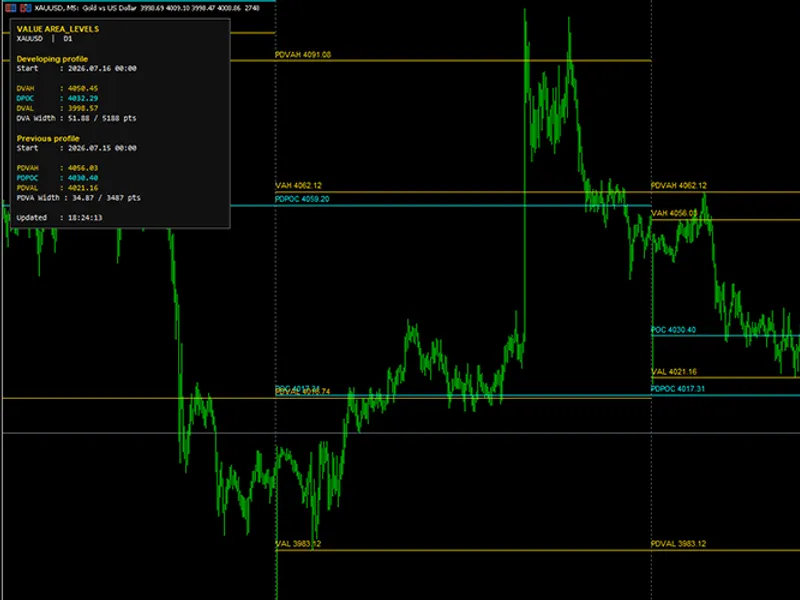
Related: Value Area Levels Indicator - another powerful indicator for MetaTrader 5 traders.
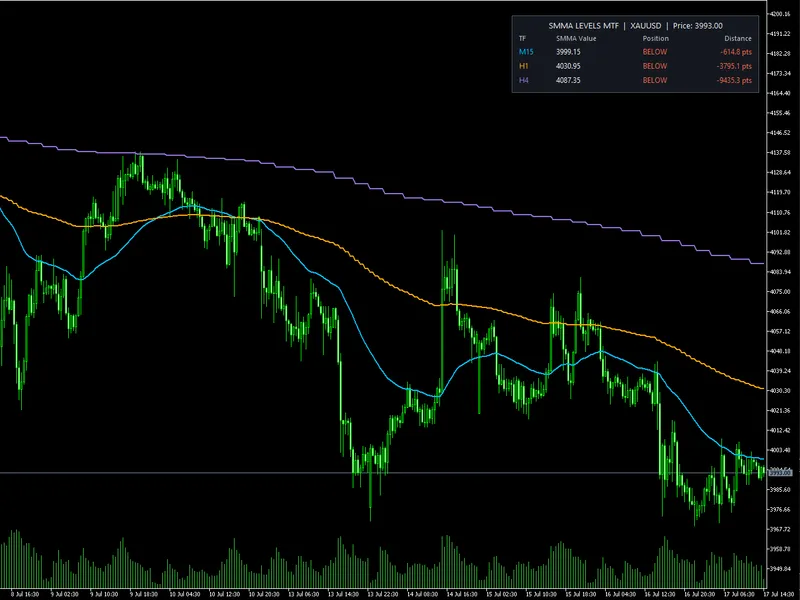
This indicator determines dynamic support and resistance levels using Moving Average lines and statistical lines calculated on a higher timeframe.Also recommended: SMMA Levels MTF Indicator - similar indicator with strong performance on MetaTrader 5.
The calculation method is based on the principles described by Vladislav Antonov.
Intraday levels are calculated using the high, low, and close prices of the preceding candlestick on the relevant timeframe (hourly, daily, or weekly).
For daily intraday levels, the high, low, and close of the previous day's candlestick are used. These levels remain valid for the current day and are recalculated daily.
For example, using the daily candle from 02.11.2006 (High = 1.2786, Low = 1.2736, Close = 1.2780), levels are generated for the current day and applied to all charts with a timeframe smaller than daily. New levels are calculated the following day.
There are three calculation methods based on the size of the previous candlestick:
- Reduced: For weak market conditions, recommended when the previous day's candlestick is larger than 200 points, anticipating a correction.
- Normal: For moderate market volatility, applicable to day candlesticks between 100 and 200 points. This method is effective during steady growth or decline with consistent candlestick sizes.
- Extended: For strong market conditions, used when price movement is consolidating within a triangle, anticipating a significant move with an extended price range.
The choice of calculation method may require statistical analysis and personal research. The author's approach relies on intuition and expected price patterns.
This indicator was initially implemented in MQL4 and published on 24.02.2026.
You may also like: price channel indicator - excellent alternative for indicator users on MetaTrader 5.
Source Code
#property copyright "robotfx"
#property link "https://robotfx.org"
#property version   "1.00"
#property indicator_chart_window
#property indicator_buffers 0
#property indicator_plots   0
enum number
  {
   number_0,
   number_1,
.......
⚠ Limitations & Risk Warning
- This tool is provided for educational and testing purposes only.
- Past performance does not guarantee future results.
- Trading involves substantial risk of loss. Use on a demo account first.
- Results may vary depending on market conditions, broker, and settings.
- We recommend thorough backtesting and forward testing before using with real funds.