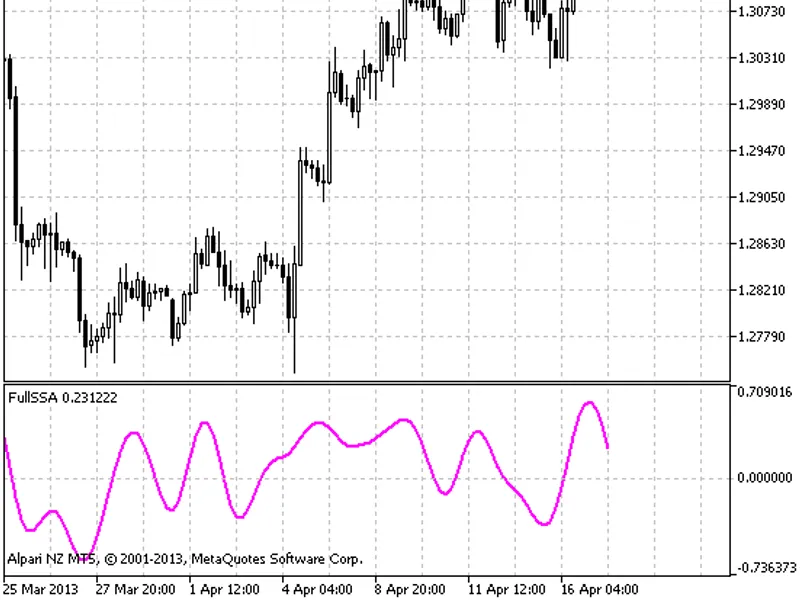
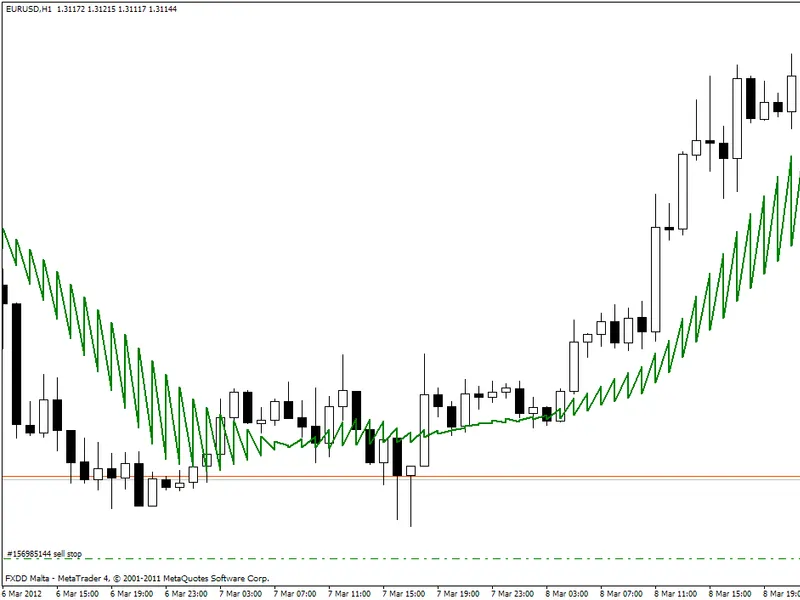
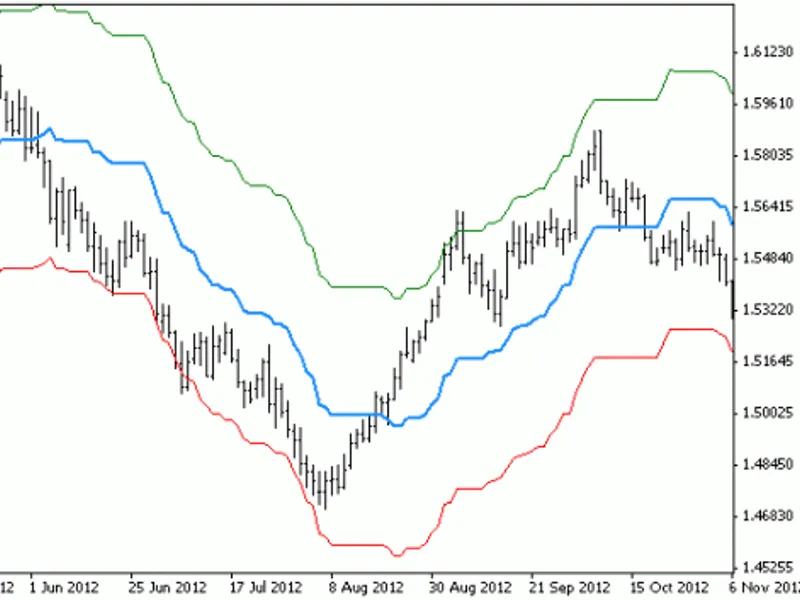
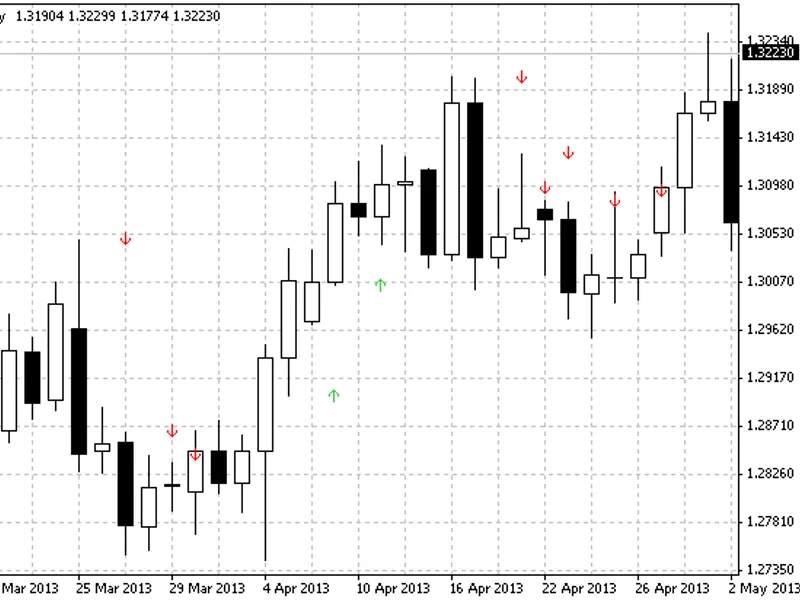
KlotThe redrawing oscillator is drawn based on the SSA.mqh singular transformation library of functions. The redrawing occurs at the last bars section equal to the value of the ind...
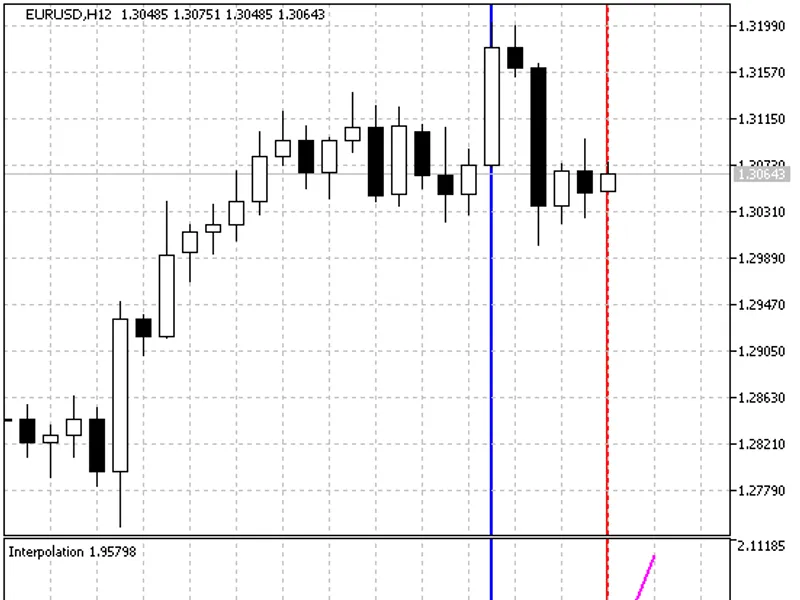
The Lagrange Interpolating Polynomial Indicator is a powerful tool for determining functions based on specified price points.This indicator utilizes the Lagrange interpolating poly...
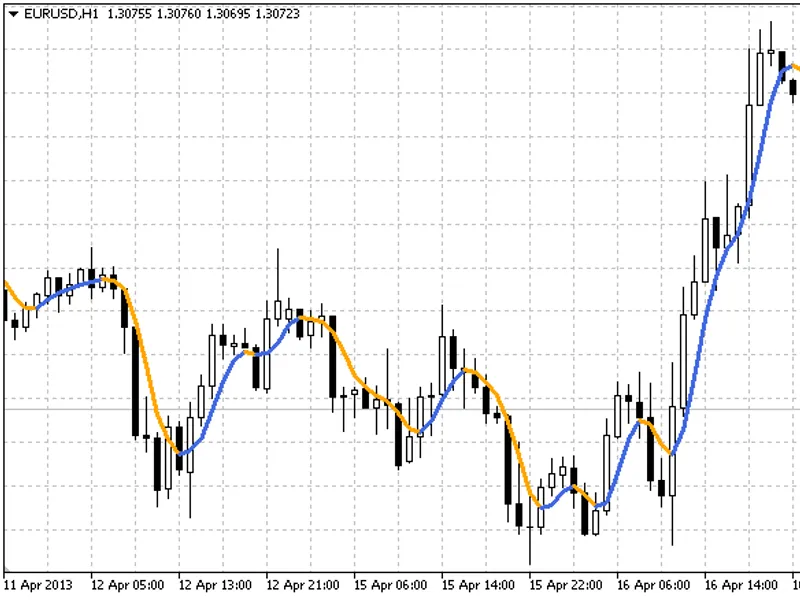
The VAMA (Velocity and Acceleration Moving Average) is an indicator based on the principle of price shift, utilizing a smoothed EMA and increments of the first 3 orders with a step...
svm-dThe fast trends indicator is drawn based on two moving averages. Essentially, two lines of the momentum indicator are drawn using these moving averages with SMA and EMA averag...
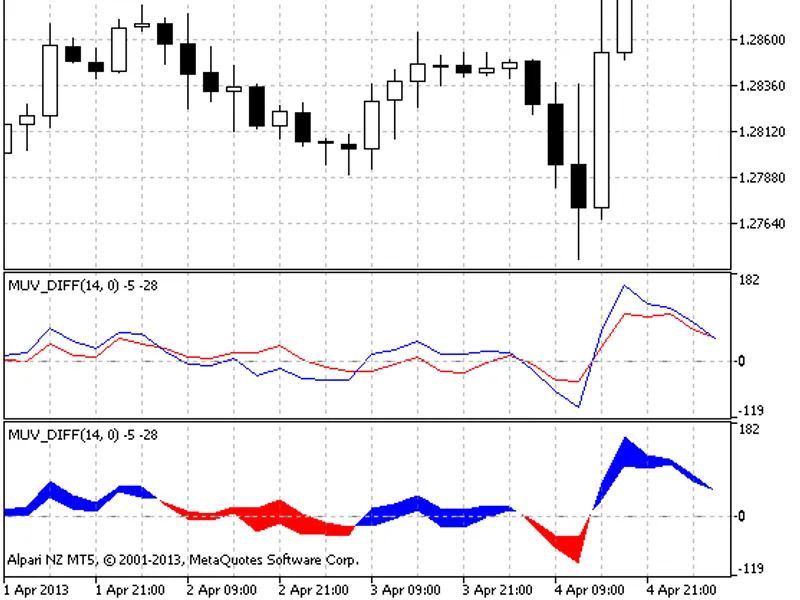
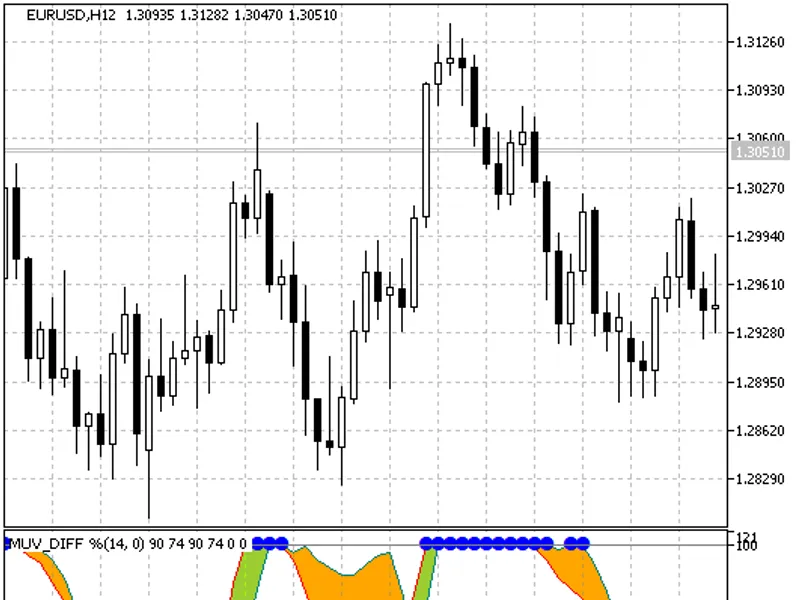
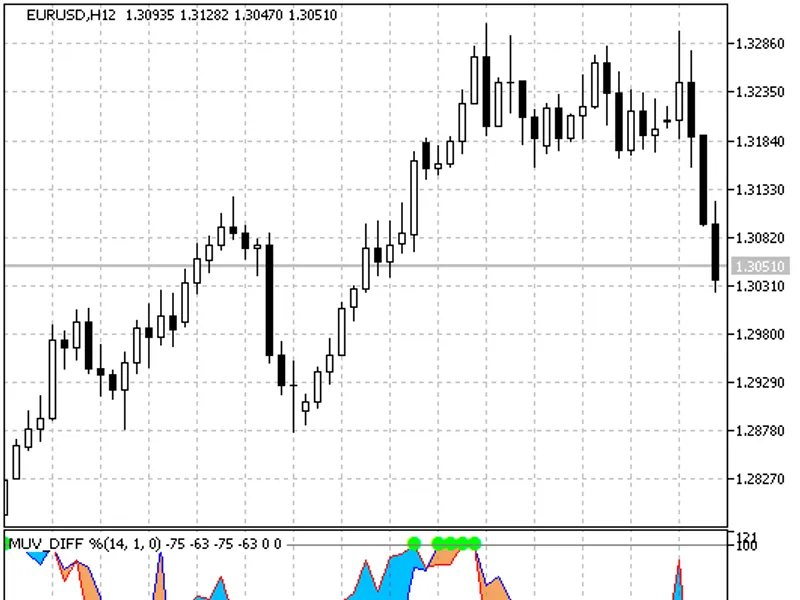
SVM-DThe MUV Cloud indicator is a trend-following tool that displays two moving averages, each with a different type of averaging (SMA and EMA), resulting in a range of values from...
SVM-DThis fast trends indicator is drawn based on two moving averages. It displays two lines of the momentum indicator, each calculated using a different moving average (SMA and EM...
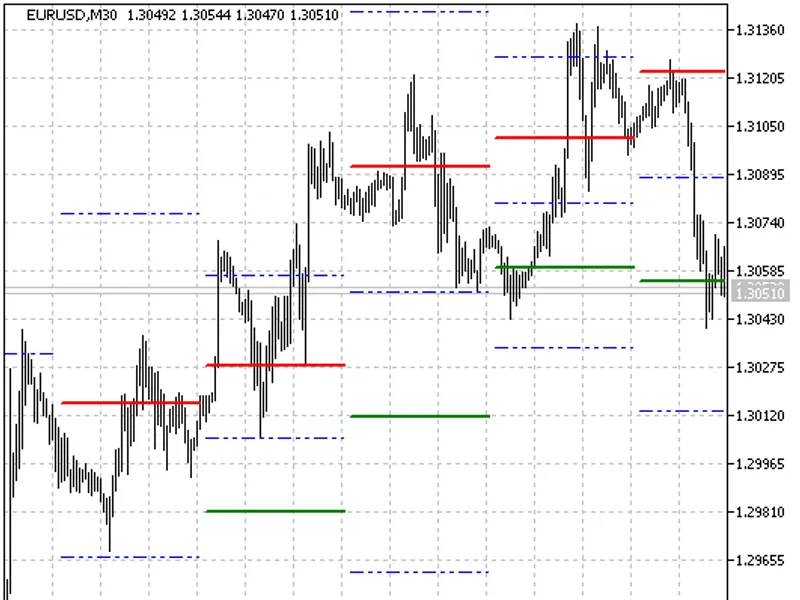
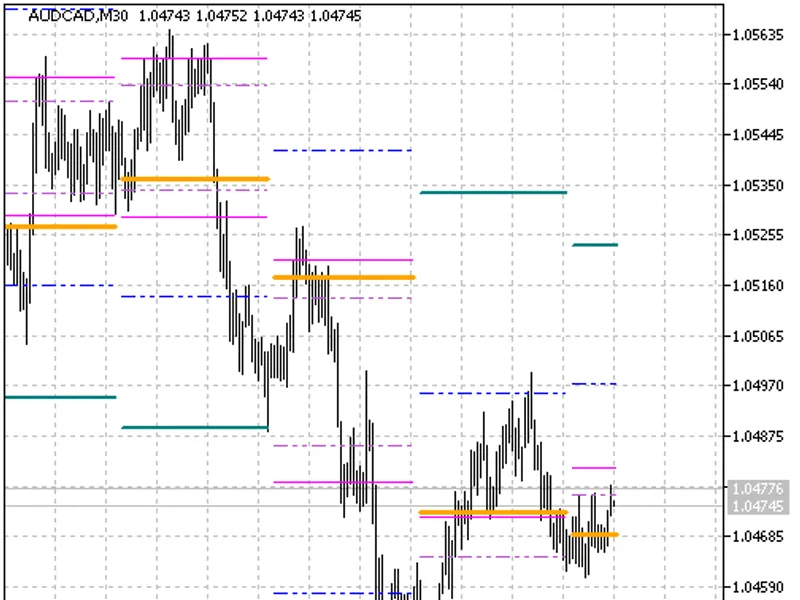
This indicator reveals support and resistance levels on day charts.The Waddah Attar Hidden Levels indicator was initially developed in MQL4 and released on 15.11.2022.Fig.1: Waddah...
igorad.This indicator concept was created in 2026. It is named after its creator, with the name being a palindrome.Example:You can see an example of this indicator's usage in a fil...
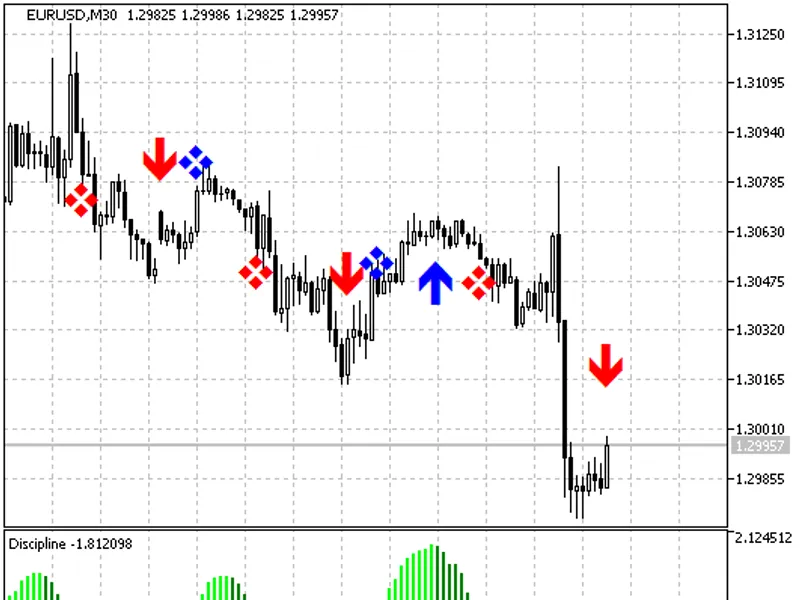
The Discipline Trend Reversal Indicator is a powerful tool for traders, offering a clear visual representation of market trends and generating precise signals for position entry an...
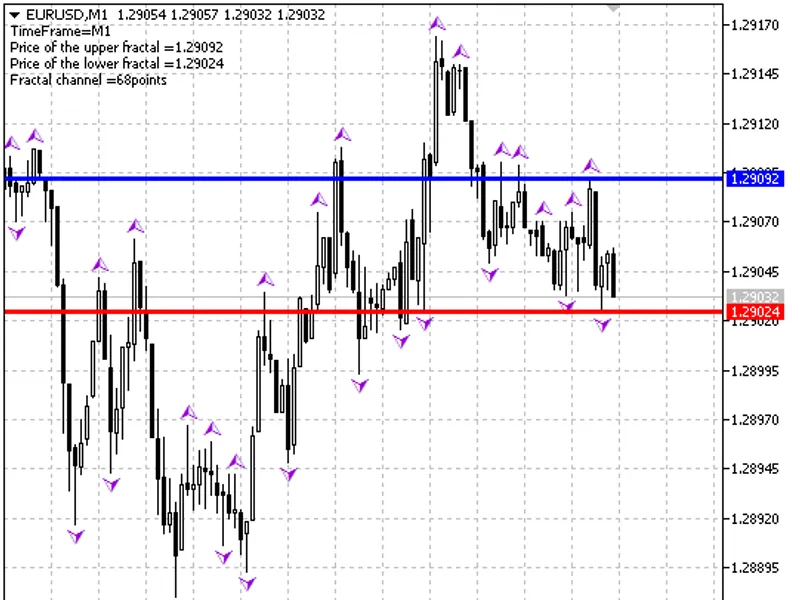
The Fractal Level Xrust indicator is a powerful tool for traders, providing a clear visual representation of fractal patterns and their associated levels. It draws horizontal lines...
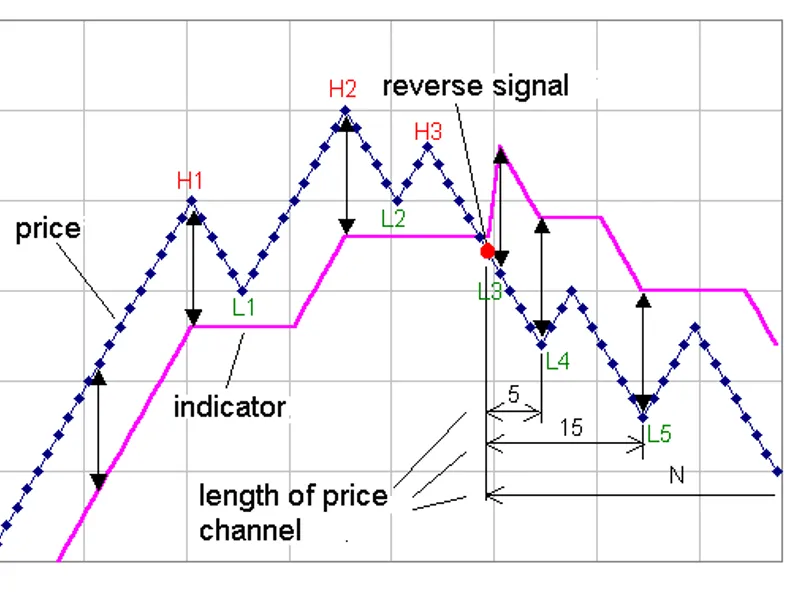
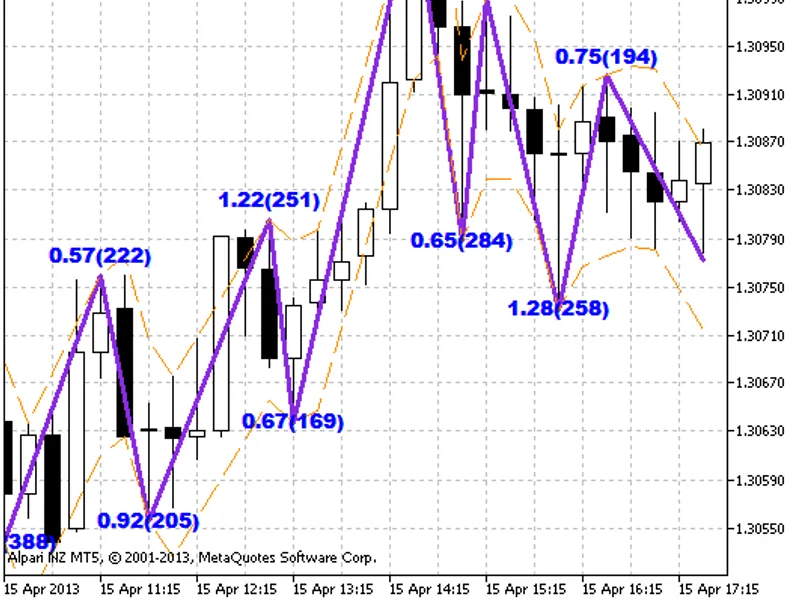
The Channel ZZ indicator is a unique tool that utilizes the channel principle to create a zigzag pattern on the chart.This indicator provides valuable insights by displaying statis...
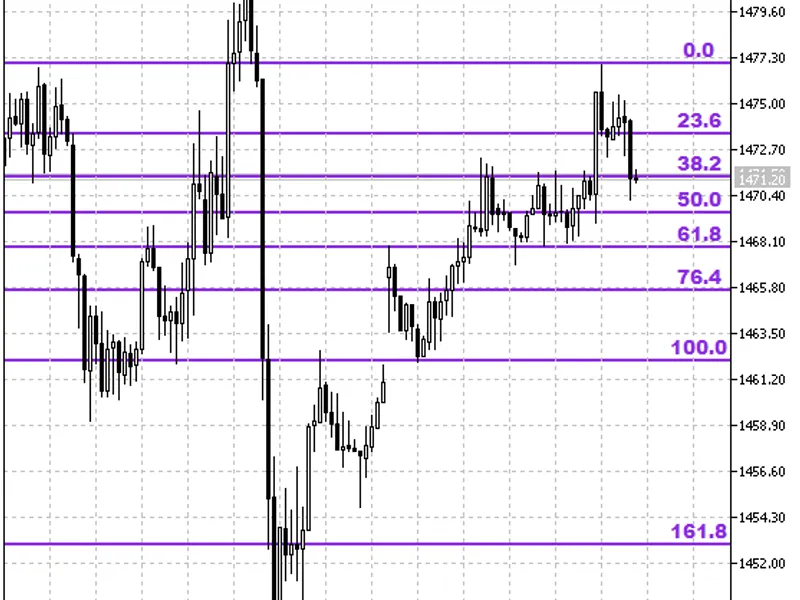
The indicator automatically draws Fibonacci lines based on yesterday's or today's price range.Here's how to use the indicator input parameters:- AutomaticallyAdjustToToday (Adjustm...
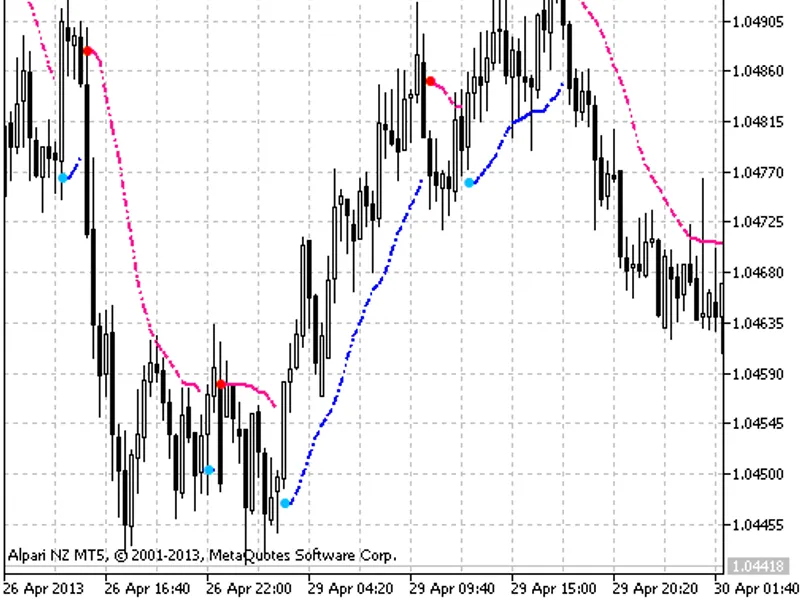
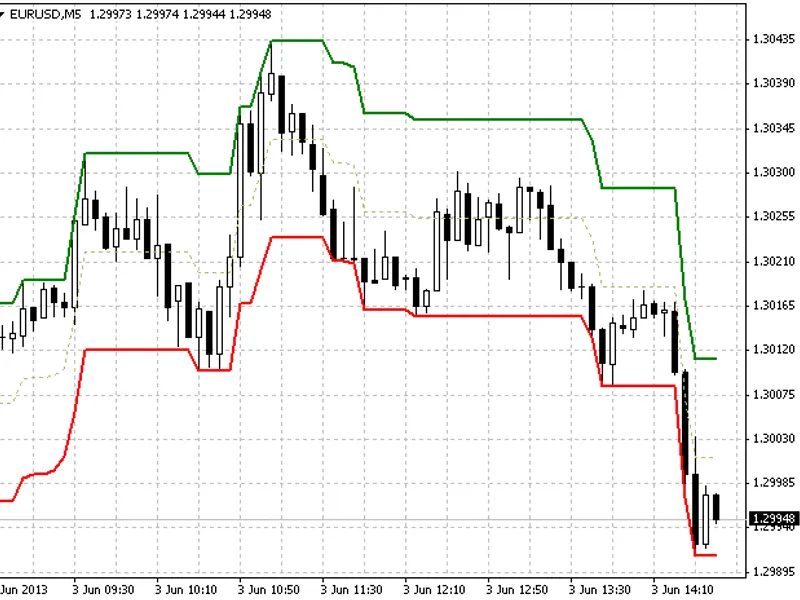
A semaphore signal indicator utilizing two moving averages in the form of NRTR. These moving averages form a channel, with equal periods of averaging, one based on high[] and the o...
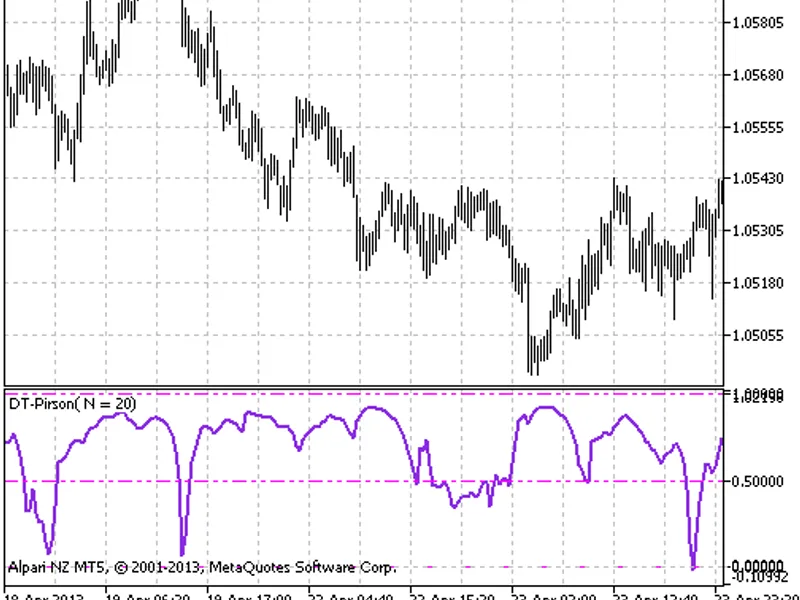
The DT-Pirson indicator measures volatility. Values above 0.5 suggest a strong trend, while the indicator drops towards zero in a flat market.This indicator was initially developed...
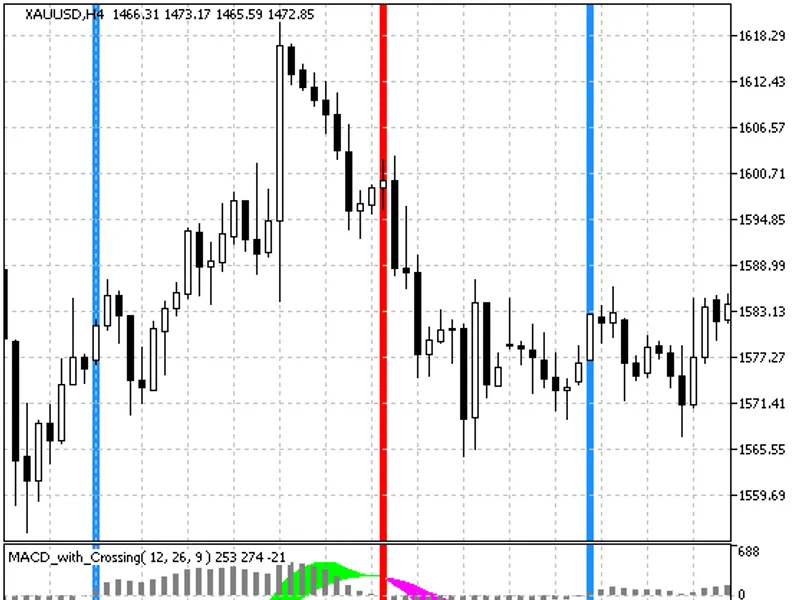
A variation on the MACD theme, this indicator utilizes colored bars as signals for entry and exit. The cloud color of the MACD aligns with the trend direction, providing a visual r...
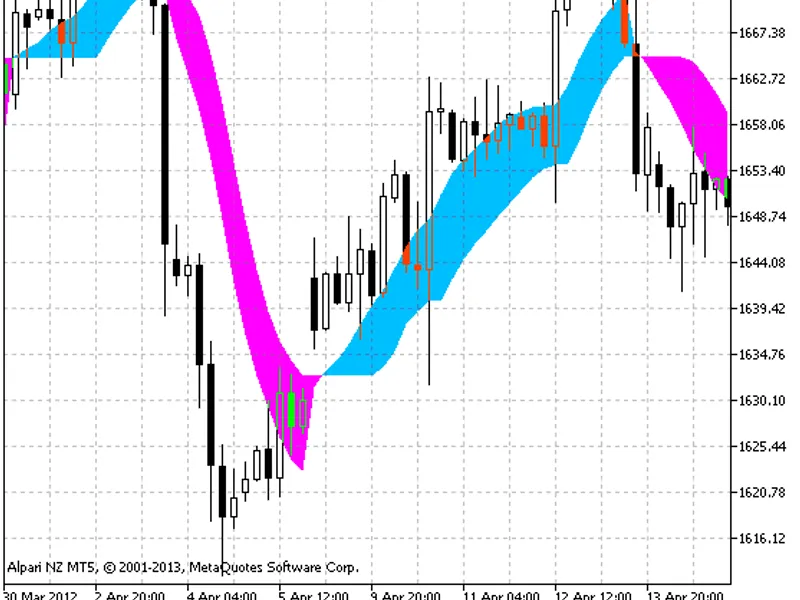
KalenzoThis indicator is a variation of the standard SSL indicator, presented as a coloured cloud. It alerts traders when the trend changes direction.The indicator was first implem...
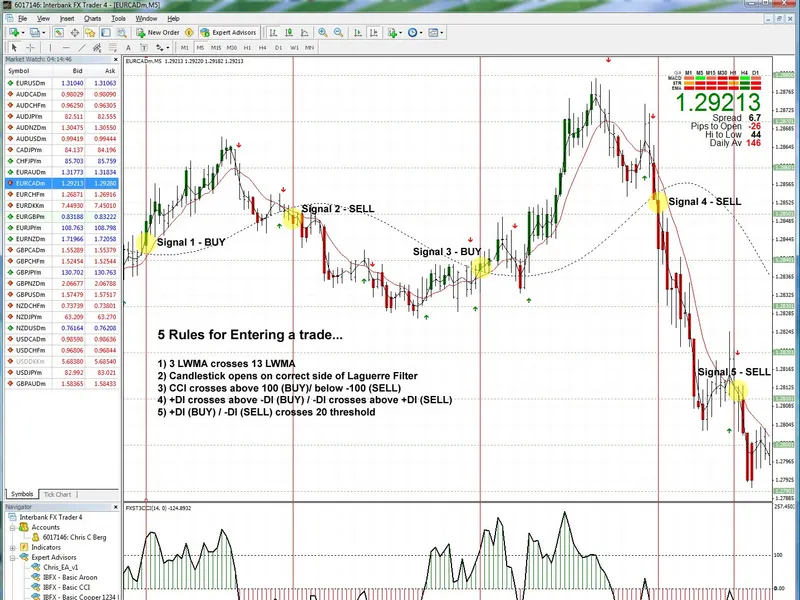
I aim to create an alert system based on five trading rules I use daily. Here's an overview of the rules and the initial script.This strategy is designed for short-term momentum tr...
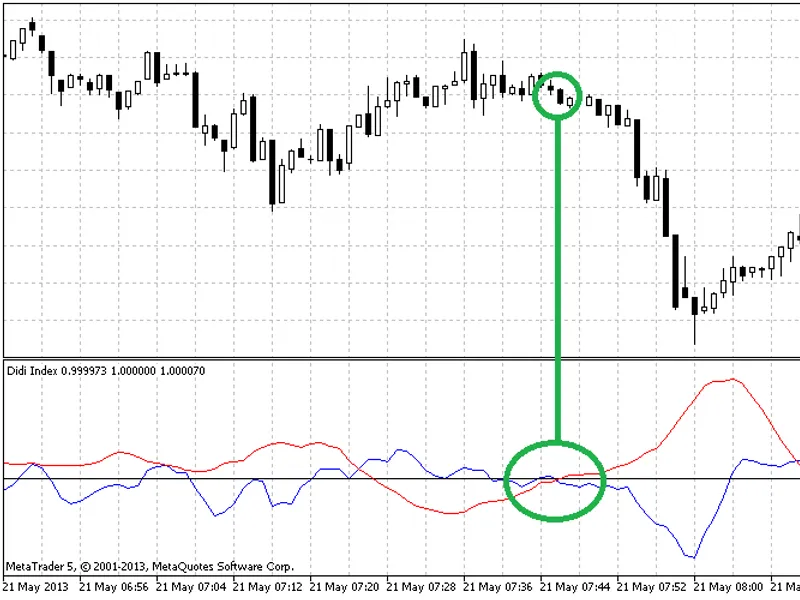
The Didi Index is an indicator developed by Brazilian analyst Odir Aguiar (Didi). It consists of three moving averages, known as Didi's needles, which enable the visualization of r...
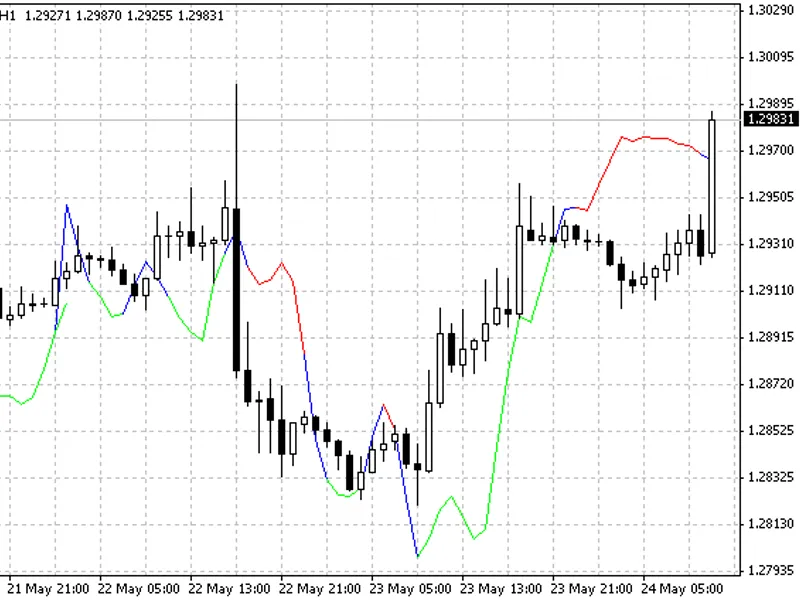
The Gruch Average Trend Line is a unique moving average that categorizes and weights prices differently from traditional weighted moving averages (WMA). It classifies prices into d...
the indicator specifies on trend and lateral movements of the price.The description of adjustments:- period_fast - period of averaging for calculation fast sliding average;- period...
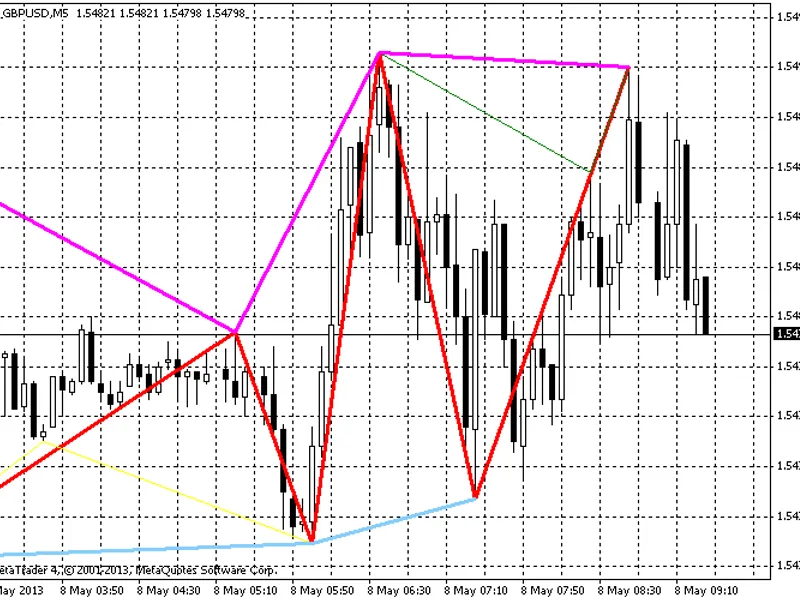
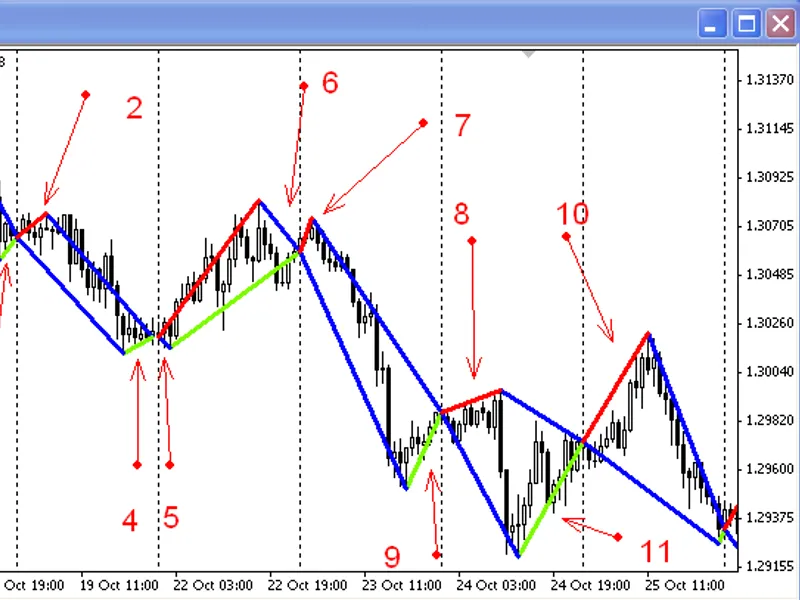
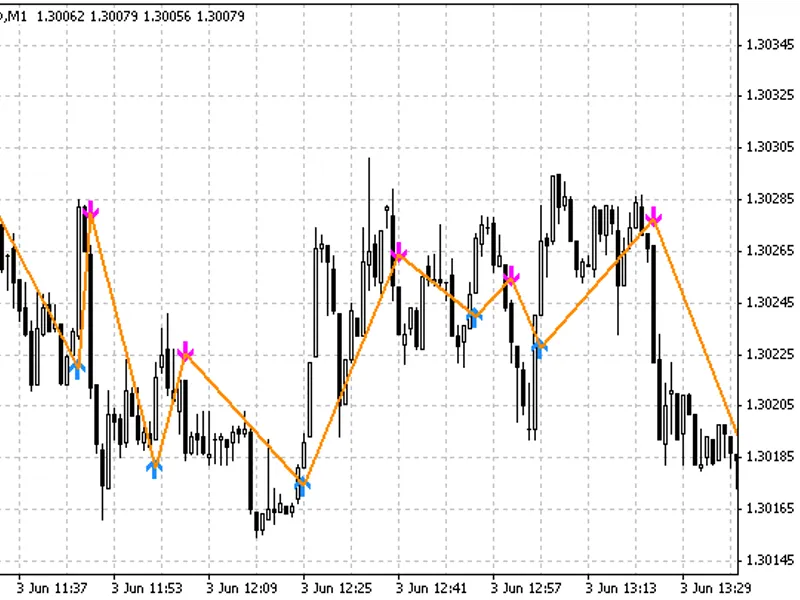
This indicator displays a zigzag pattern with lines connecting the lows and highs.Buffer 1 is a normal zigzag thick red line.Buffer 2 is a highmap buffer thin green line.Buffer 3 i...
This indicator is a powerful tool for traders, offering a unique approach to trend analysis and market entry/exit signals.It is designed to provide a more robust and responsive alt...
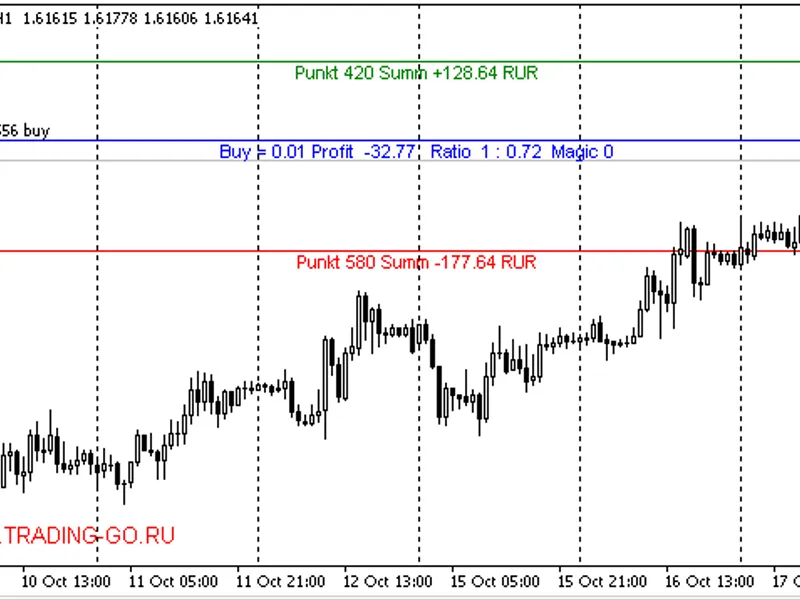
This indicator provides valuable information for traders using the MetaTrader platform.It displays the following details for order openings:- Order type- Lot size- Profit- P/L rati...
The moving average (MA) is a widely used technical analysis tool, and this indicator proposes a modification to enhance its versatility.By utilizing a unique approach, the IMP MA a...
This indicator automatically adjusts the Simple Moving Average (SMA) period based on the selected timeframe, providing a dynamic tool for technical analysis.When a trader opens an ...
The indicator for quadrangle patterns, designed for hourly timeframes.It displays a quadrangle figure with angles representing:- Daily open- Daily high- Daily close- Daily lowThe s...
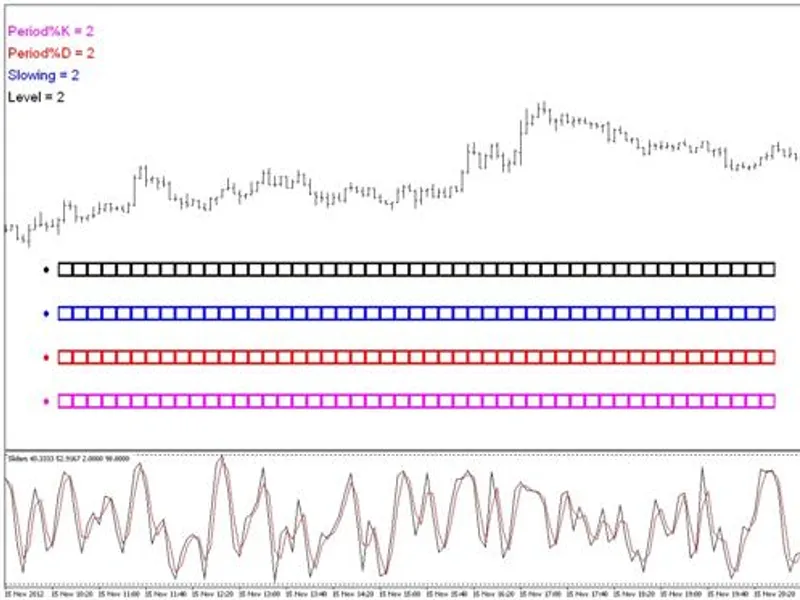
Adjust the period and other values of technical indicators with ease using visual sliders in the chart window. No need to manually change values in the input window or take your ey...
The Inverse Reaction Indicator is based on the concept that an unusual impact on price changes will trigger an inverse reaction. This phenomenon can be observed in various scenario...
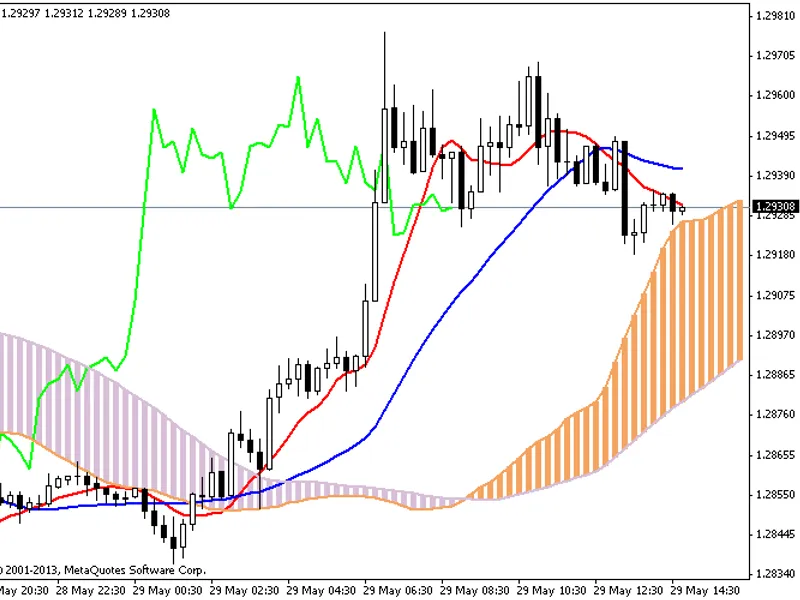
Ichimoku with a moving average instead of the middle of the price channel (Donchian channel).Choose the following parameters:- Price: 4 (Median Price)- MA Type:- 0: Simple Moving A...
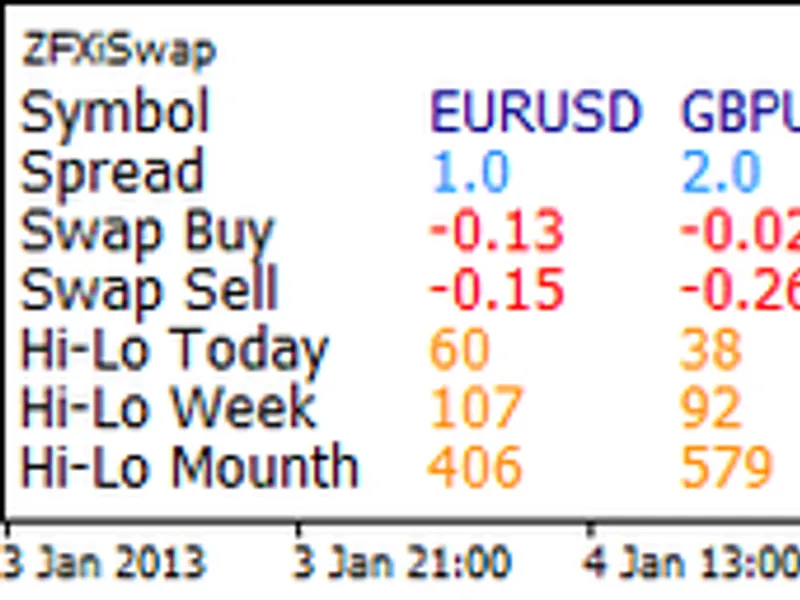
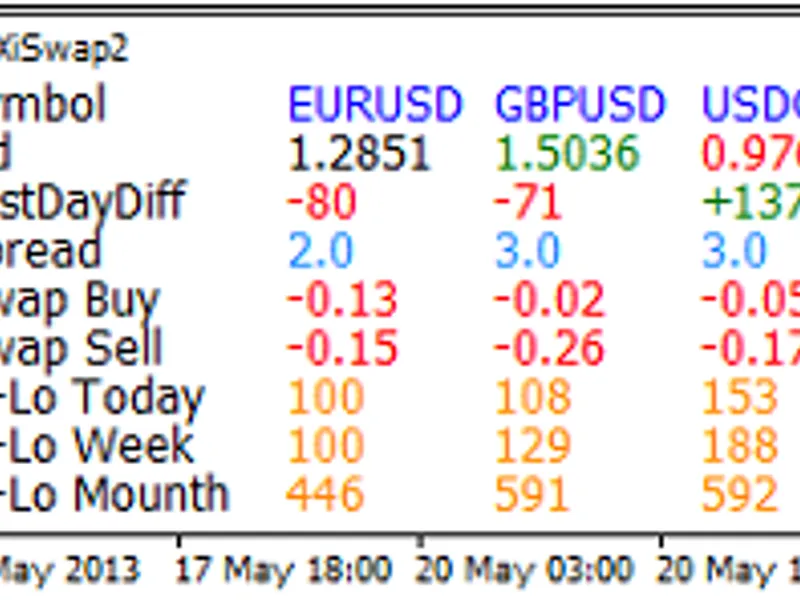
This indicator allows you to view the swap, spread, and high-low values for any symbol on a daily, weekly, or monthly basis in a separate window.The symbols must be included in a p...
This powerful tool is designed to capture chart screenshots at regular intervals, enabling comprehensive analysis of indicators, price action, and multiple timeframes.Ideal for bac...
This indicator is a powerful tool for traders, offering a clear visualization of the market's range and potential breakout points.External Variables:- Distance: The required maximu...
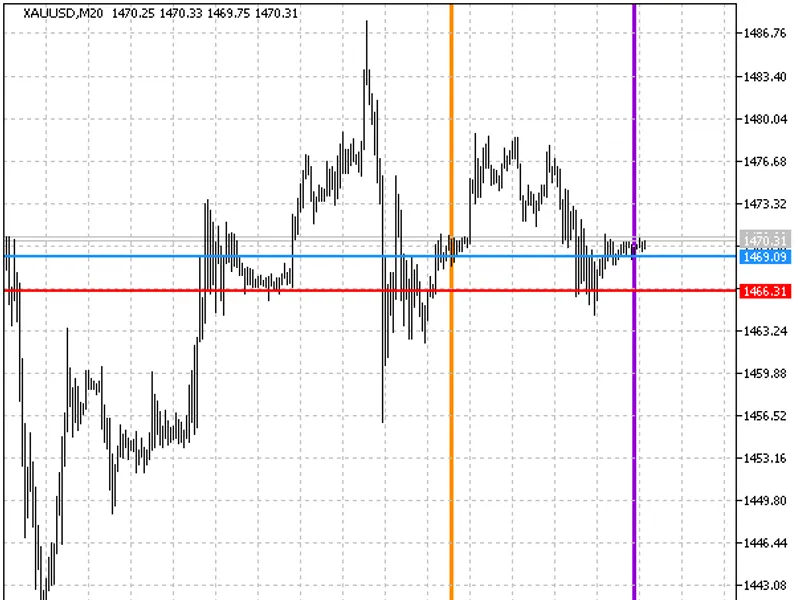
The Day Borders indicator is a powerful tool for traders, designed to visualize the boundaries of the calendar day for trading, based on the renowned trader Larry Williams' methodo...
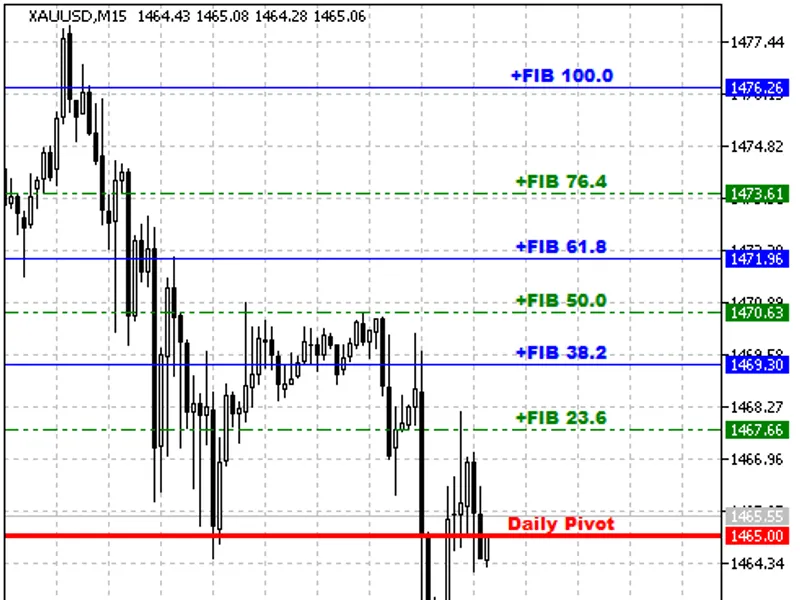
Daily Fibo support and resistance levels in the leverage from -300% to +300%. There are 36 levels plus pivot in total.This indicator was first implemented in MQL4 and published in ...
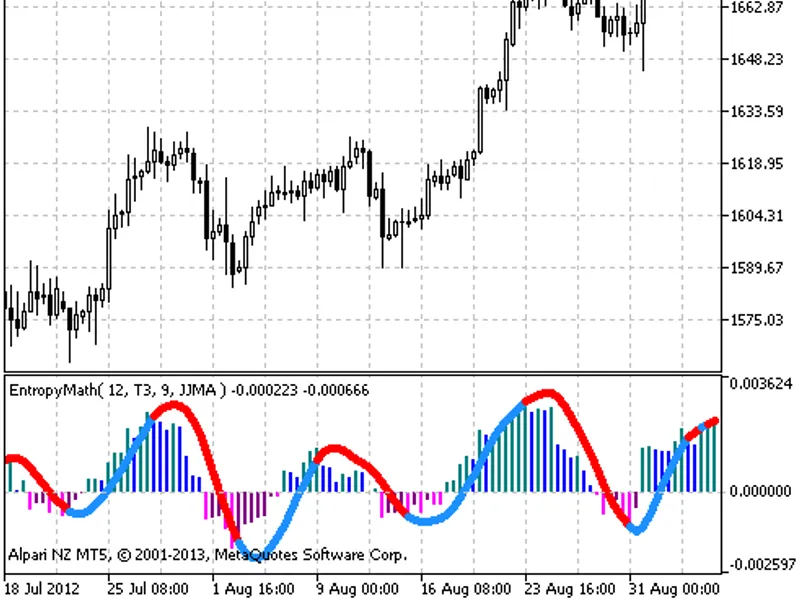
The Entropy Math indicator measures system disorder using a method of random sample entropy calculation. The 'numbars' setting parameter adjusts the window width or indicator perio...
The indicator draws candlesticks based on the CCI (Commodity Channel Index) indicator's overbought and oversold levels. Entry points into these zones are determined by the input pa...
The trend indicator is drawn as a cloud, with envelope clouds representing the weight coefficients of price increments over a period. The indicator's range is 0 to 100%. A value of...
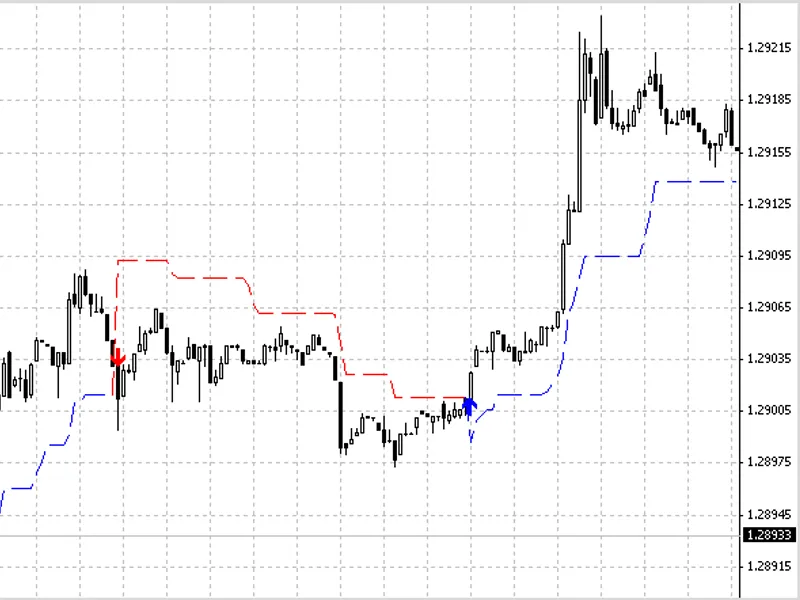
The Volty Channel Stop indicator is a powerful tool for trend analysis, offering alerts and push messages to keep traders informed. Signals are generated based on the last closed b...
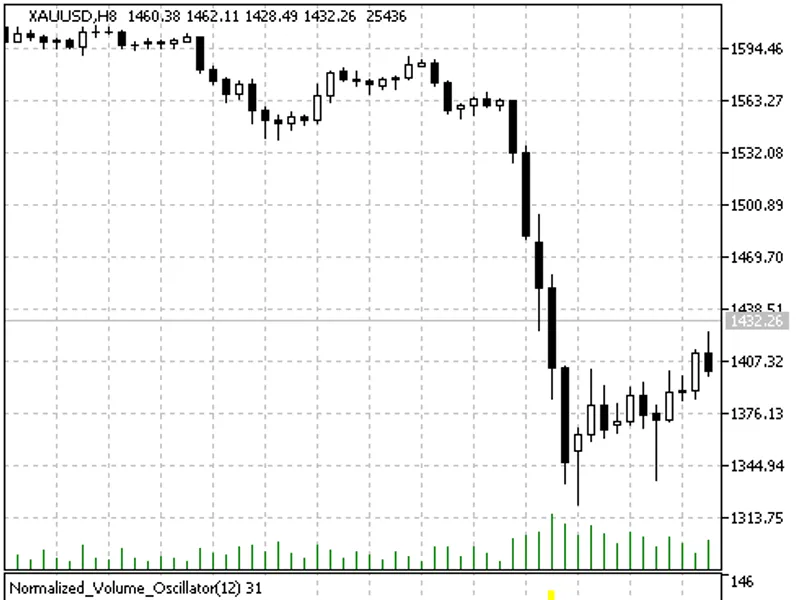
The indicator is a development of the idea of normalized volumes. Volume normalized values are expressed as a percentage of the average value for the period, allowing for negative ...
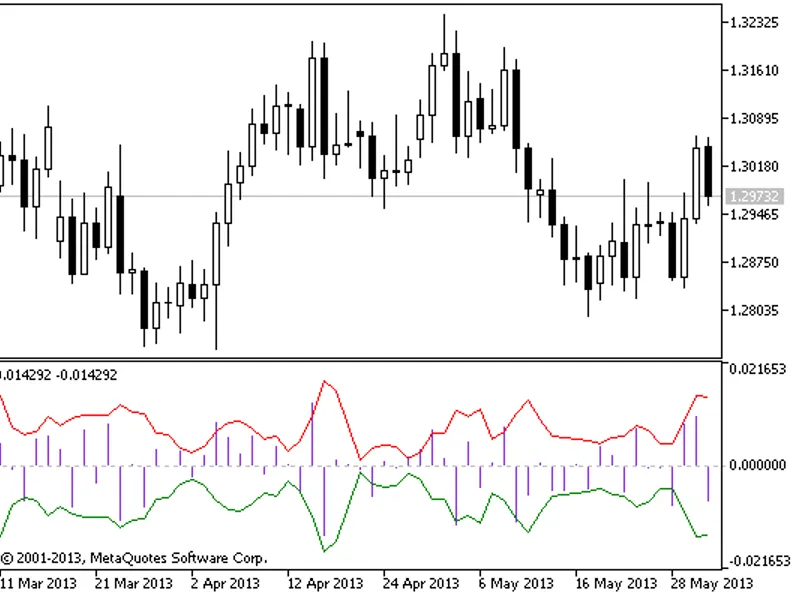
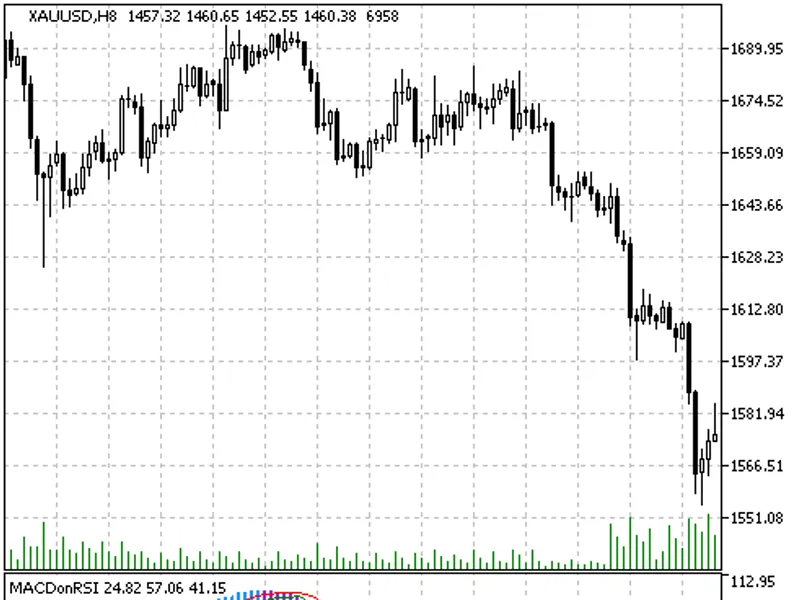
The MACD Histogram is drawn based on the RSI smoothed oscillator. The red line represents the signal line of the histogram, while the green line is the RSI oscillator plotted on mo...
The Channels indicator automatically identifies linear channels across all timeframes.Upon initial launch, the indicator may prompt a notification regarding insufficient historical...
This is an updated version of the Trendsignal indicator.The new version enhances the indicator's functionality by drawing lines on the chart to visualize potential pip coverage. Th...
View any symbol's bid, last day's difference in percentage or pips, spread, swap, and high-low values for today, this week, and this month in a separate window.The symbols must be ...
This indicator draws the Kijun Sen line, an envelope, and three price labels. These elements can be shown or hidden as needed.The envelope can help identify price ranges, overbough...
This indicator is designed to assess the strength of bulls and bears in the market, aiding traders in identifying optimal entry points.It builds upon the iBull/iBear concept, intro...