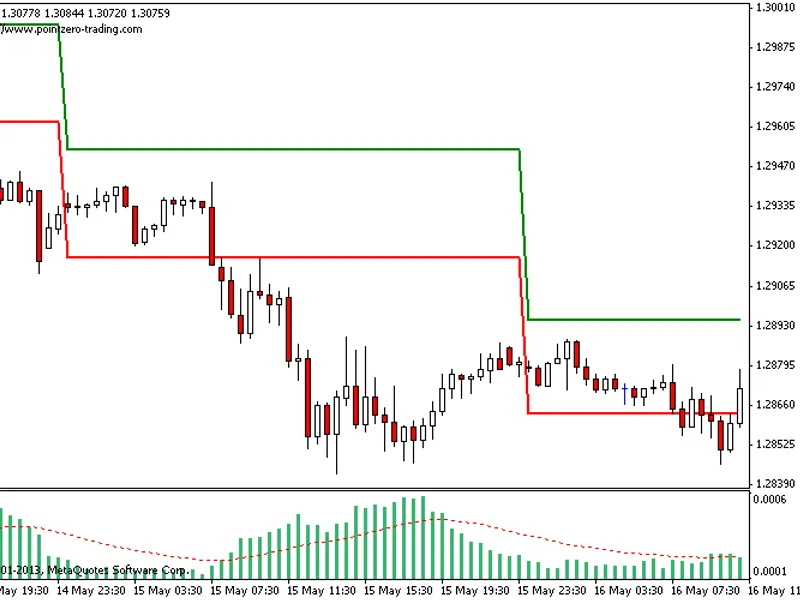
The Stretch is calculated by taking the 10-period simple moving average (SMA) of the absolute difference between the open and either the high or low, whichever difference is smalle...
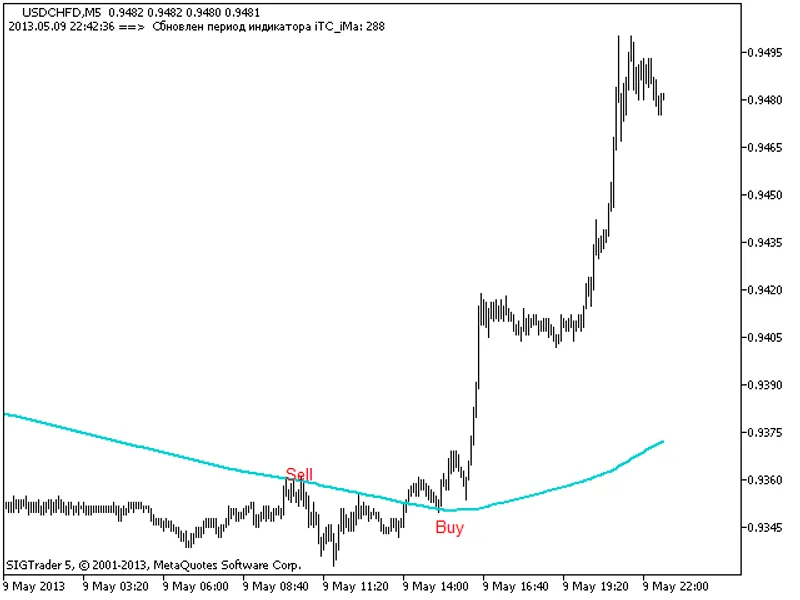
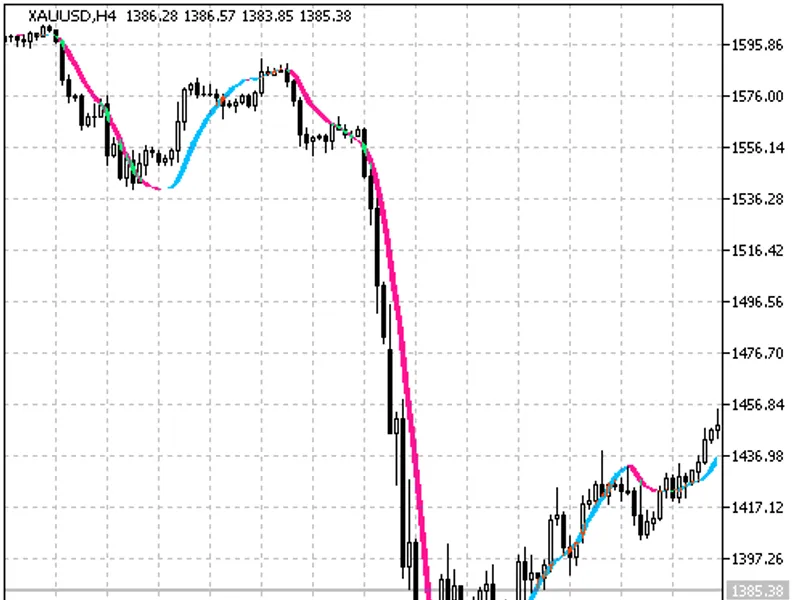
The TF Adaptive Moving Average indicator automatically recalculates the moving average period when the time frame is changed. For example, when a monthly chart is opened, the indic...
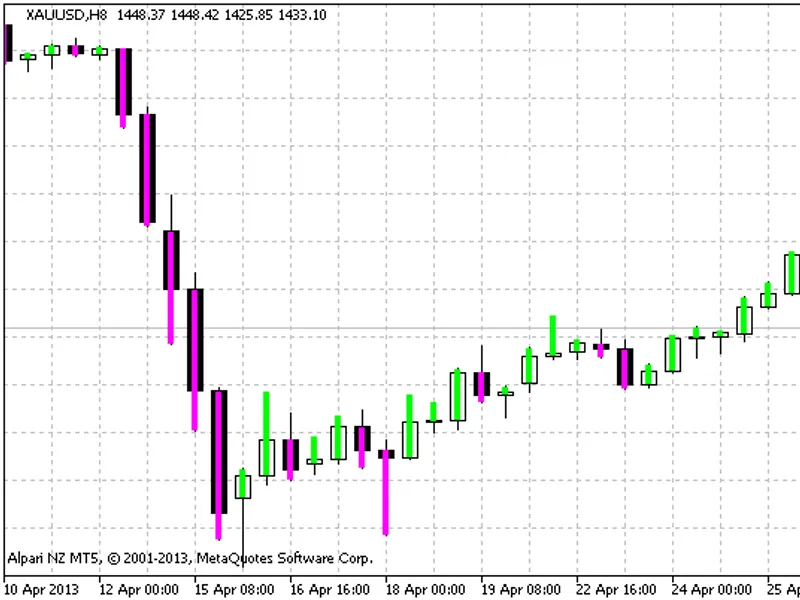
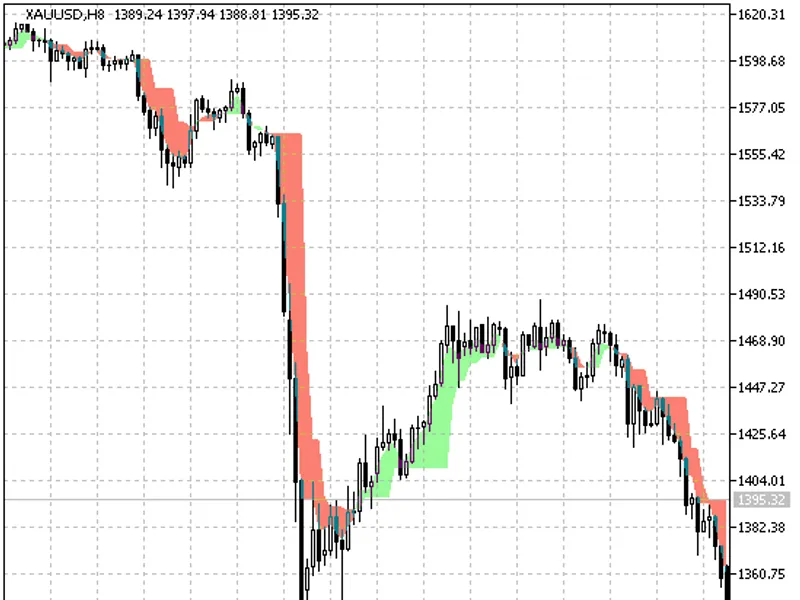
The Prusax indicator paints the part of the bar depending on the direction of the candlestick. If a candlestick is growing, the bar is painted in light green from open to high. If ...
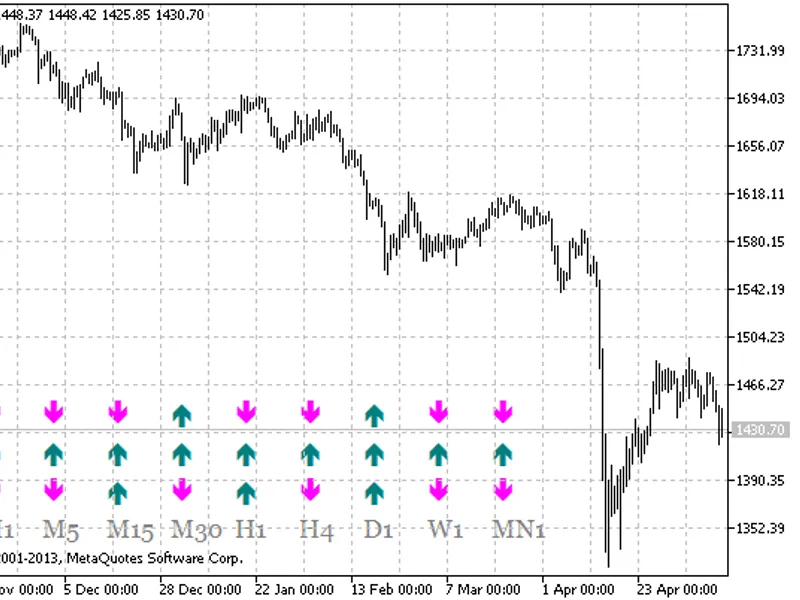
This indicator shows buy and sell signals of three indicators (ISAR, IWPR and IMA) on nine timeframes.Indicator DetailsThe indicator uses a class of library that should be copied t...
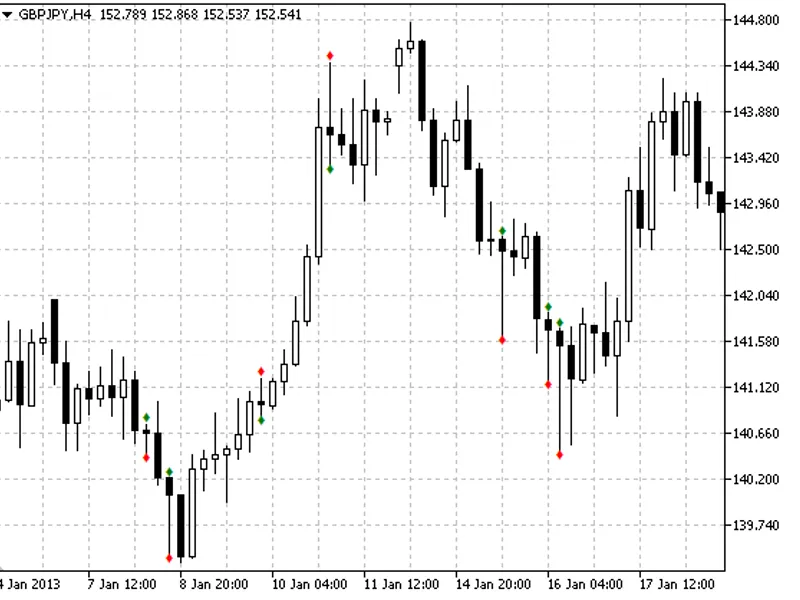
The Xpoints indicator predicts possible reversal points in the market. An interesting pattern can be observed on the EURUSD chart, where certain bars exhibit specific features befo...
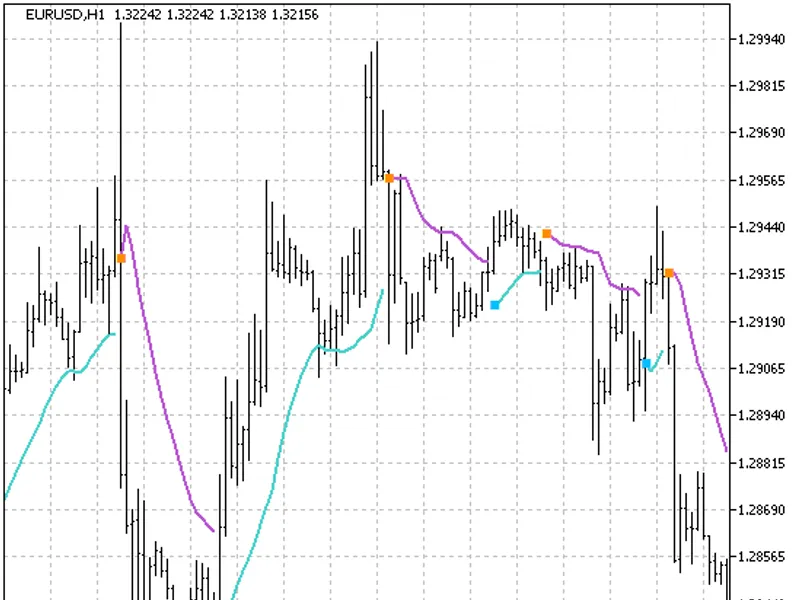
A simple trend indicator presented as a colored cloud. The cloud's edges are determined by LSMA and its EMA.This indicator was initially developed for MQL4 and released on May 17, ...
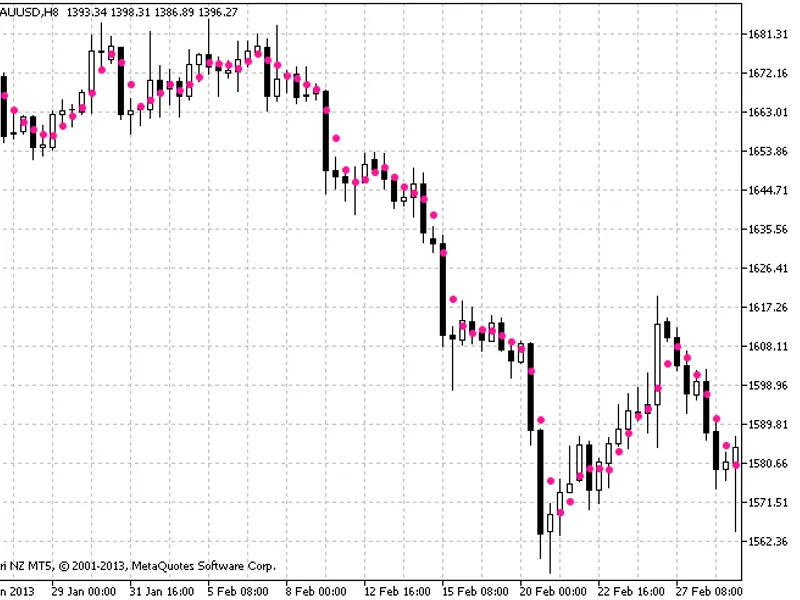
PLDot IndicatorThe PLDot indicator is a simple indicator that functions similarly to a moving average.Calculation Formula:pldot = sma(period=3, (high[bar] + low[bar] + close[bar]) ...
MVV Linear Regression Indicator
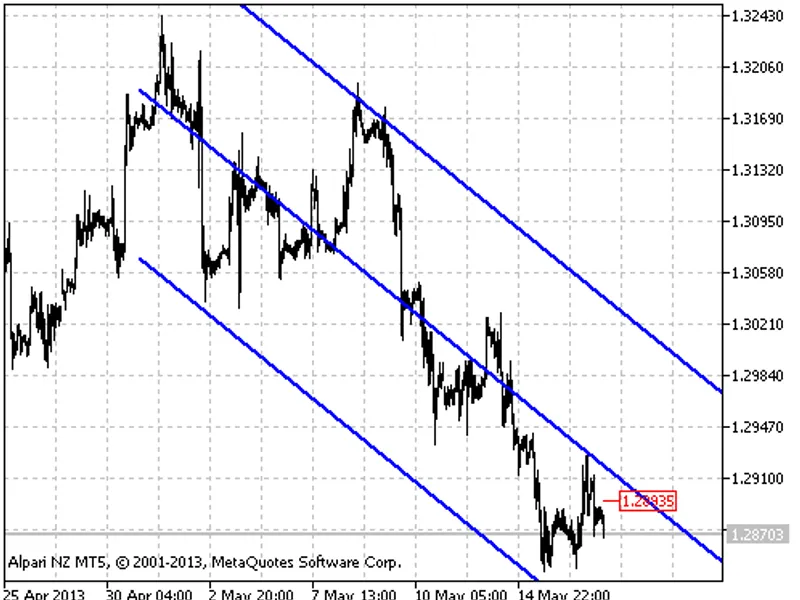
This indicator is a standard linear regression channel with support and resistance levels. When the start of the channel is aligned with a price ma...
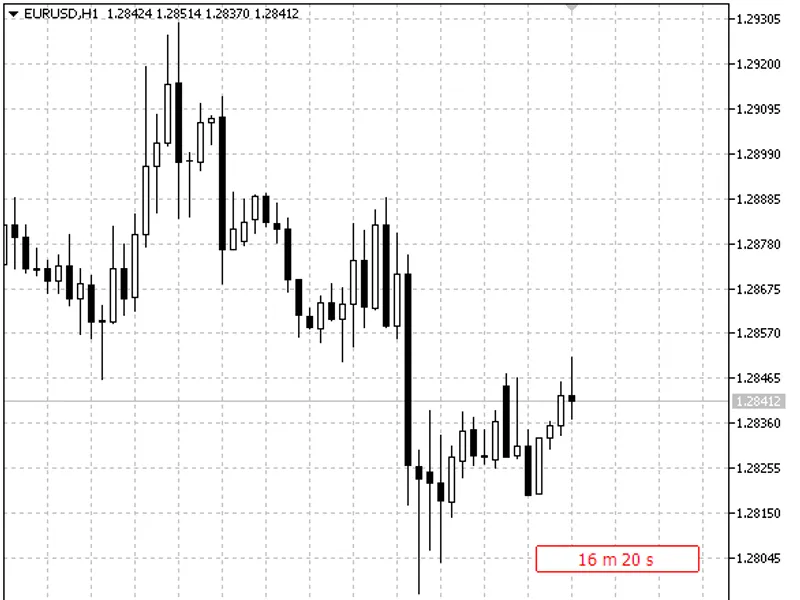
This indicator provides a clear and immediate display of the remaining time until the current candlestick closes. This is particularly useful for non-standard timeframes such as M1...
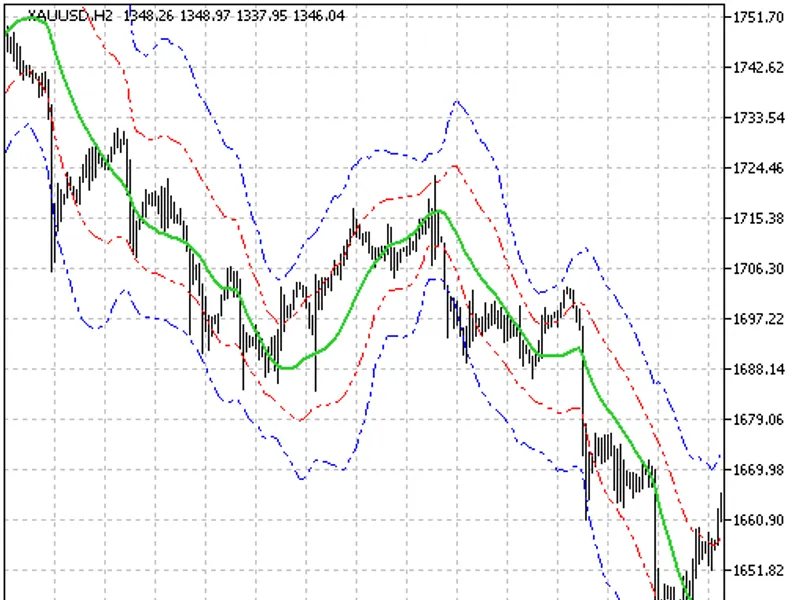
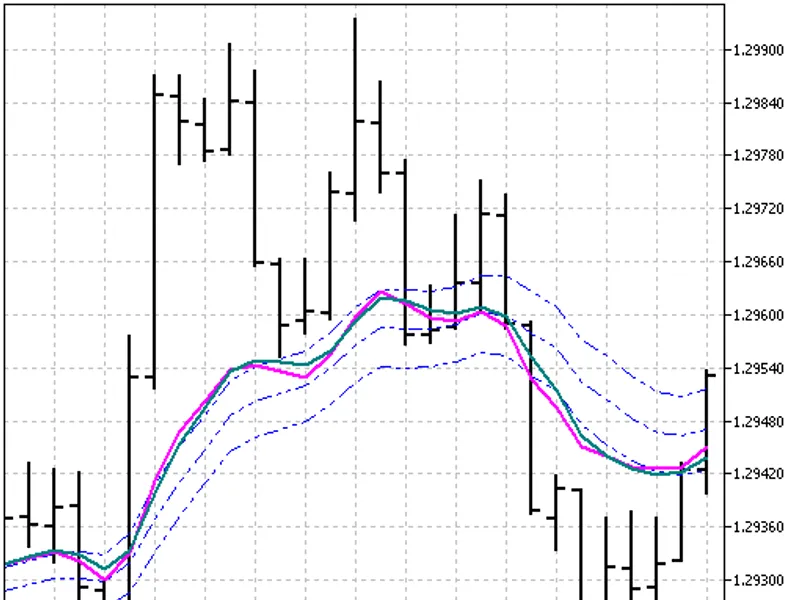
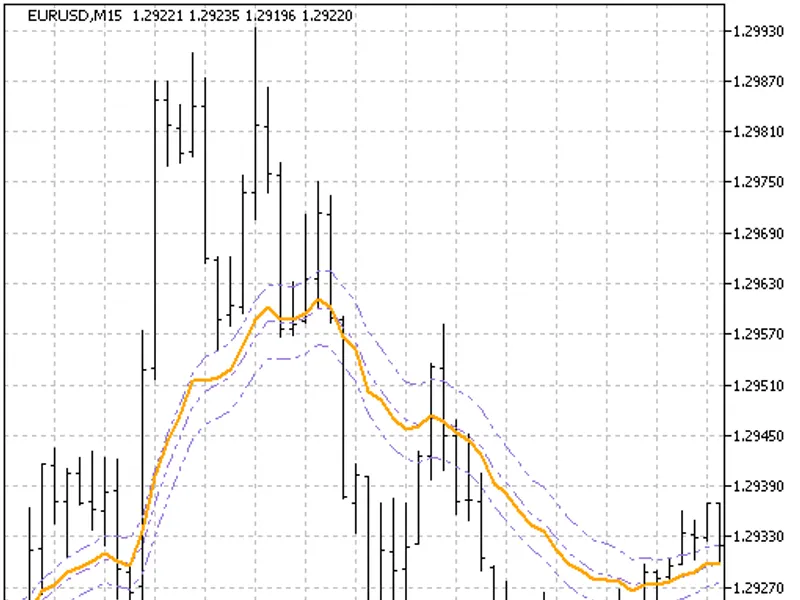
An advanced alternative to Bollinger Bands, designed to overcome the delay issues inherent in traditional averaging techniques. Standard averaging methods often provide information...
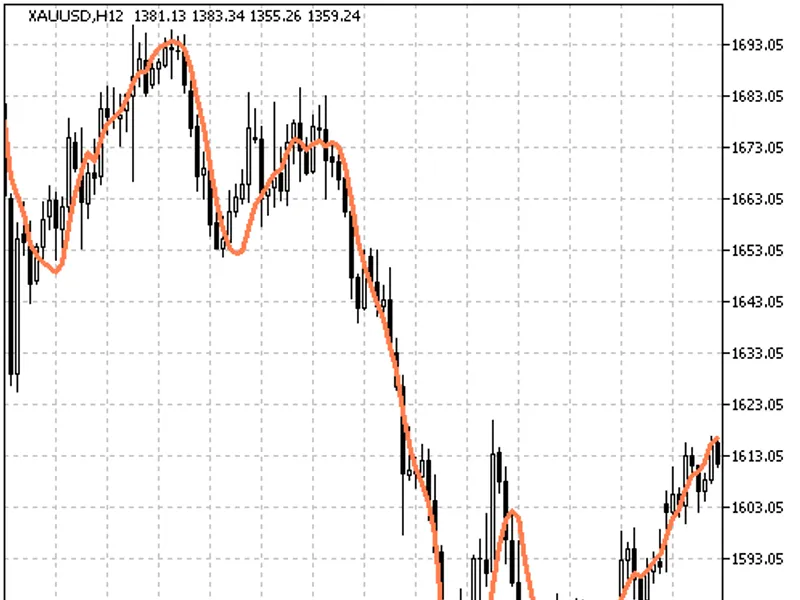
Linear Regression IndicatorA typical moving average using the linear regression algorithm.This indicator was first implemented in MQL4 and published on 17.05.2026.Figure 1. The Lin...
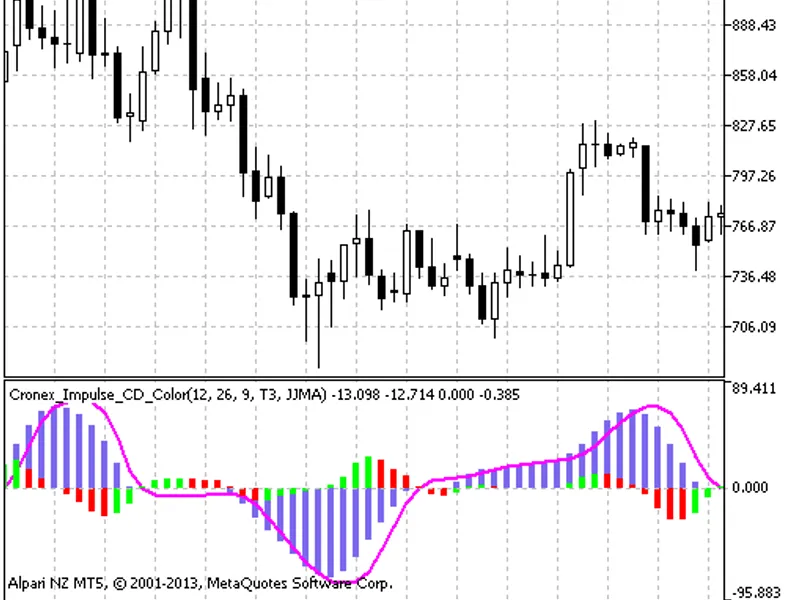
Cronex Impulse CD Color IndicatorThe Cronex Impulse CD Color indicator is a modification of the MACD histogram. Notes regarding this indicator are available.This indicator was firs...
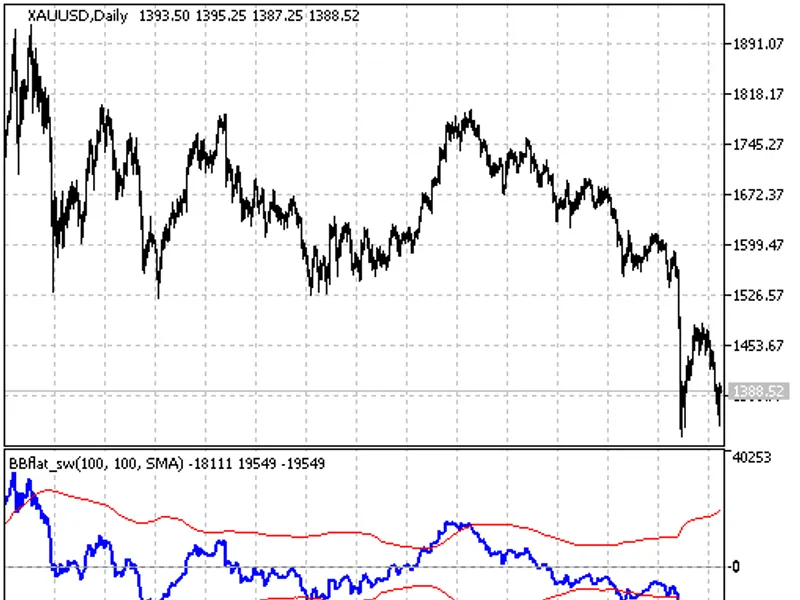
BBFlat SW is a straightforward implementation of the Bollinger Bands indicator designed to display in a separate window.Indicator Input Parameters:This indicator was originally dev...
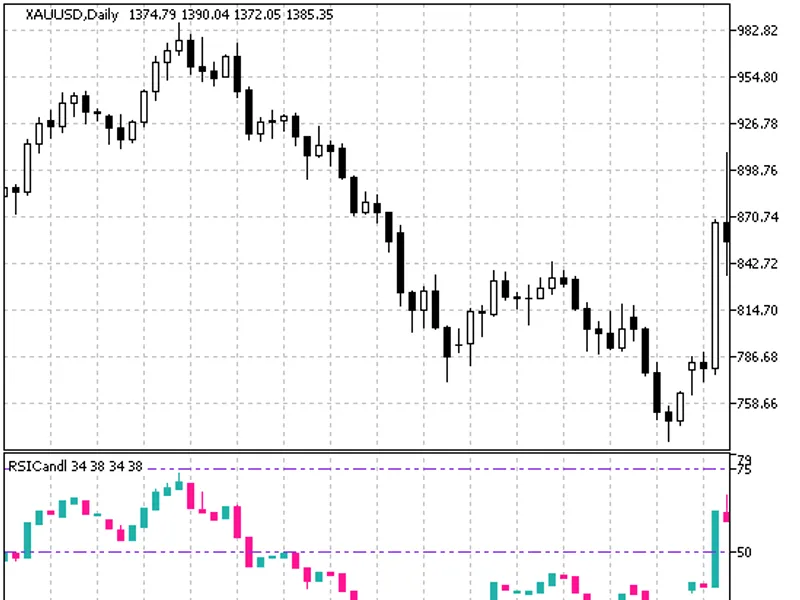
The RSI Candle indicator represents the Relative Strength Index (RSI) as a sequence of candlesticks. These candlesticks are formed by processing the relevant price time series thro...
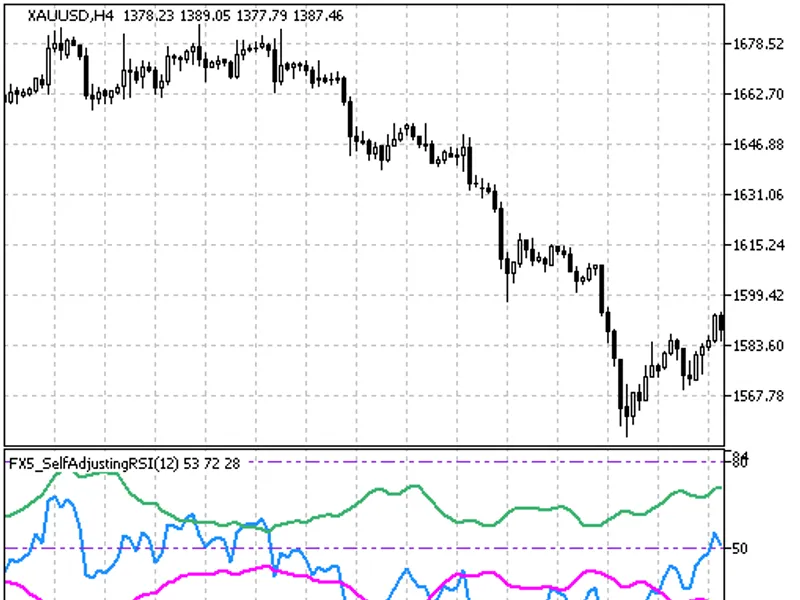
FX5 Self-Adjusting RSI IndicatorThe FX5 Self-Adjusting RSI Indicator is a variation of the Relative Strength Index (RSI) that incorporates Bollinger Bands to define the overbought ...
Stochastic oscillator displayed directly on the chart.This indicator also features a classical moving average applied to the chart. The stochastic oscillator's overbought/oversold ...
This indicator displays the RSI oscillator directly on the chart.In addition to the RSI, a classical moving average is drawn on the chart, which is used to calculate the RSI's over...
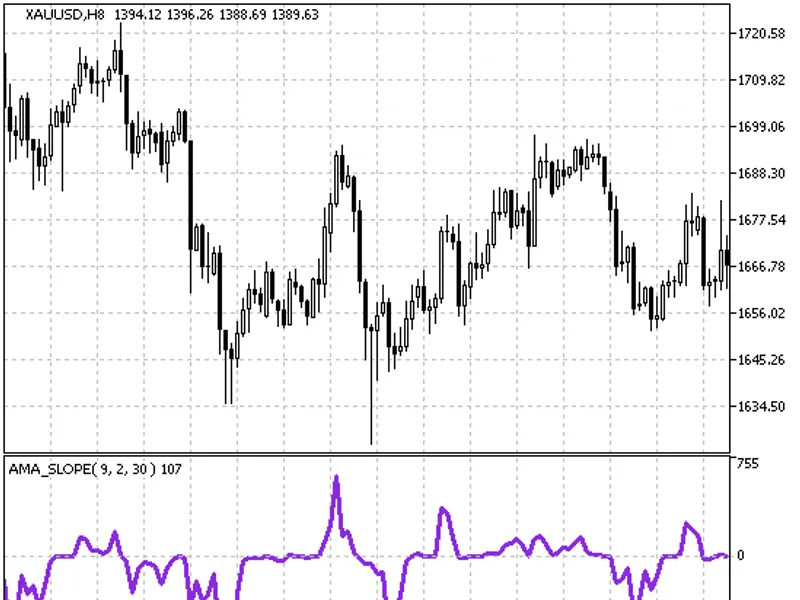
The AMA Slope indicator displays the rate of change of the AMA indicator in points on the price chart.This indicator was first implemented in MQL4 and published on 23.04.2026.Figur...
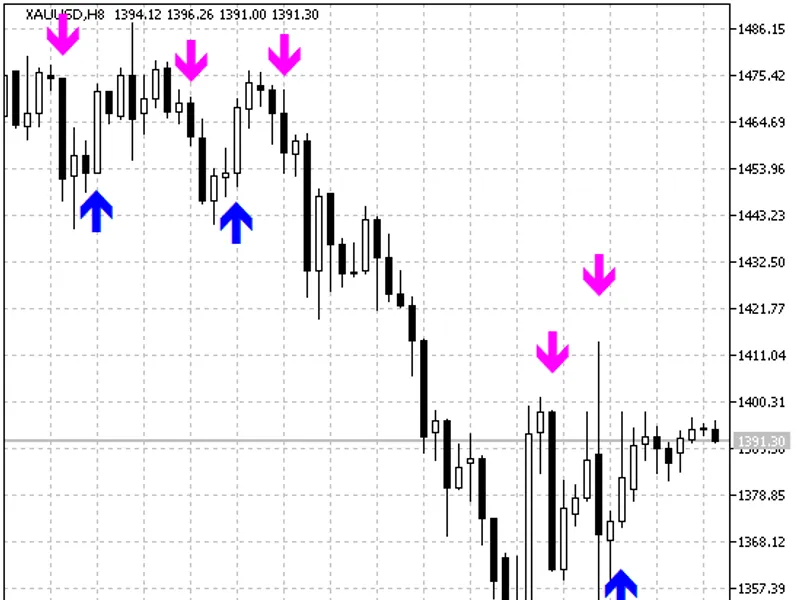
IINWMArrows Indicator
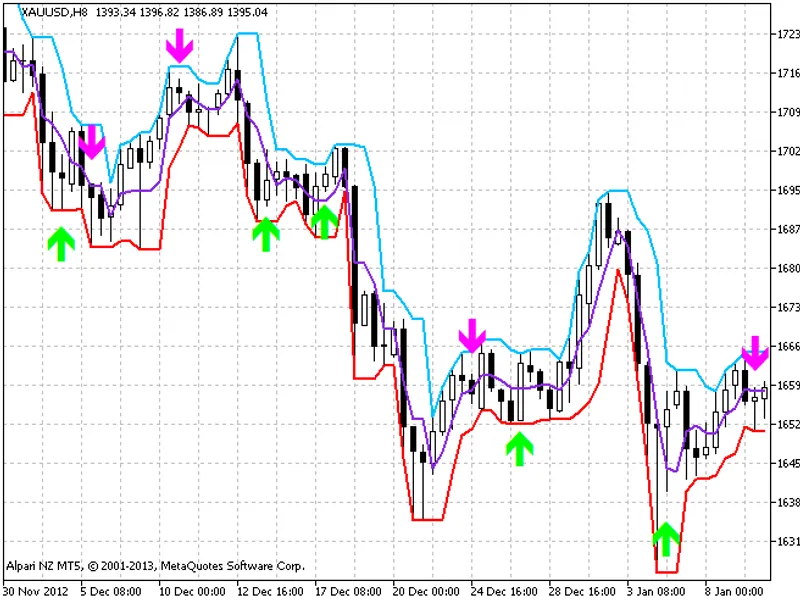
This is a semaphore signal indicator that uses moving averages. The signals are formed at the bend of moving averages when there are local extremes.
This in...
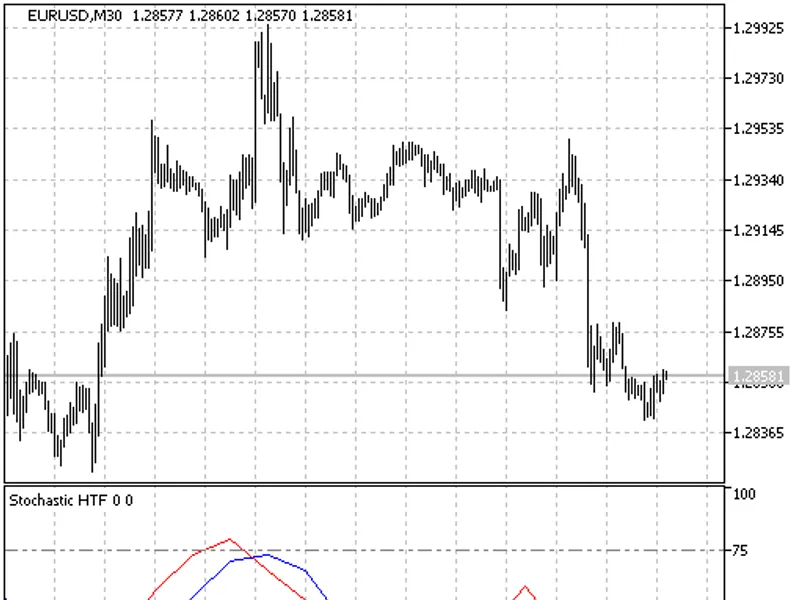
Stochastic HTF Indicator
This indicator offers the option to select a distinct timeframe for calculations, separate from the chart's applied timeframe.
This indicator was initial...
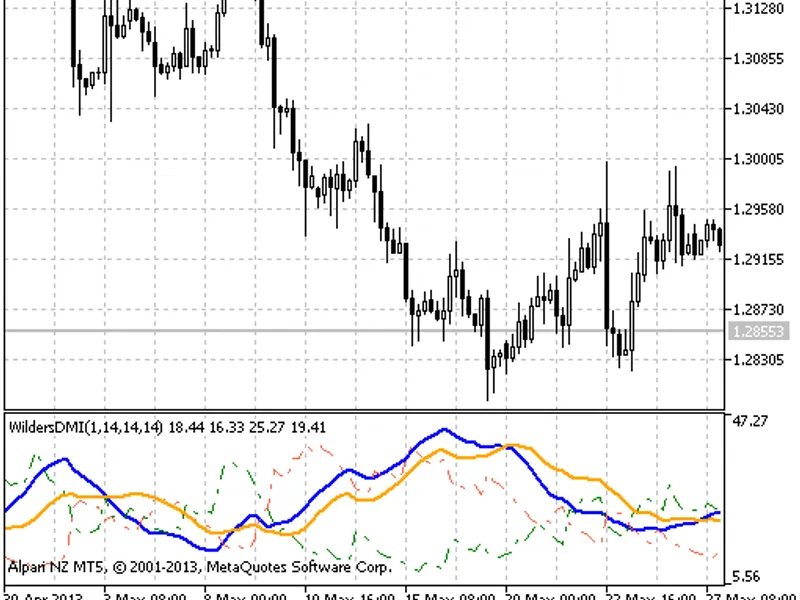
TrendLaboratory LtdA complex trend indicator that uses ADX for calculations.This indicator was first implemented in MQL4 and published in 2026.Figure 1. The WilderDMI Indicator...
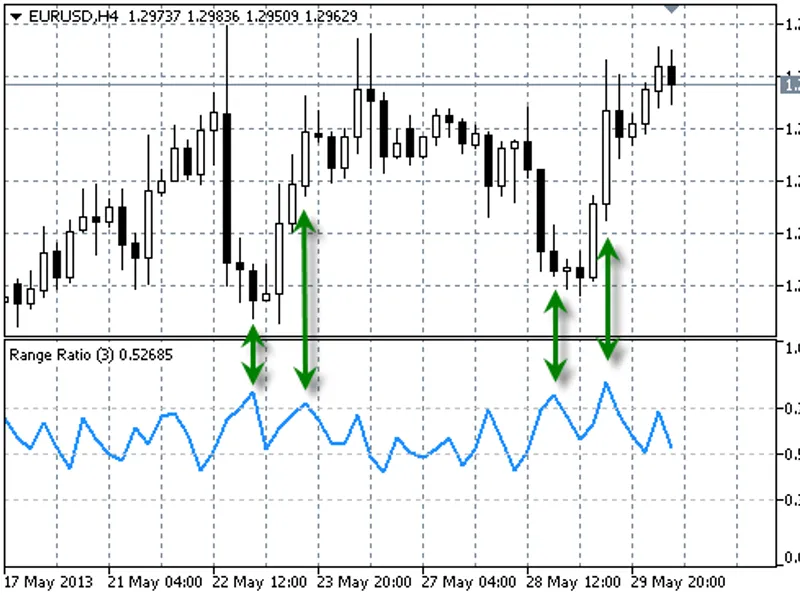
The Range Ratio indicator is based on the principle that during a strong, single-directional price movement, the range between the high and low of a selected period should approxim...
The XO indicator operates without averaging the data array, enabling buy/sell decisions in a single step.This indicator was initially developed for MQL4 and was published on 18.09....
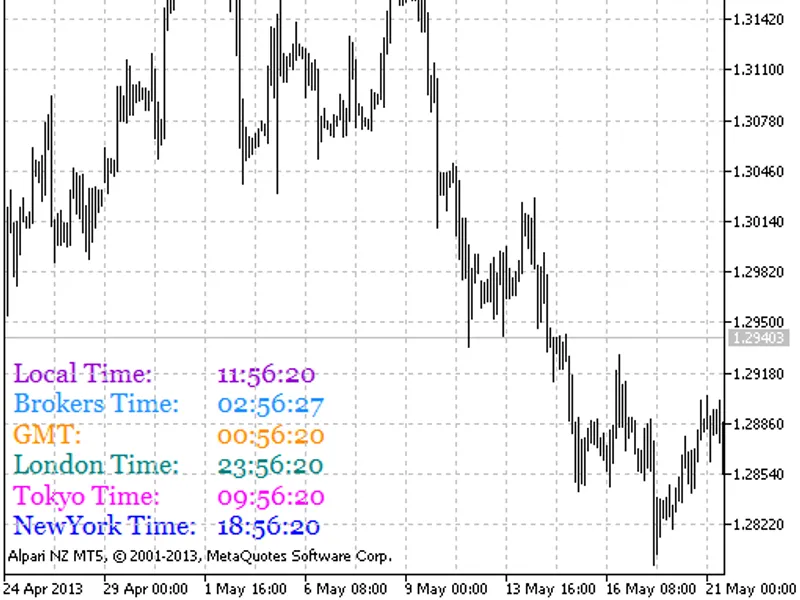
The Jerome Clock indicator displays the time in different time zones on a chart.The indicator uses a class of library that should be copied to the terminal_data_folder\mql5\include...
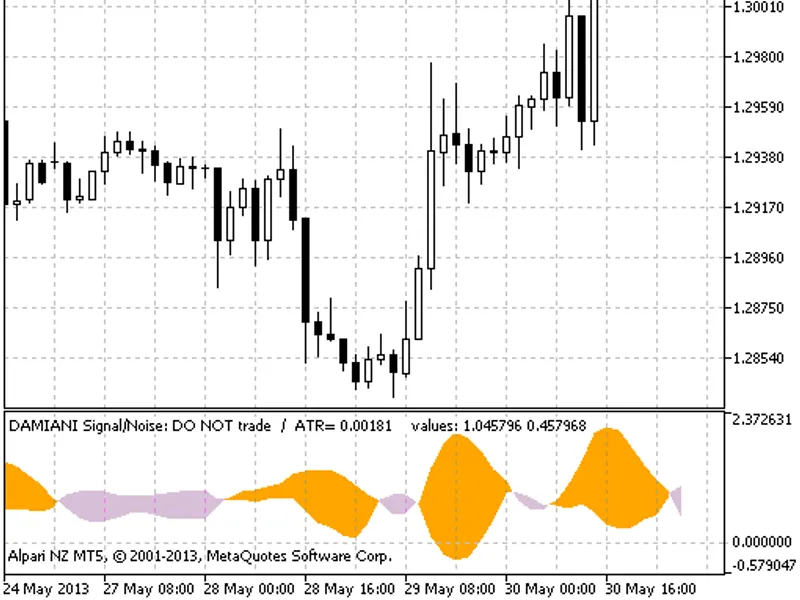
The Volatmeter is an indicator that displays volatility through a colored cloud.A gray cloud signifies a weak trend, while an orange cloud indicates a strong trend.This indicator w...
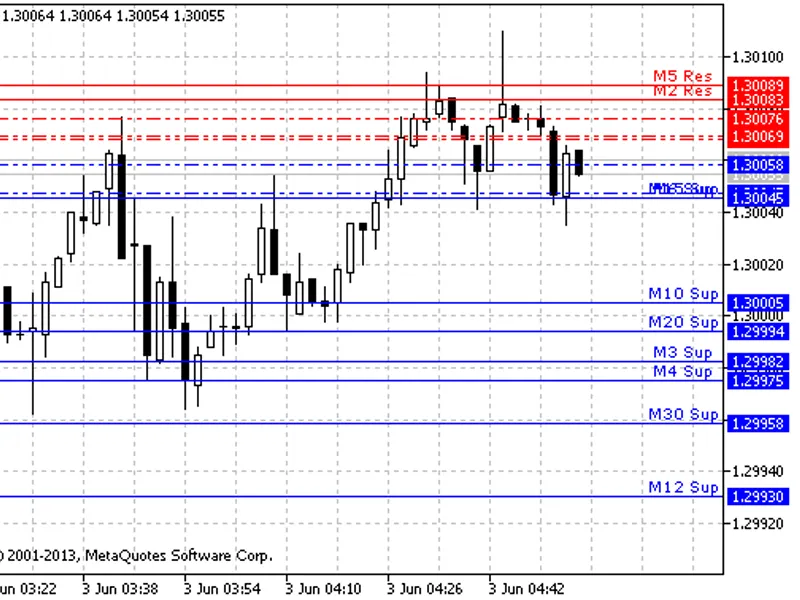
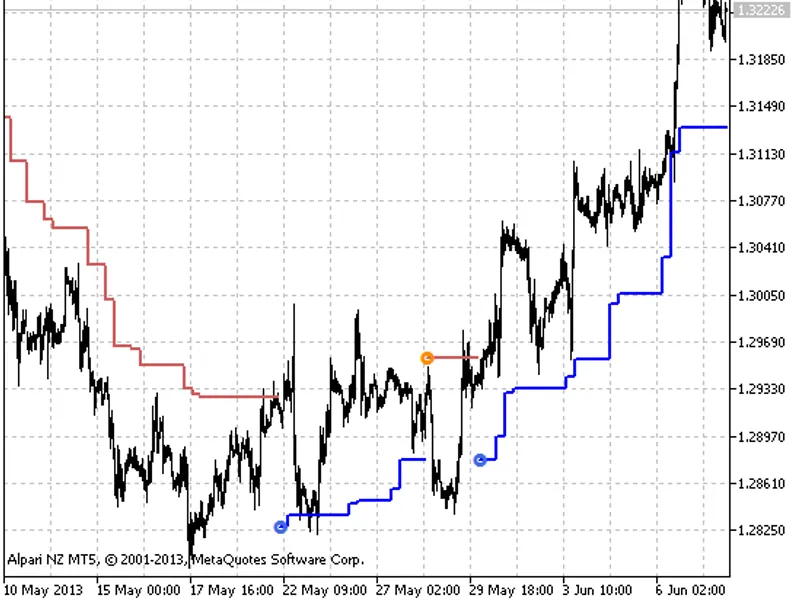
SR TLB (FF) - An interpretation of Steve Nison's 'Three Line Break' strategy.Levels are determined by closing prices. Blue lines denote support, red lines denote resistance, and do...
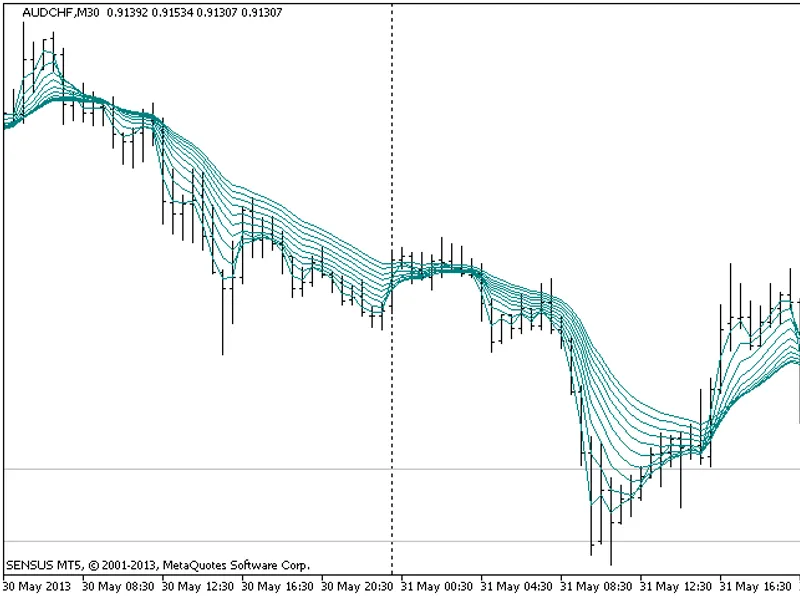
This is a fan of MA indicators, the period of which is defined by one of four types of progressions: - arithmetic - geometric - fibonacci numbers - leonardo numbers The indicator ...
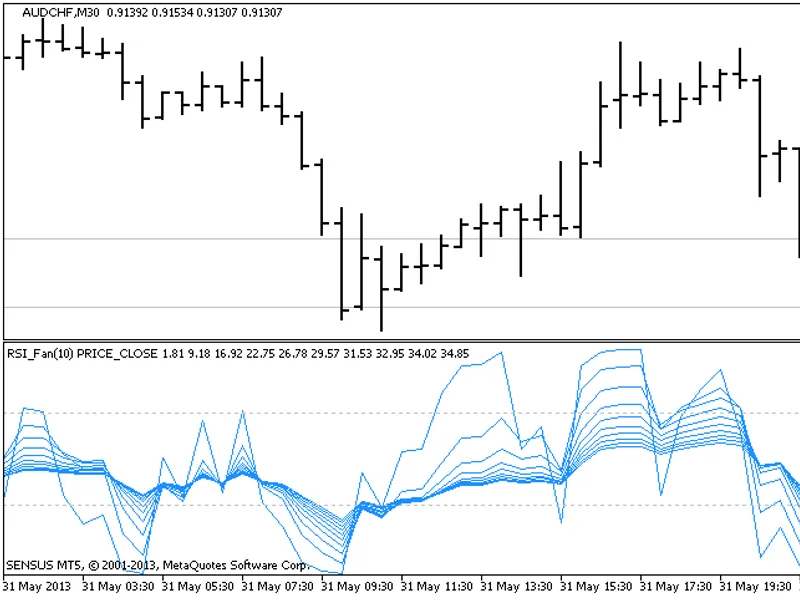
This is a fan of RSI indicators, the period of which is defined by one of four types of progressions: - arithmetic - geometric - fibonacci numbers - leonardo numbers ...
The trend indicator is drawn in the form of a colored cloud.This indicator was first implemented in MQL4 and published on 14.04.2026.Figure 1. The Ang Azad CSS indicatorIndicator O...
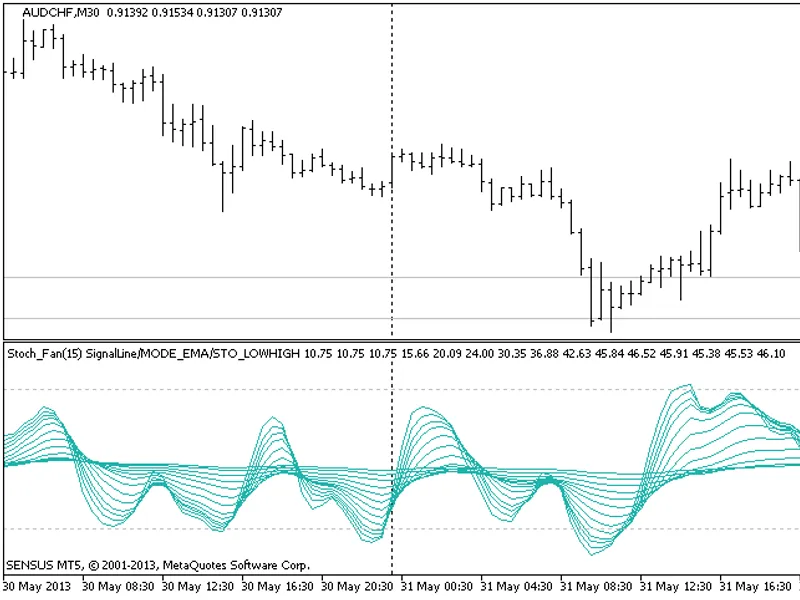
A fan of stochastic indicators, with periods defined by one of four types of progressions.Progressions include:- Arithmetic- Geometric- Fibonacci numbers- Leonardo numbers...
TRO Range Indicator
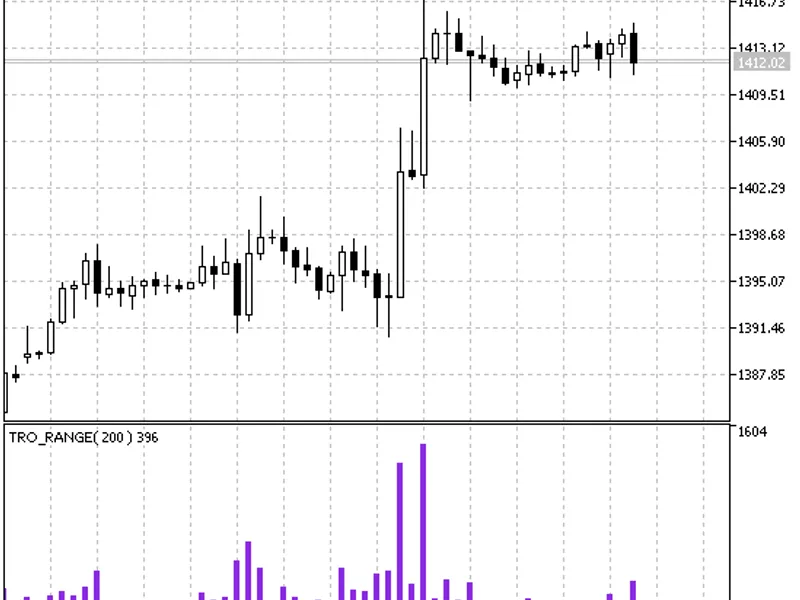
A simple volatility meter that displays candlestick sizes in a separate subwindow. If the size of a candlestick is greater than the threshold determined by the...
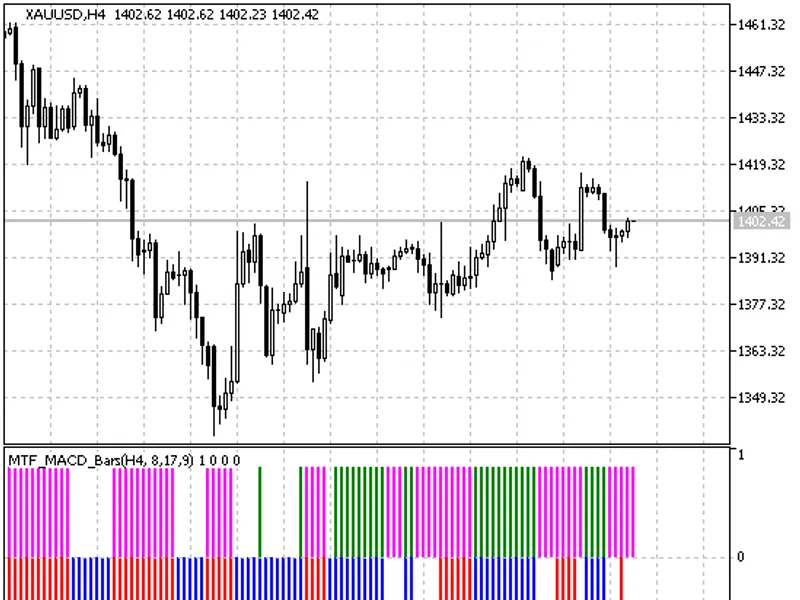
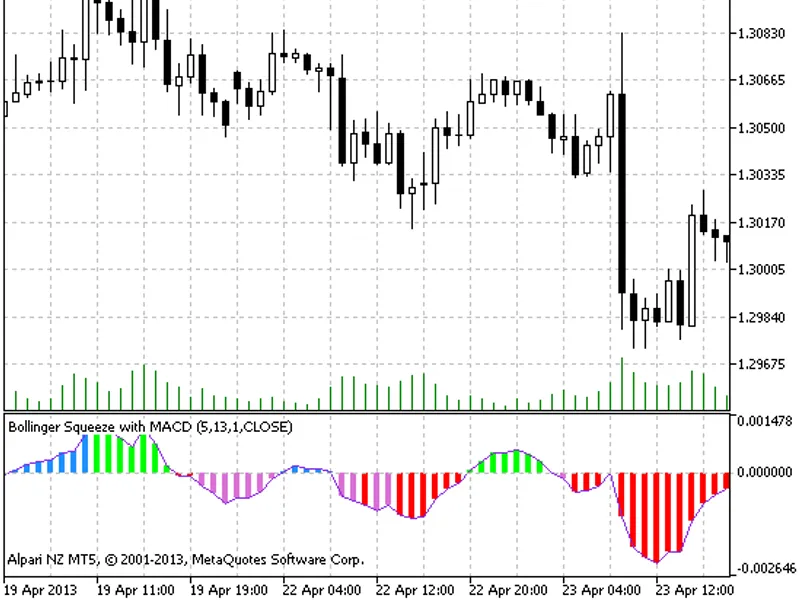
This is a semaphore signal indicator that displays the MACD histogram calculated on the specified timeframe.Indicator DescriptionThe indicator shows blue and pink bars correspondin...
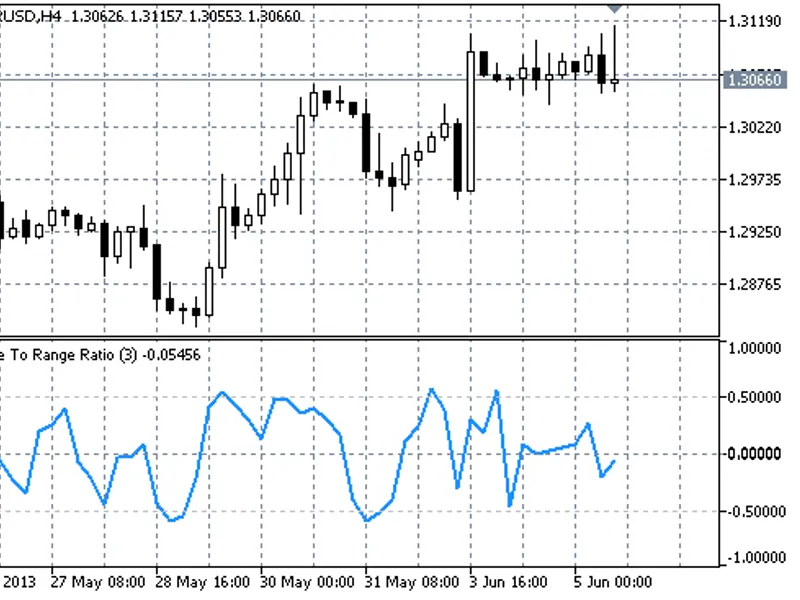
The Change to Range Ratio indicator measures the momentum of price changes relative to the total price range over a specified period. The core idea is that a sharper trend movement...
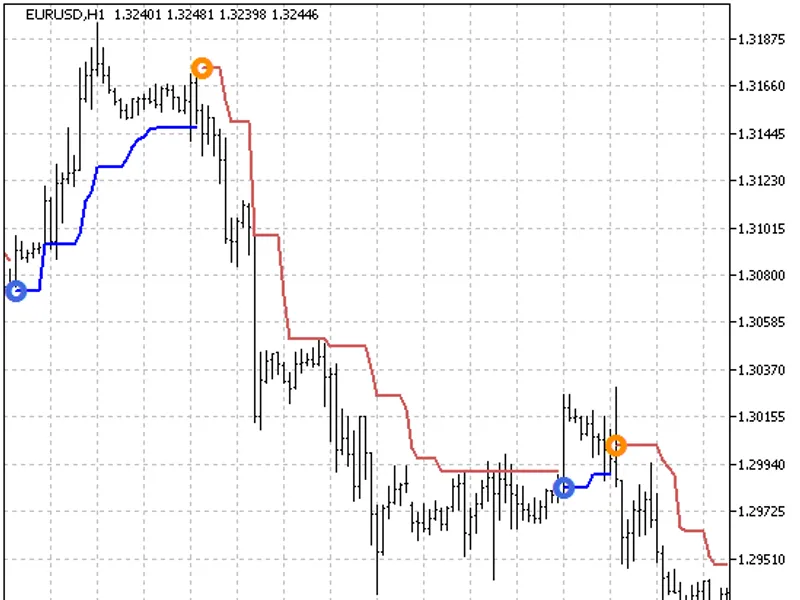
ATR Stops IndicatorA trend indicator implemented in the form of NRTR (Non-Lagging Trend). The Average True Range (ATR) is used for constructing a moving average.This indicator was ...
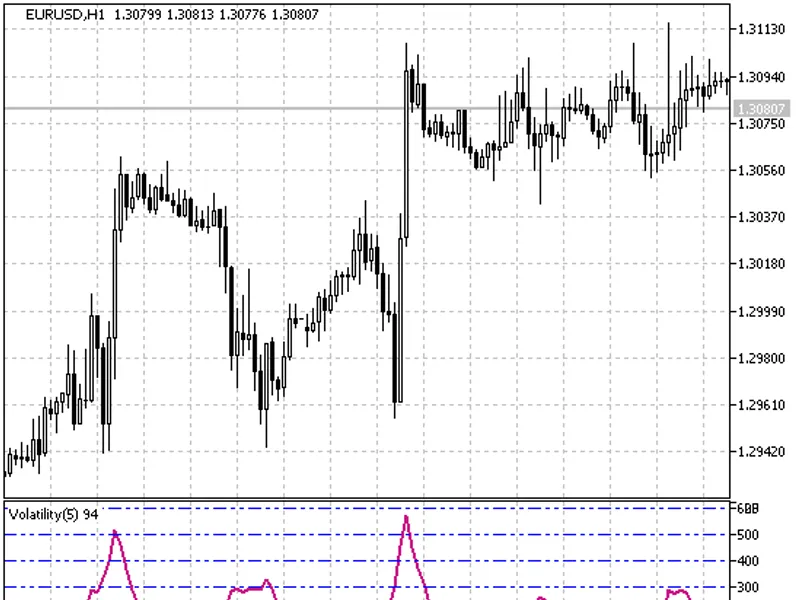
A straightforward indicator designed to measure the volatility of a financial asset. Volatility is calculated in points, derived from the highest and lowest prices over a specified...
A trend indicator implemented in the form of NRTR (Trailing Stop). The timeframe of the indicator is set in the input parameters.Used for constructing a moving average.Place the co...
This indicator detects and visualizes a fundamental price action pattern: the Pin Bar.On higher timeframes (daily to monthly), a Pin Bar serves as a strong signal to enter the mark...
A simple and effective indicator, suitable for MQL5 beginners.This indicator was initially developed for MQL4 and released on April 4, 2008.Figure 1. The Gann_Hi_Lo_Activator_SSL i...
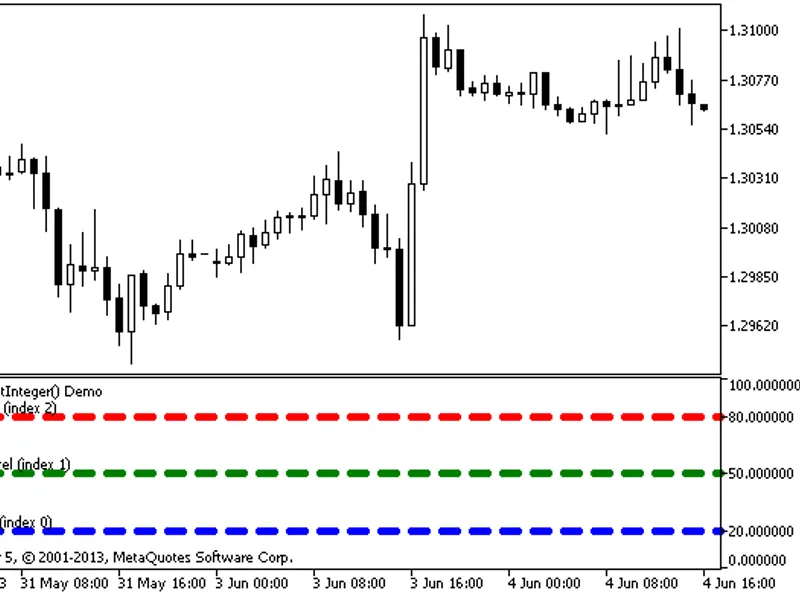
An example demonstrating how to create an indicator that displays labels for each horizontal level, such as "overbought level".This indicator is designed to be drawn in a separate ...
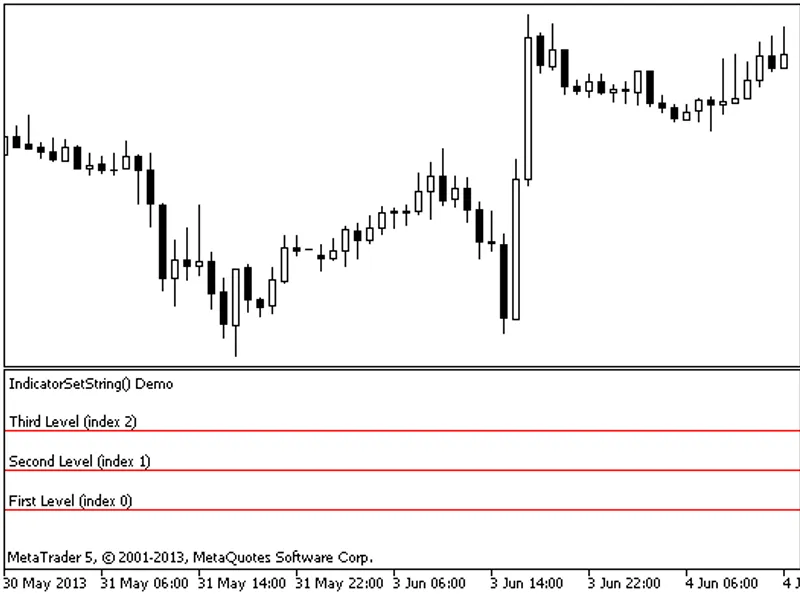
A straightforward indicator demonstrating how to create labels for each horizontal level, such as 'Overbought Level'.This indicator, designed to be displayed in a separate window, ...
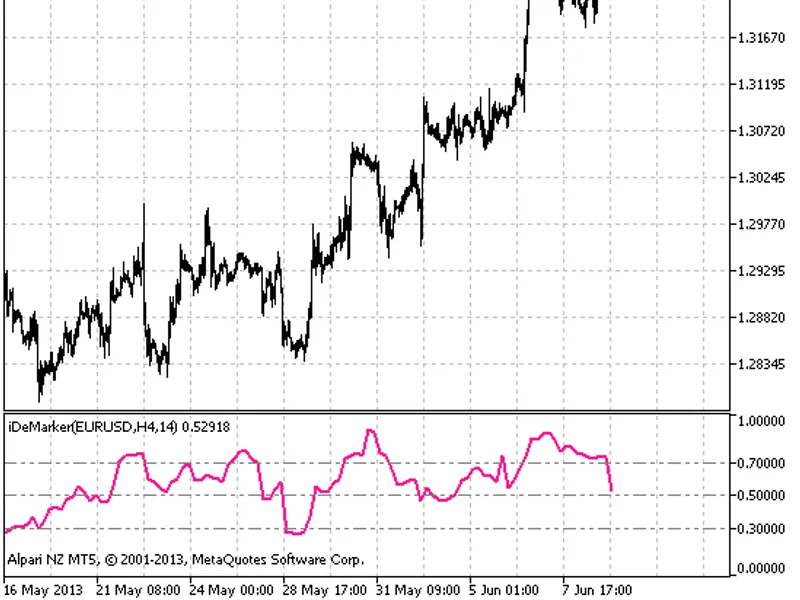
DeMarker HTF IndicatorThis indicator provides an option for setting a fixed timeframe for its calculation within the input parameters.This indicator was originally implemented in M...
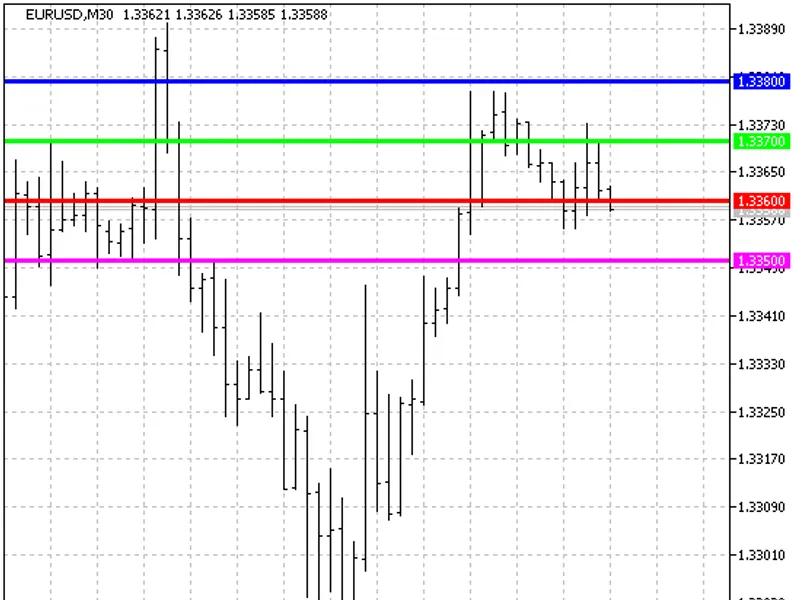
Many traders consider round price levels, which are levels where the price ends with two zeros (e.g., 1.5800, 1.5900), as significant support or resistance areas. The Round Levels ...
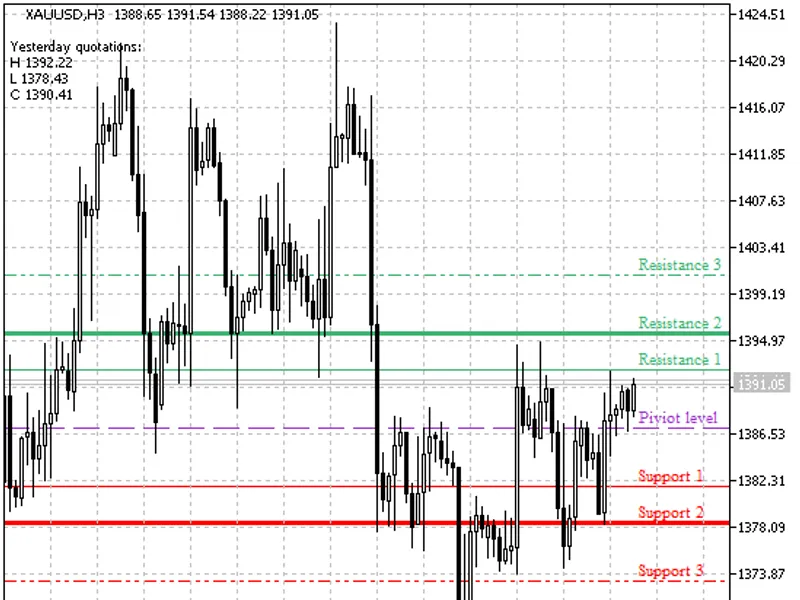
Fibo Pivot IndicatorA pivot point indicator incorporating Fibonacci levels, calculated using daily candlesticks.This indicator was originally developed for MQL4 and released on Mar...
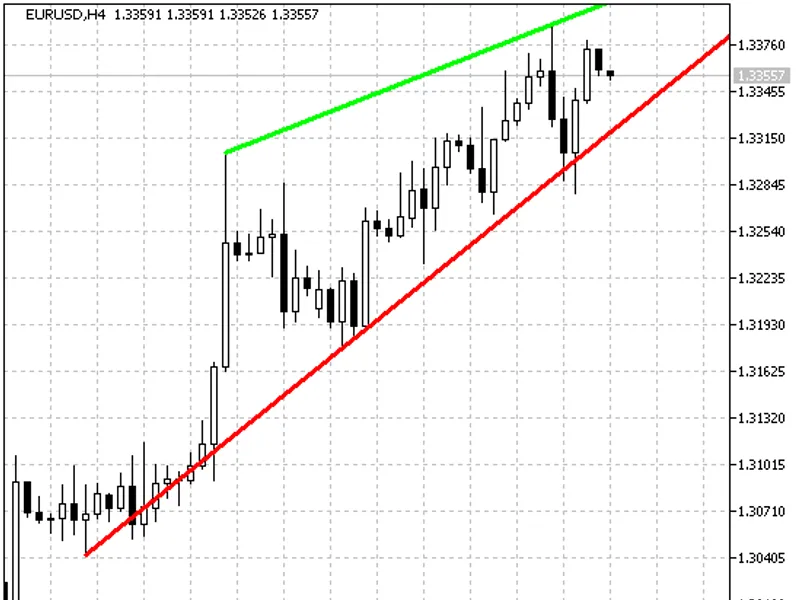
nsi2000The indicator draws two trend lines based on the closest price extremes.This indicator was first implemented in MQL4 and published on 28.03.2026.Figure 1. The TrendChannel I...
A trend indicator with four states.
This indicator provides an option for selecting a source indicator for detecting trend using the triggertype input parameter. Available options ...
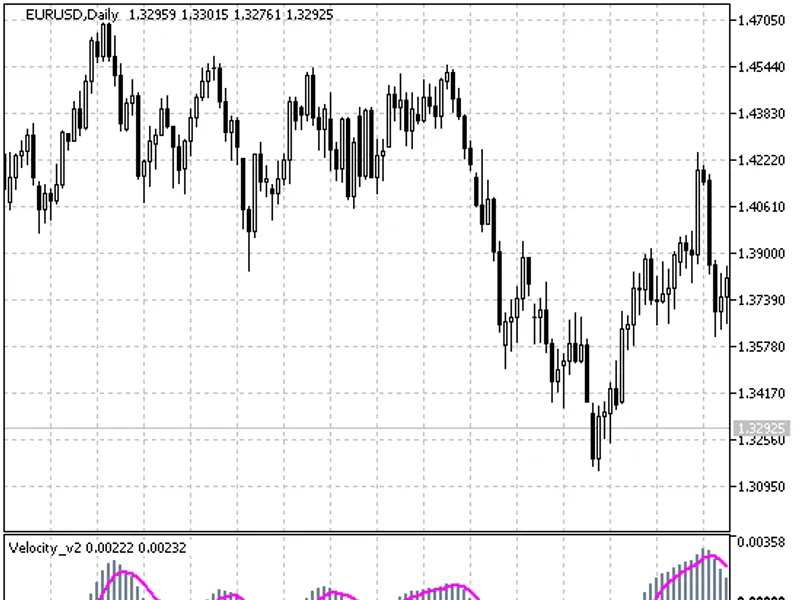
Velocity is a momentum oscillator that features triple averaging and a signal line.The triple averaging is employed to filter the indicator's direction.This indicator was originall...
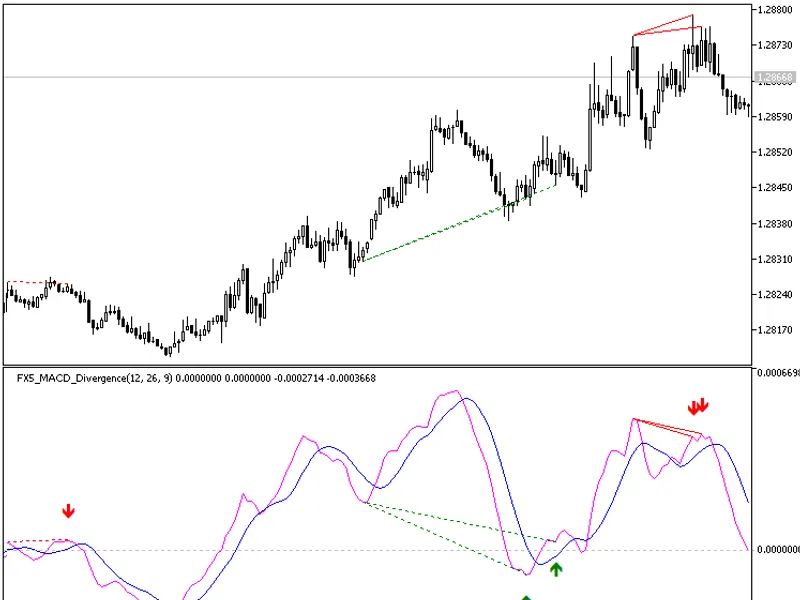
This indicator plots divergence lines on the MACD indicator and provides buy and sell signals with green and red arrows.It includes a built-in alert function.Bullish divergences ar...
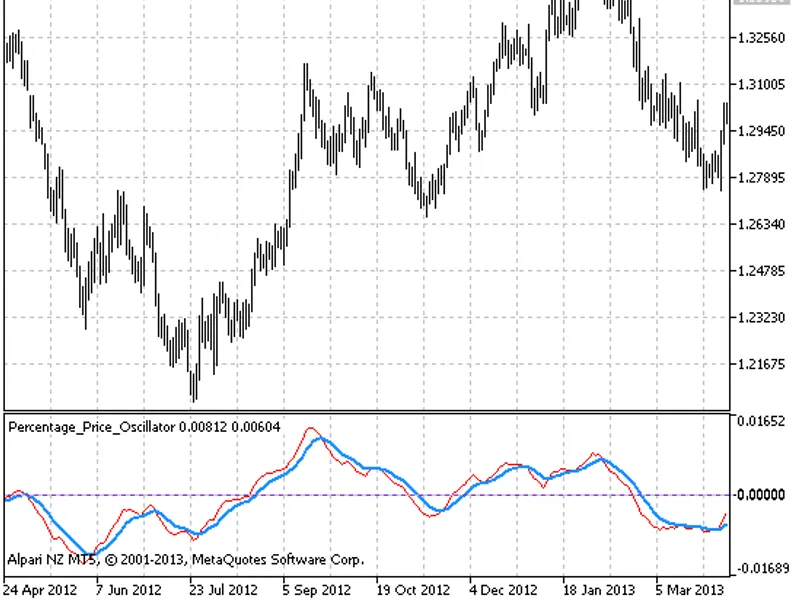
A non-normalized oscillator. The indicator is calculated using the following formula:It shows more accurate signals of divergence between the price and the value of the oscillator;...