Download ALL MT5 indicators (5742)

Similar MetaTrader Tools


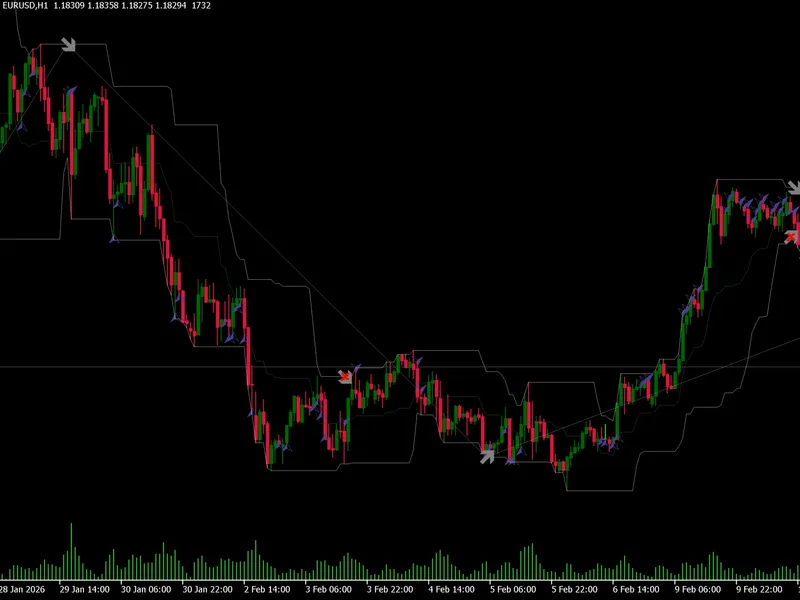






Inverse Reaction Indicator
Info
The Inverse Reaction Indicator is a Indicator for MetaTrader 5 that the inverse reaction indicator is based on the concept that an unusual impact on price changes will trigger an inverse reaction. This phenomenon can be observed in various scenarios, such as the Lehman Brothers case, the flash crash, and even in daily minor shocks (not limited to booms or crashes).
Usage
This tool is typically used for enhancing chart analysis and decision making.
Platform
This Indicator works exclusively on MetaTrader 5 (both build 600+ and newer versions).
Setup
Place the downloaded file in MQL5/Indicators folder via File ? Open Data Folder in MetaTrader 5.
How to Install and Use Inverse Reaction Indicator
1. Installation: Place your file in the MQL/Indicators folder via "Open Data Folder" and restart your terminal.
2. Loading: Find the indicator in the Navigator, drag it onto your chart, and configure the input parameters in the popup window.
3. Customization: Press Ctrl+I to open the indicator list, select your tool, and click "Properties" to change colors, levels, or visual styles.
4. Updating: Replace the old file in the Indicators folder with the new version and restart the platform to apply changes.
Frequently Asked Questions
Q: Why is my indicator not showing? A: Verify the file is in the MQL/Indicators folder, or try right-clicking the "Indicators" tree in the Navigator and clicking "Refresh."
Q: Do custom indicators slow down the platform? A: Too many complex indicators can impact performance; remove unused ones via the "Indicator List" (Ctrl+I).
Q: Can I use MT4 indicators on MT5? A: No, MQL4 and MQL5 are distinct languages; ensure the indicator is compiled specifically for your platform version.
What this tool does
The Inverse Reaction Indicator is based on the concept that an unusual impact on price changes will trigger an inverse reaction.
Typical Use Case
This Indicator excels in automated trading and technical analysis on MetaTrader 5.
Compatible Platform & Setup
This Indicator works on MetaTrader 5. Place the file in the MQL5/Indicators folder and restart the terminal.
Description & Settings
Related: Inverse Reaction Indicator - another powerful indicator for MetaTrader 5 traders.
The Inverse Reaction Indicator is based on the concept that an unusual impact on price changes will trigger an inverse reaction. This phenomenon can be observed in various scenarios, such as the Lehman Brothers case, the flash crash, and even in daily minor shocks (not limited to booms or crashes).Also recommended: inverse reaction - similar indicator with strong performance on MetaTrader 5.
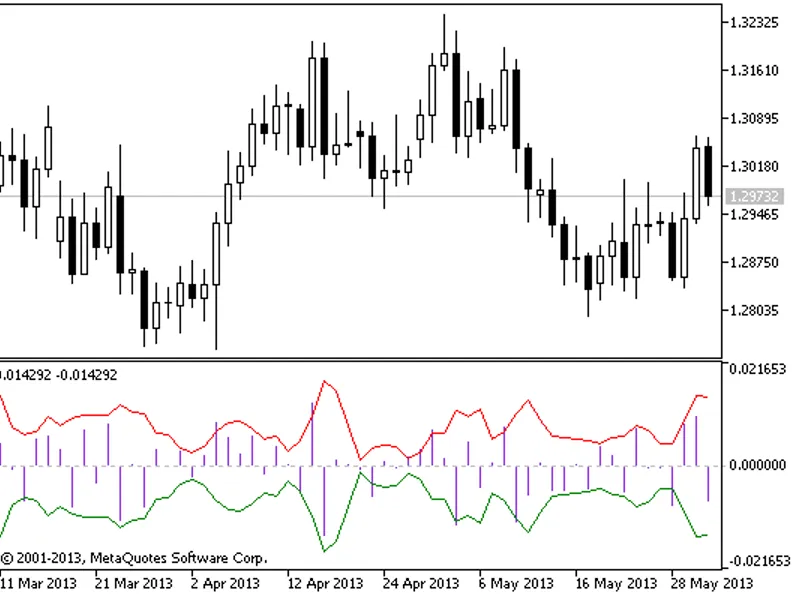
This indicator consists of two primary arrays. One array displays gap-free price changes, while the other array(s) represent the potential volatility limit(s) (confidence levels) for each bar. A signal is generated when the price change surpasses the volatility limits, indicating an expected inverse reaction. Refer to the image below (EURUSD, 1D).
Input Parameters:
Coefficient
The coefficient for confidence levels, which is set to the golden ratio by default. Under ideal conditions of normality, the golden ratio provides approximately 80% confidence levels (refer to the source code for details). Minor adjustments can be made by using values between 1 and 3. However, it's important to note that higher values increase probabilities but reduce signal frequency, while lower values may result in more false signals.
Period
The period value for the moving average, set to 3 by default. Optional adjustments can be made, but it's worth considering that higher values may lead to more false signals due to the short memory in economic behaviors.
For a deeper understanding of the calculation process, refer to the notes about "dynamic confidence levels" in the source code.
Tips:
This strategy can be effective on its own (refer to the expert for more information). However, for stronger signals, it is recommended to combine it with complementary strategies like trend and momentum indicators. The Parabolic SAR and Stochastic Oscillator are excellent choices (see the picture below).
The daily EURUSD is a preferred option, but you can adapt it to other periods (and symbols) by adjusting the parameters. Refer to the picture below for an example.
When signals occur successively, the second signal may be false due to an increase in real volatility levels.
Some false signals are characterized by low volatility levels.
Remember: Breaking news can influence signal quality, so stay informed and make decisions accordingly.
An example illustrating the first three tips:
In the picture, the indicator is applied to the GBPUSD, M30 chart with the following parameters: Confidence Coefficient = 2.0, MA Period = 5. The dots represent single-tail confidence levels, and the yellow dots indicate level breaks (our signals). The relationship with the Stochastic Oscillator is evident: when the Stochastic Oscillator reaches its limits, subsequent volatility breaks in price changes are likely to be excessive and followed by inverse reactions.
You may also like: inverse reaction htf - excellent alternative for indicator users on MetaTrader 5.
Source Code
#property copyright "robotfx"
#property version   "1.3"
#property link "https://robotfx.org"
#property description "this code is educational. feel free to use, modify and upgrade as you wish. visit robotfx.org for professional trading tools"
#property description "this code is educational. feel free to use, modify and upgrade as you wish. visit robotfx.org for professional trading tools"
#property description "this code is educational. feel free to use, modify and upgrade as you wish. visit robotfx.org for professional trading tools"
#property description "this code is educational. feel free to use, modify and upgrade as you wish. visit robotfx.org for professional trading tools"
#property indicator_separate_window
#property indicator_buffers 7
#property indicator_plots   2
.......
⚠ Limitations & Risk Warning
- This tool is provided for educational and testing purposes only.
- Past performance does not guarantee future results.
- Trading involves substantial risk of loss. Use on a demo account first.
- Results may vary depending on market conditions, broker, and settings.
- We recommend thorough backtesting and forward testing before using with real funds.