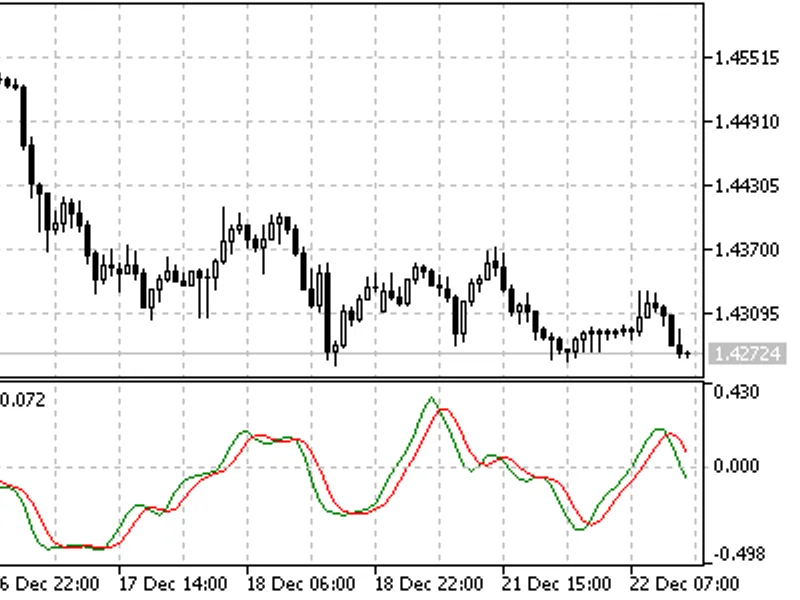
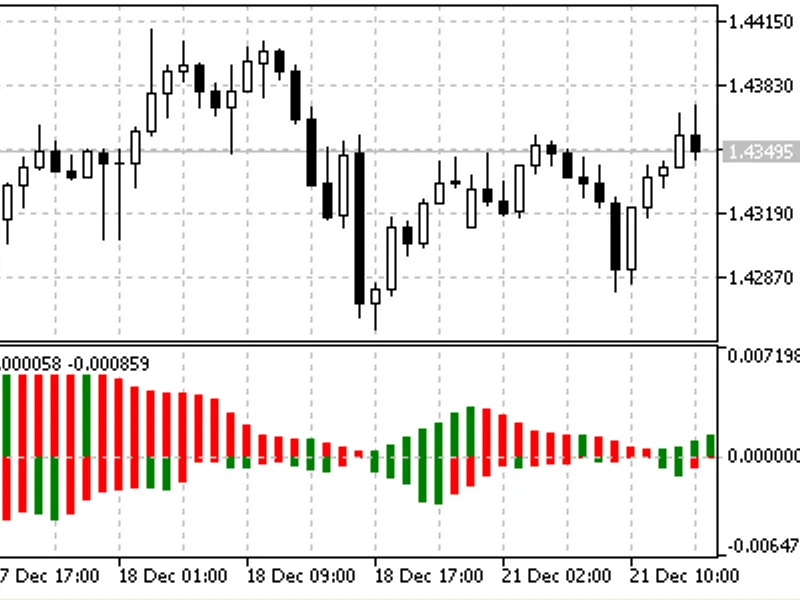
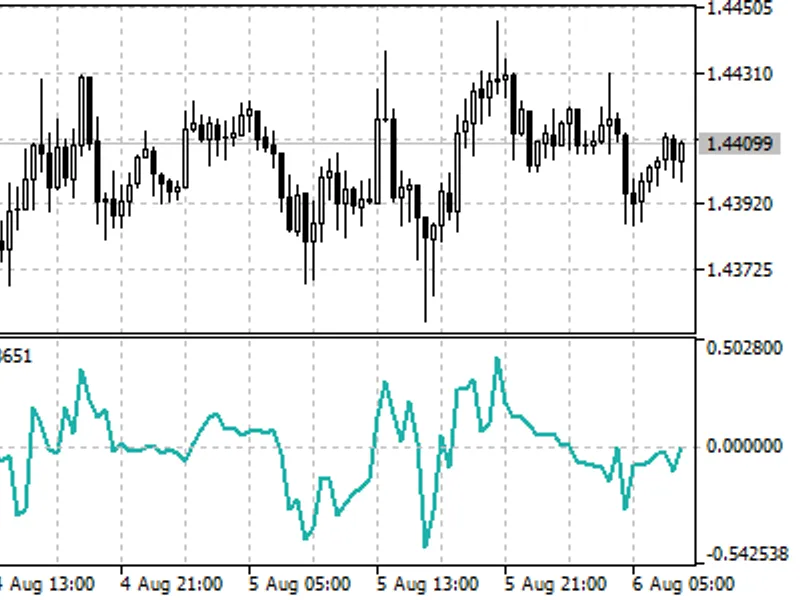
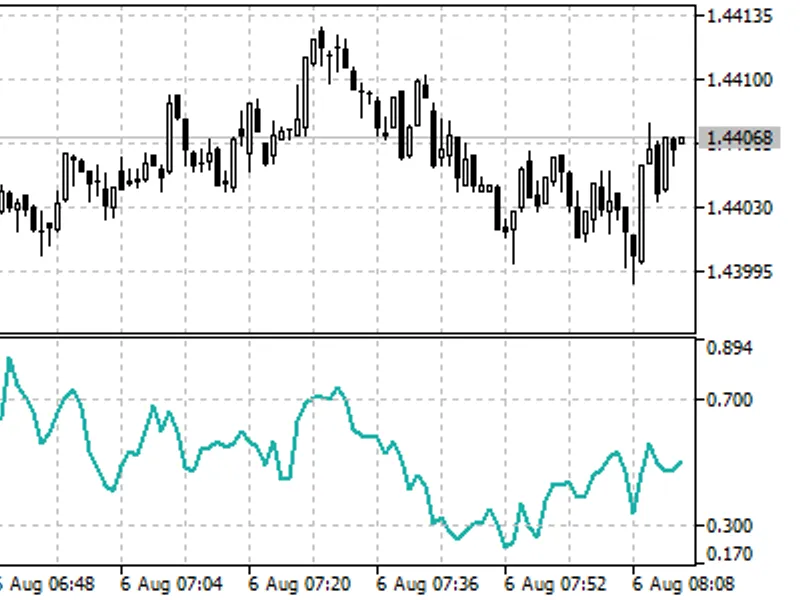
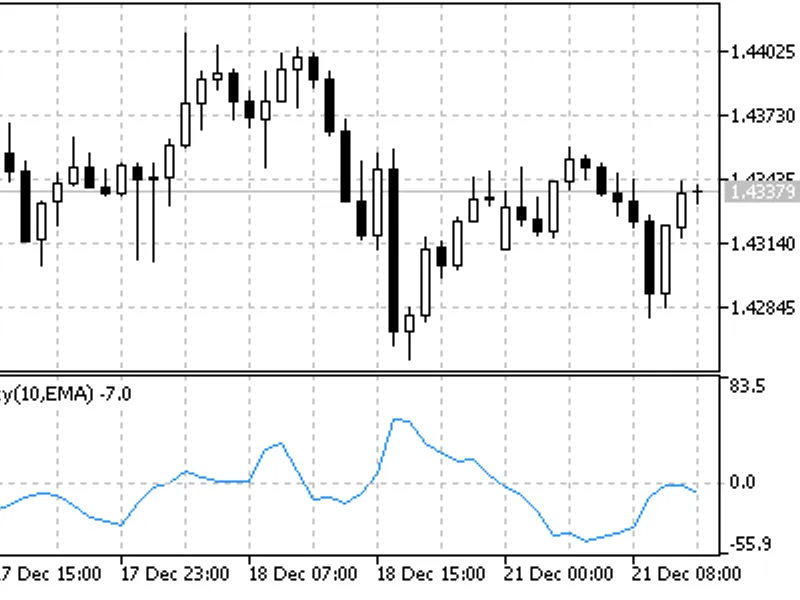
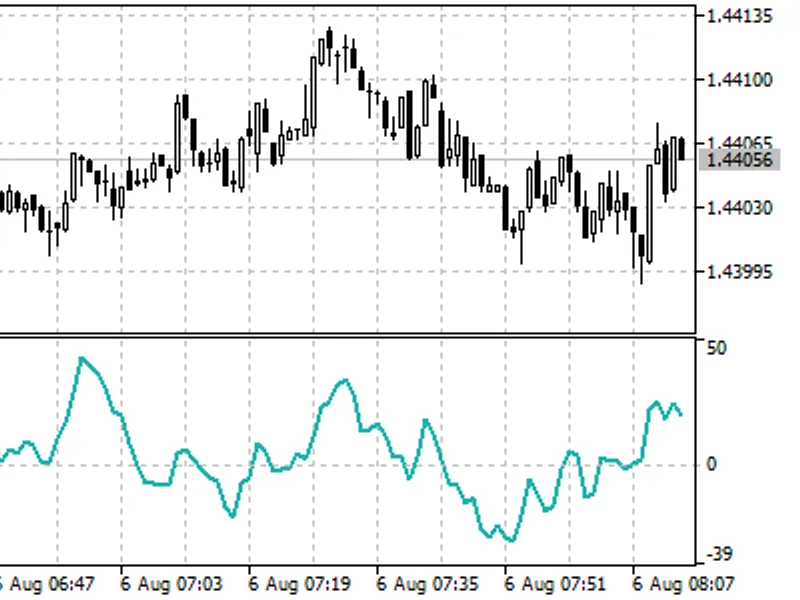
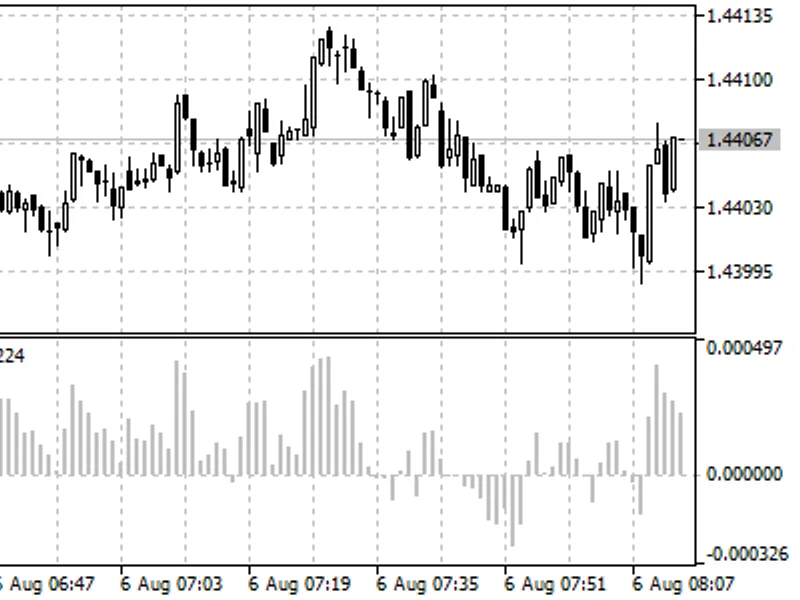
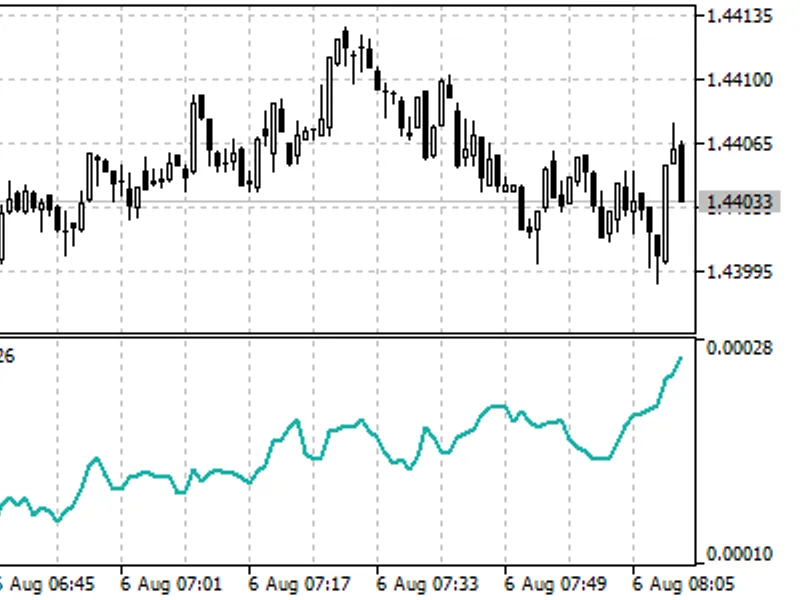
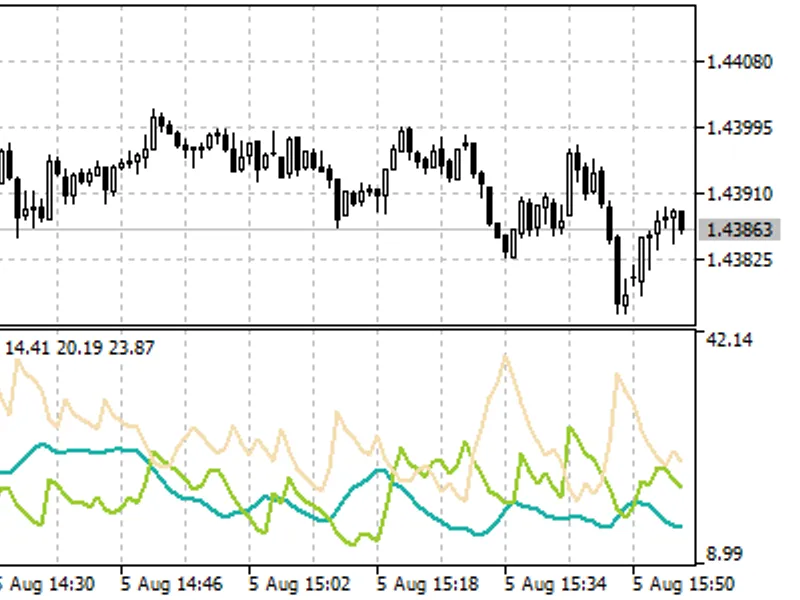
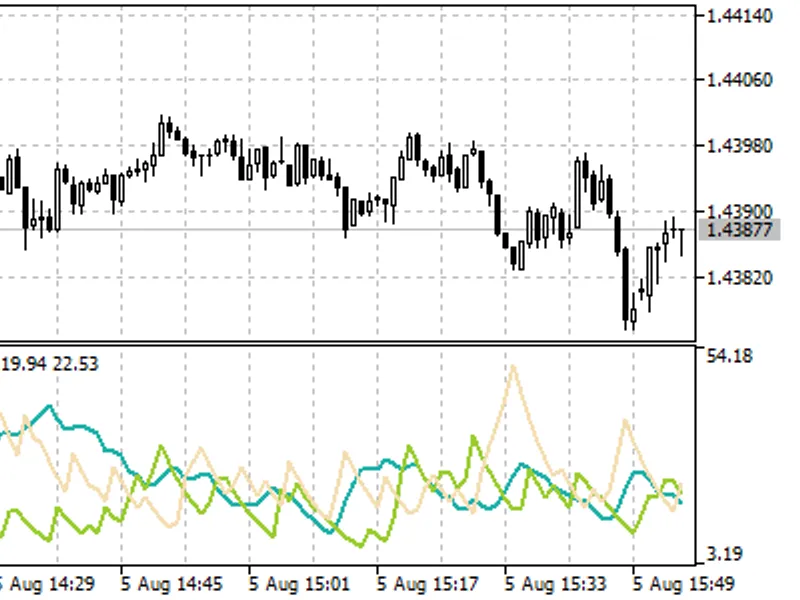
the relative vigor index (rvi) is a technical indicator that assesses market vigor or energy by comparing closing and opening prices. in a bull market, the closing price typically ...
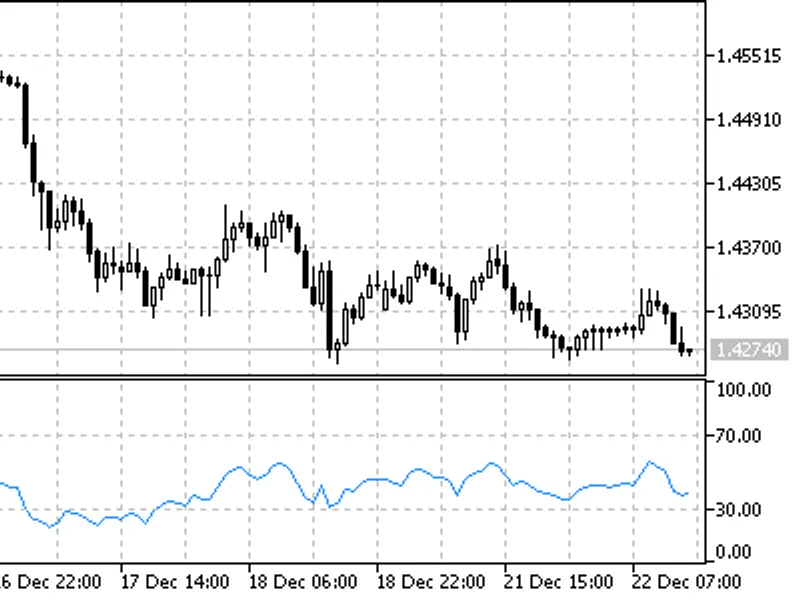
the relative strength index (rsi) is a widely used technical indicator that measures the speed and change of price movements. it is a price-following oscillator that fluctuates bet...
prices fluctuate in a wave-like manner, known as ondulatory movement, due to changing investor expectations and the ongoing battle between bulls and bears for price control.the pri...
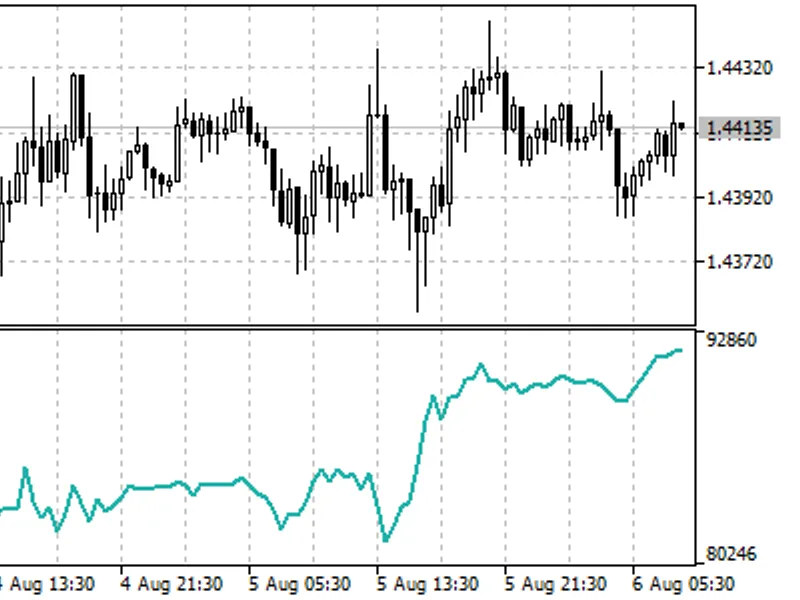
the price and volume trend (pvt) indicator is a technical analysis tool that measures the cumulative sum of trade volumes, considering the relationship between price changes and tr...
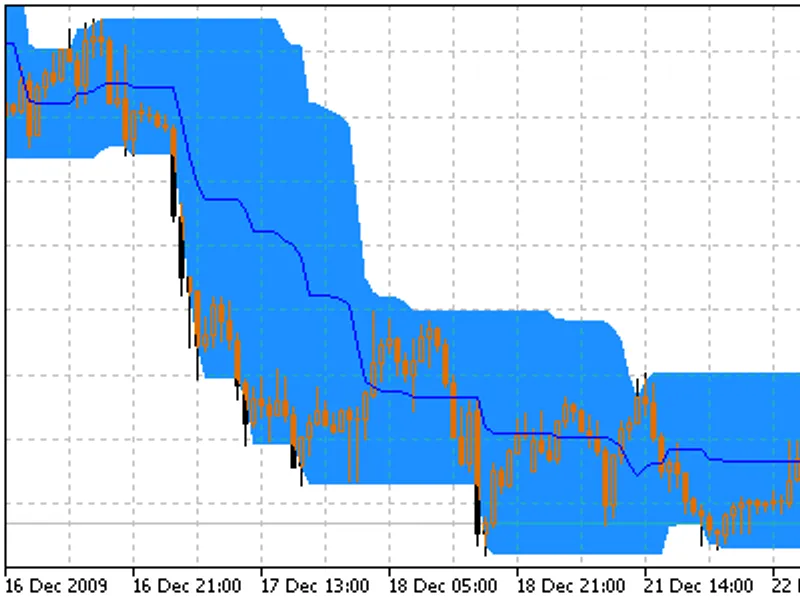
the market often experiences fluctuations in its movement, making it challenging to identify clear support and resistance levels through straight lines.the price channel indicator ...
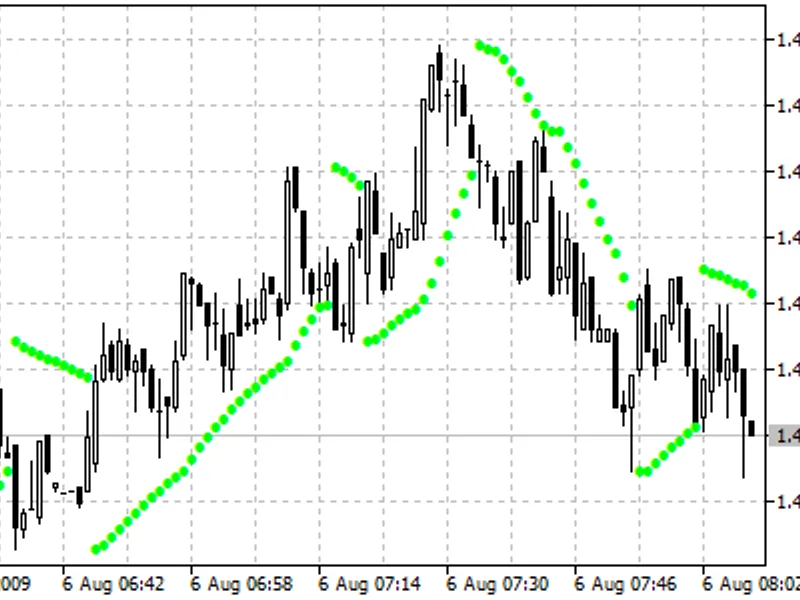
the parabolic sar (stop and reverse) technical indicator is a powerful tool for analyzing trending markets. it is constructed on the price chart, resembling a moving average with a...
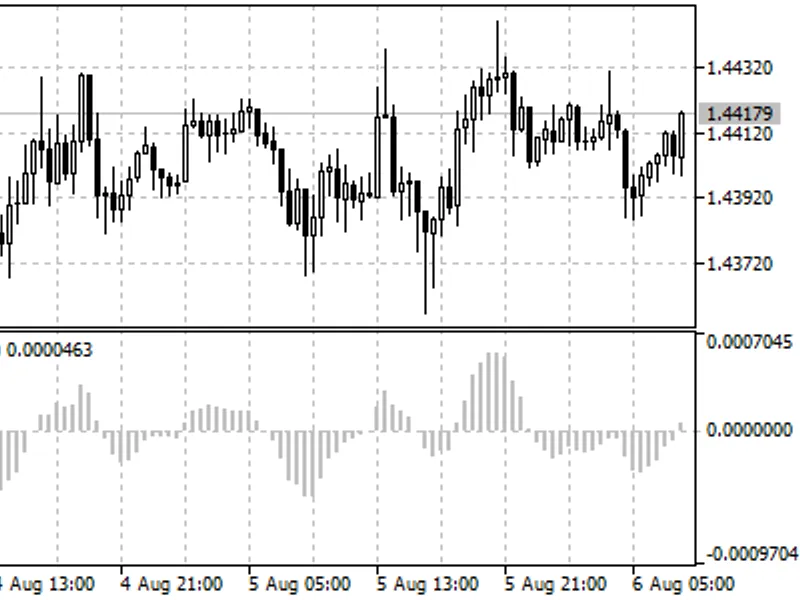
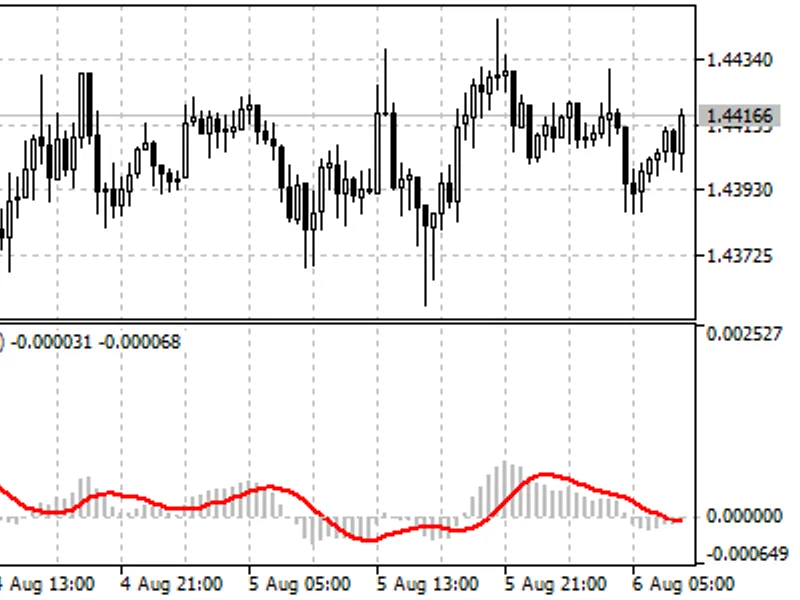
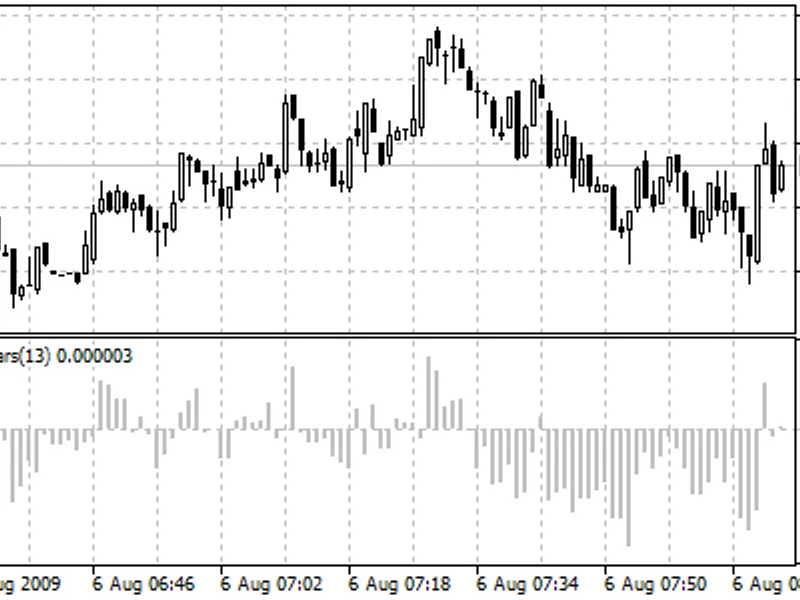
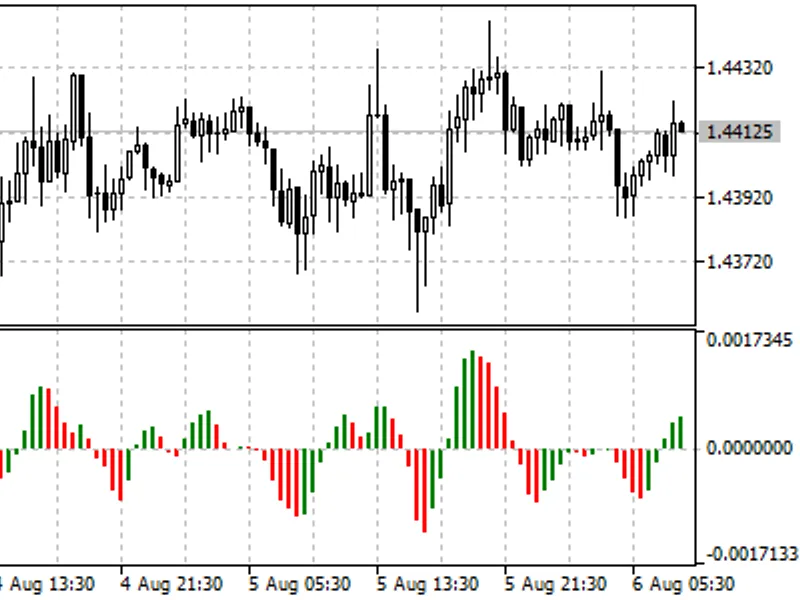
the moving average of oscillator (osma) is a technical indicator that measures the difference between an oscillator and its smoothed version.in this context, the oscillator refers ...
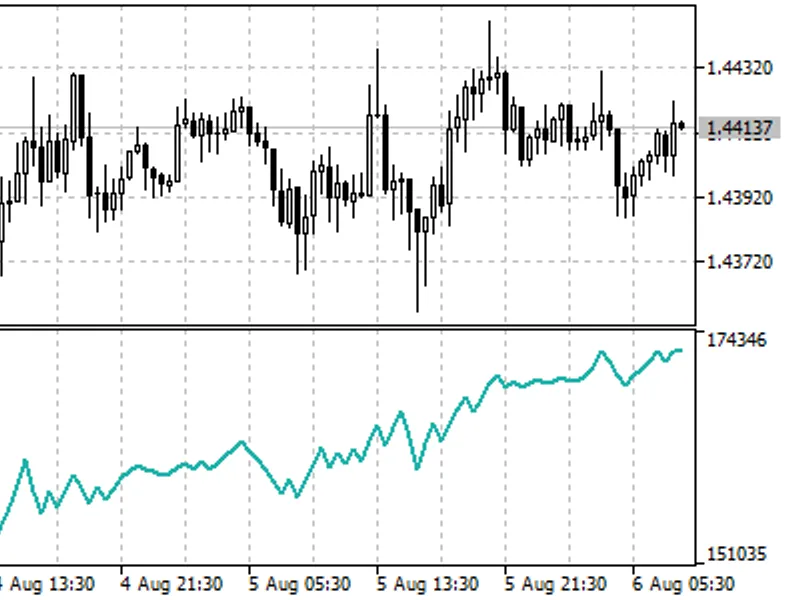
on balance volume (obv) is a momentum technical indicator that relates volume to price change.the indicator's calculation is straightforward. if the current bar's closing price is ...
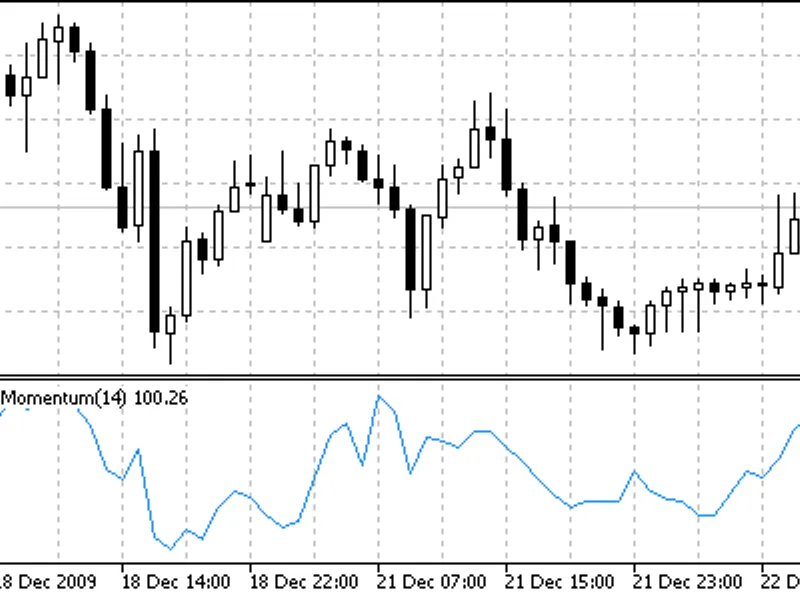
the momentum indicator is a versatile tool for technical analysis, offering insights into price changes over specific time periods.this indicator can be utilized in two primary way...
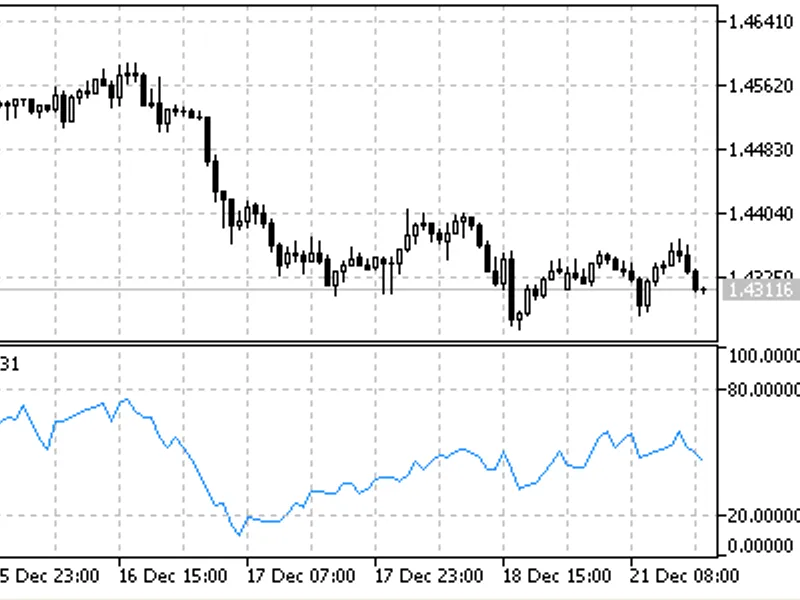
the money flow index (mfi) is a technical indicator that measures the rate of investment and withdrawal of funds in a security. it is constructed similarly to the relative strength...
the mass index is a powerful tool designed to identify trend reversal points. it was originally developed to analyze daily price movements and determine the significance of price f...
the market facilitation index technical indicator (bw mfi) measures the price change per tick.the absolute values of the indicator are not significant; only the changes in the indi...
moving average convergence/divergence (macd) is a popular trend-following indicator that measures the relationship between two moving averages of a security's price.the macd is cal...
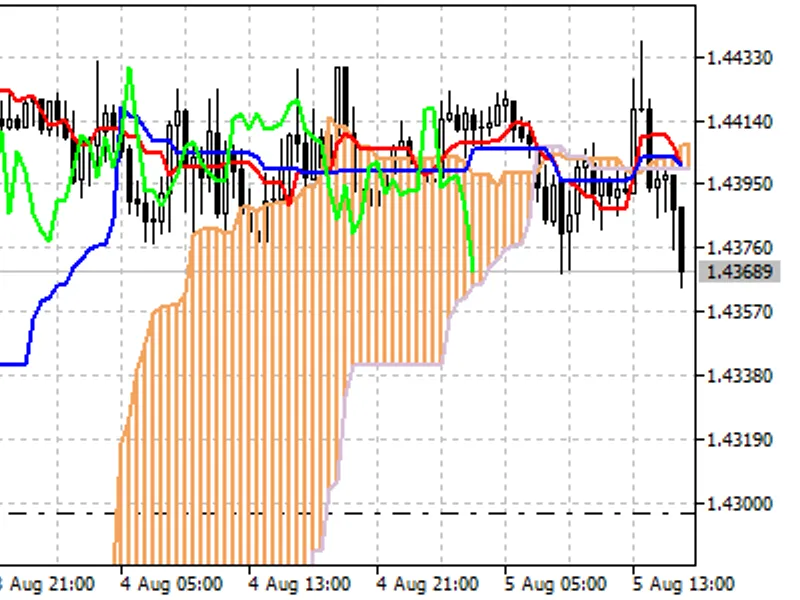
the ichimoku kinko hyo technical indicator is a comprehensive tool for market analysis, offering insights into trend identification, support and resistance levels, and generating b...
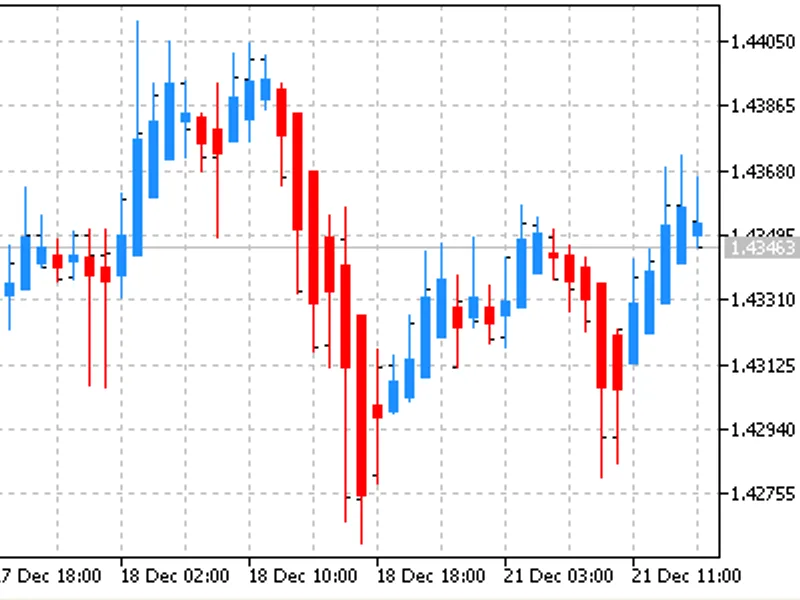
the heiken-ashi indicator is a unique tool that resembles a candlestick chart but with a distinct difference. unlike traditional candlestick charts, it employs specific formulas to...
the gator oscillator is a technical analysis tool derived from the alligator indicator, providing insights into the convergence and divergence of smoothed moving averages (smma).it...
fractals are a valuable tool in the world of trading, particularly for identifying market trends and potential turning points. this indicator is part of bill williams' renowned tra...
the force index technical indicator is a powerful tool for traders, providing insights into market trends and potential opportunities.this indicator measures the bulls power during...
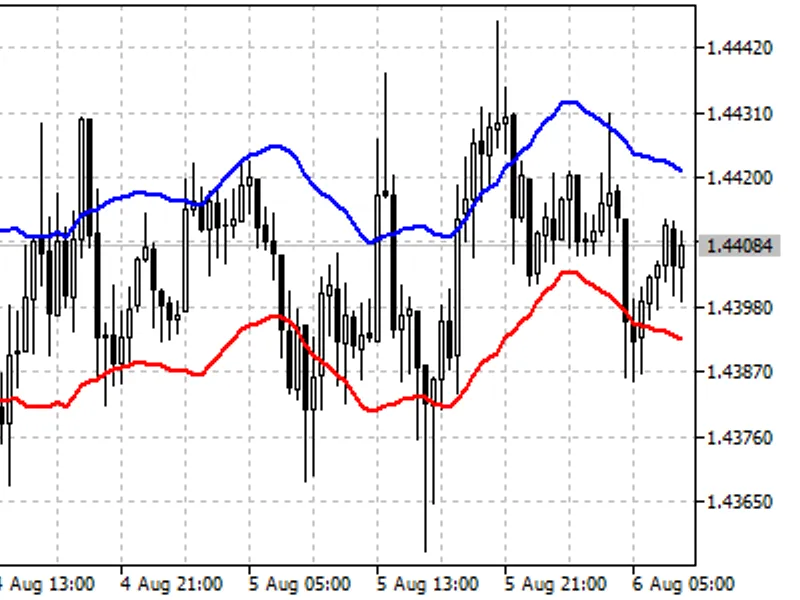
the envelopes technical indicator is a powerful tool for traders, consisting of two moving averages, strategically shifted upward and downward.the indicator's design accounts for m...
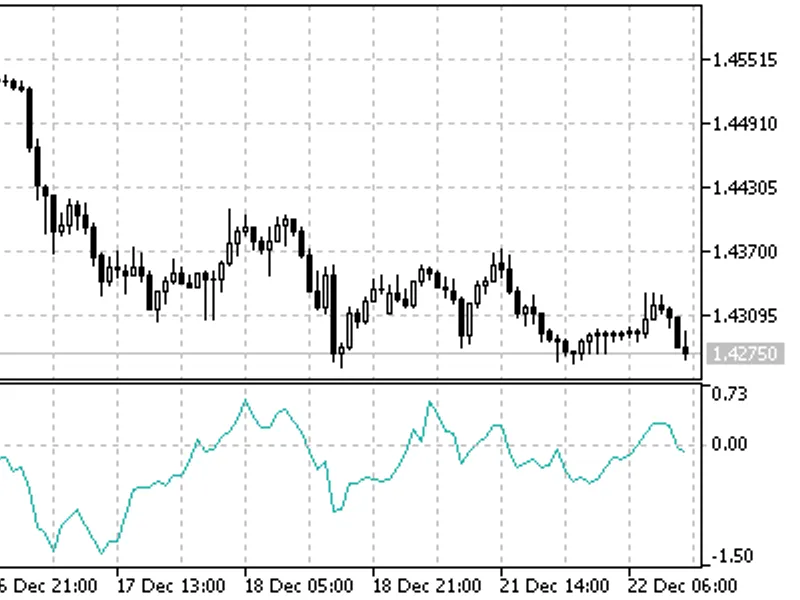
the detrended price oscillator (dpo) is a technical indicator that eliminates the trend effect of price movement, making it easier to identify cycles and overbought/oversold levels...
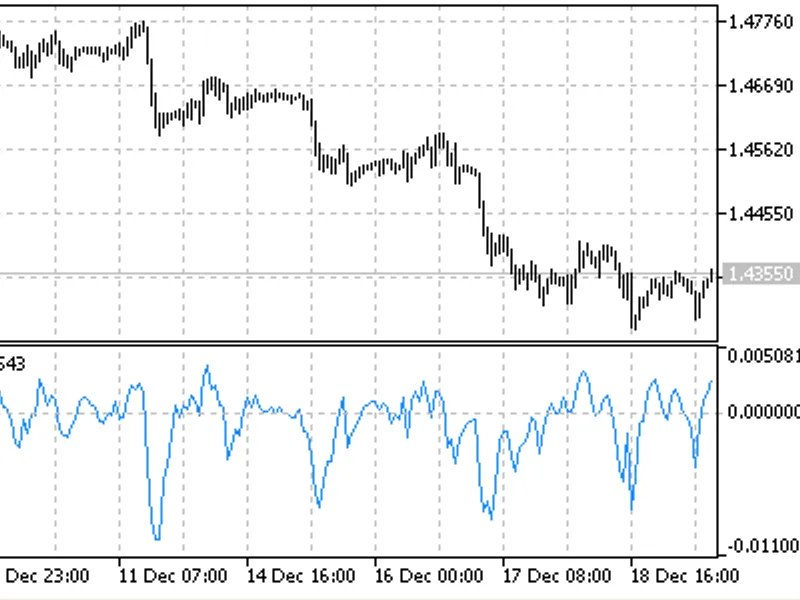
the demarker technical indicator (dem) is a tool for analyzing price trends and predicting potential reversals. it is calculated based on the comparison of period maxima and minima...
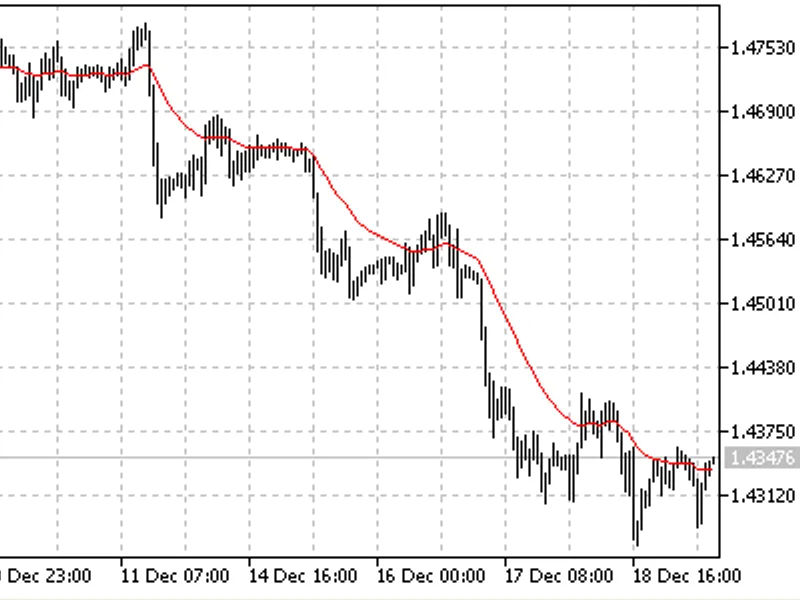
the custom moving average is a powerful tool that exemplifies the capabilities of the custom user indicator. it is designed to calculate and display the moving average, a widely us...
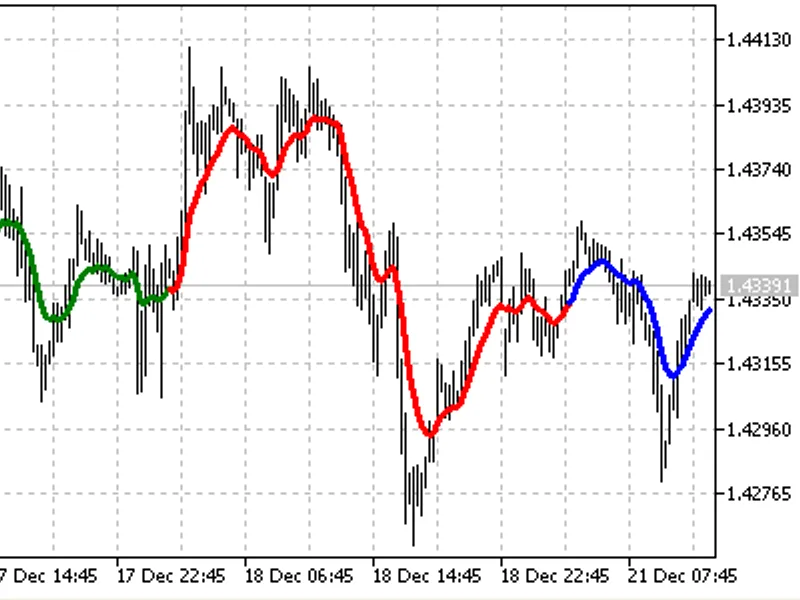
the colorline indicator displays the price moving average as a colorful line on the chart.this line is divided into segments, with each segment representing 100 bars of data. the c...
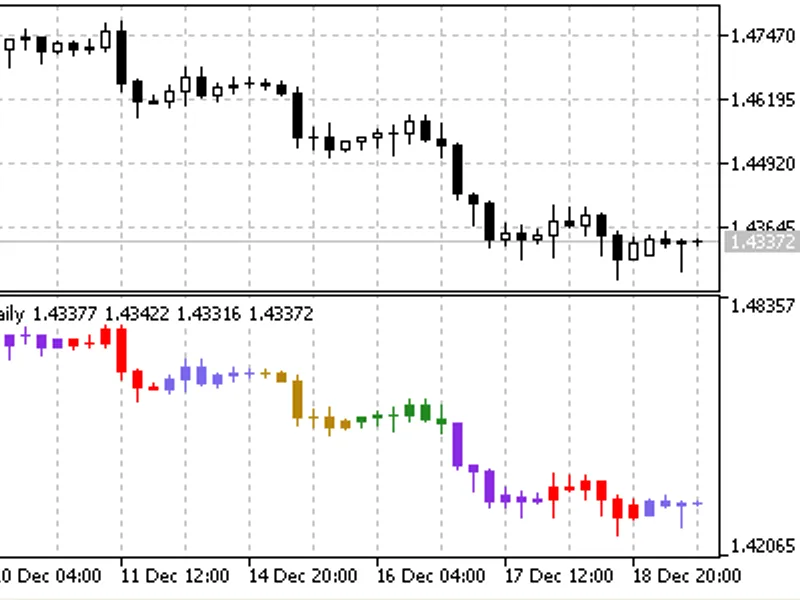
the colorcandlesdaily indicator is a tool that visually enhances your trading experience by coloring each candle based on the day of the week.it provides a quick and intuitive way ...
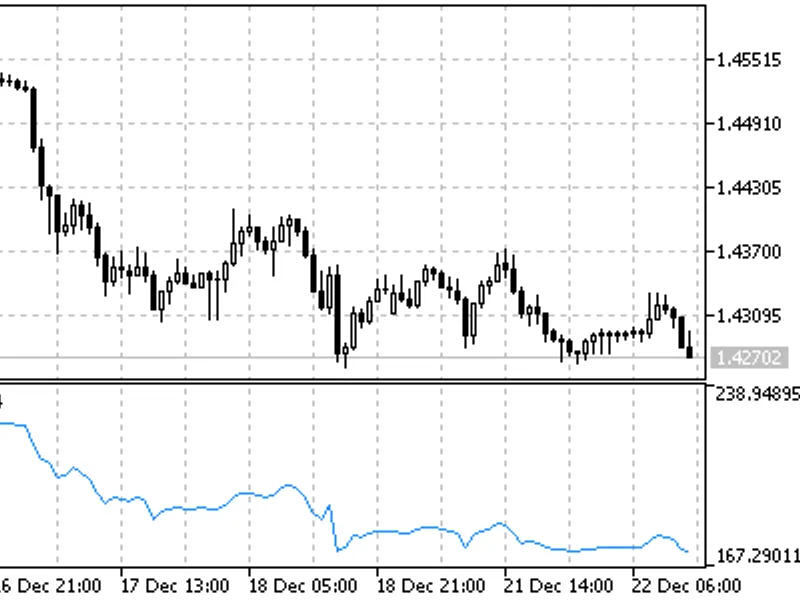
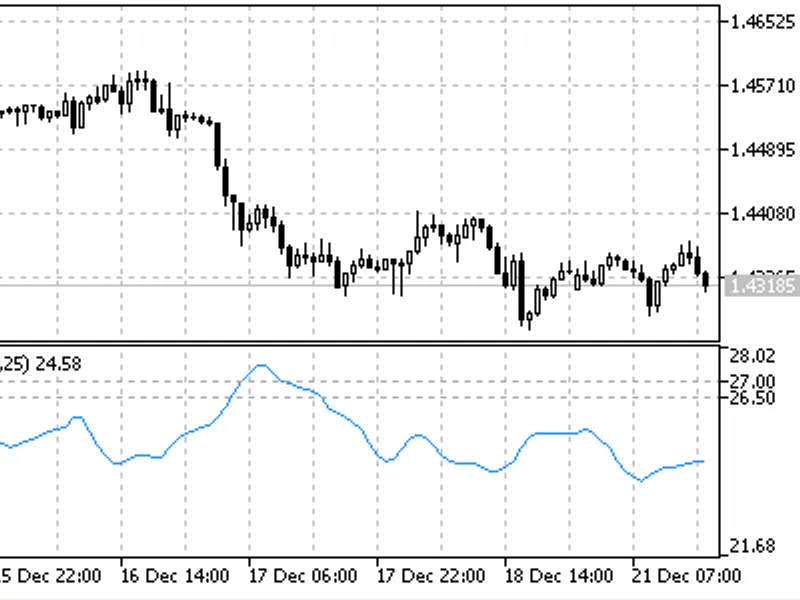
the chaikin volatility indicator measures the spread between the highest and lowest prices, assessing volatility based on the range between the maximum and minimum values. unlike t...
chaikin's oscillator (cho) is the difference between moving averages of accumulation/distribution.the concept of this oscillator is based on three key principles:1. if a security o...
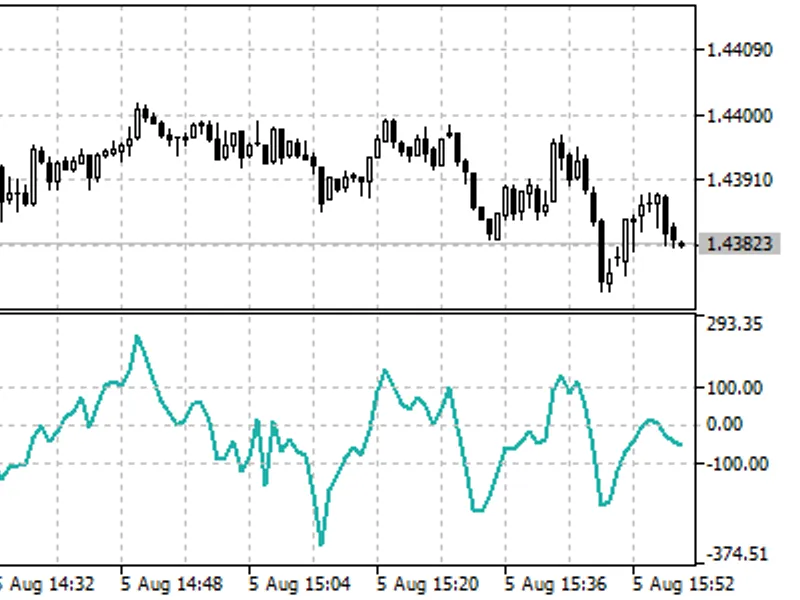
the commodity channel index (cci) is a technical indicator that measures the deviation of a commodity's price from its average statistical price.when the index values are high, it ...
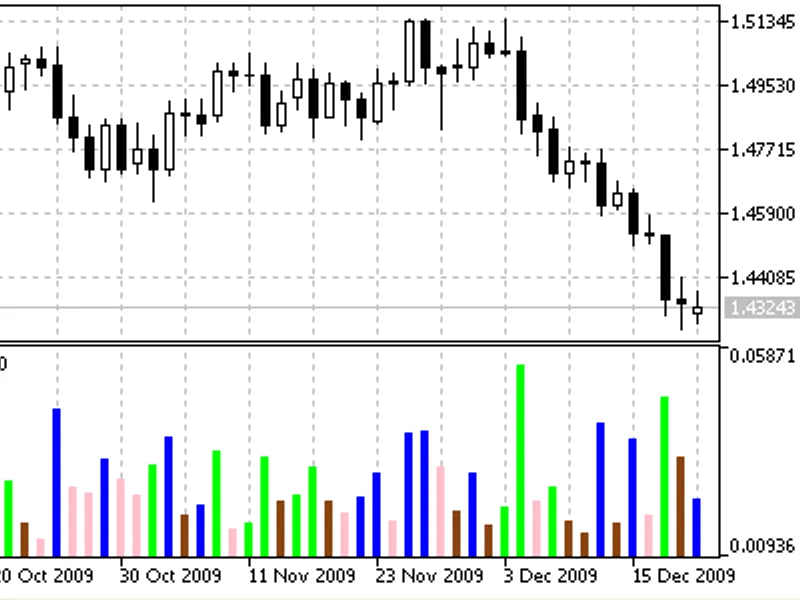
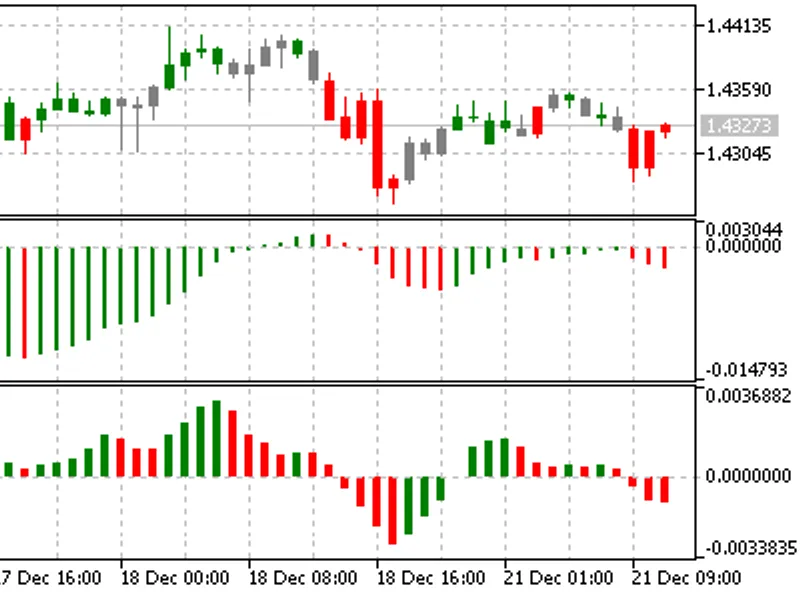
this indicator is inspired by bill williams' concept in his book, "new trading dimensions: how to profit from chaos in stocks, bonds and commodities" (2026).it visualizes the marke...
the financial markets are a constant battle between buyers ("bulls") and sellers ("bears"), where each day's price reflects the outcome of this struggle. understanding the balance ...
the financial markets are a constant battle between buyers and sellers, with prices fluctuating based on the forces of supply and demand. the bears power indicator, developed by al...
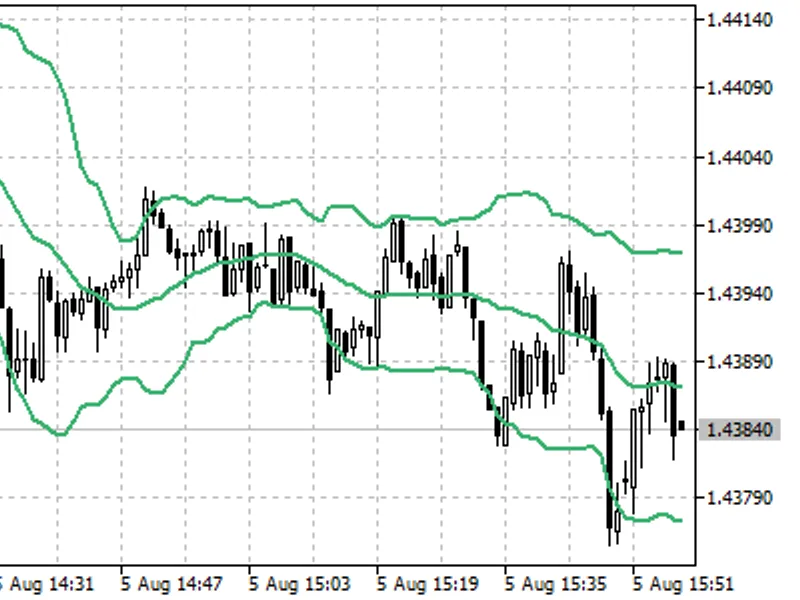
bollinger bands ® technical indicator (bb) is similar to envelopes, but with a key difference in how the bands are calculated. while envelopes plot bands a fixed percentage away fr...
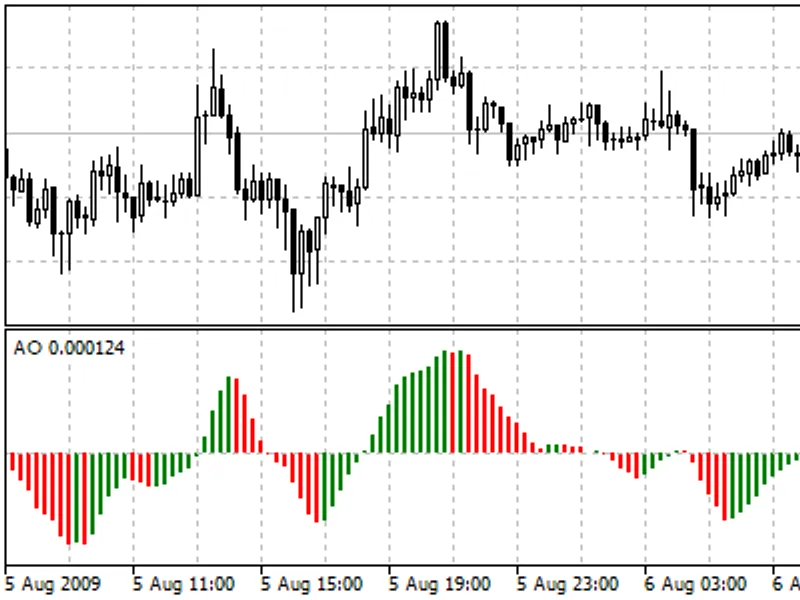
the awesome oscillator (ao) is a technical analysis tool developed by bill williams. it is calculated by subtracting a 34-period simple moving average (sma) from a 5-period sma, bo...
average true range (atr) is a widely recognized technical indicator that measures market volatility.this indicator has been a fundamental component of various trading systems and i...
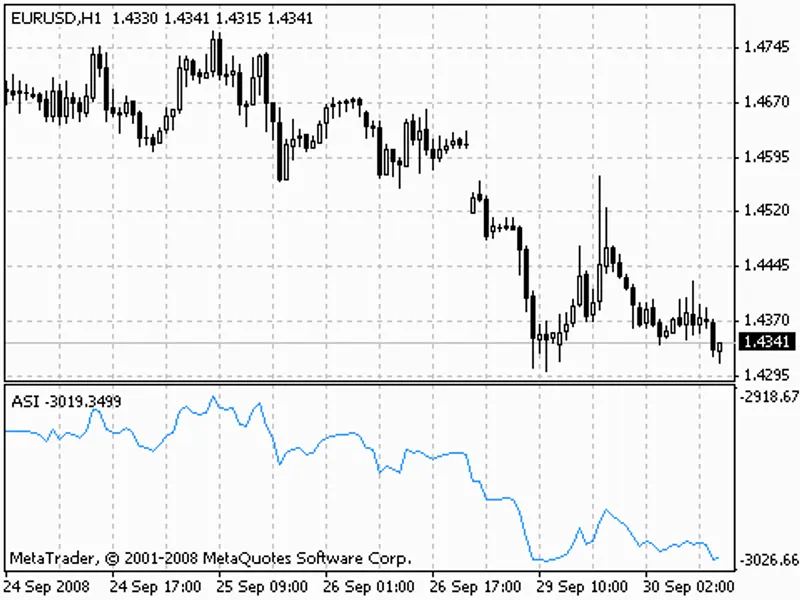
the accumulation swing index (asi) is an indicator created by welles wilder to reveal the 'phantom line' of the real market amidst price fluctuations. wilder's book, 'new concepts ...
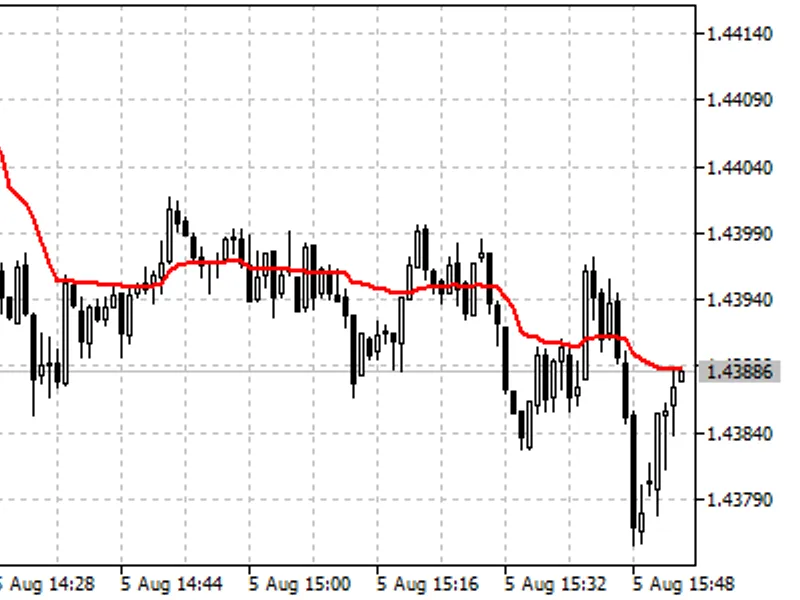
the adaptive moving average (ama) is a tool for constructing a moving average with reduced sensitivity to price series noises, enabling timely trend detection.this indicator was in...
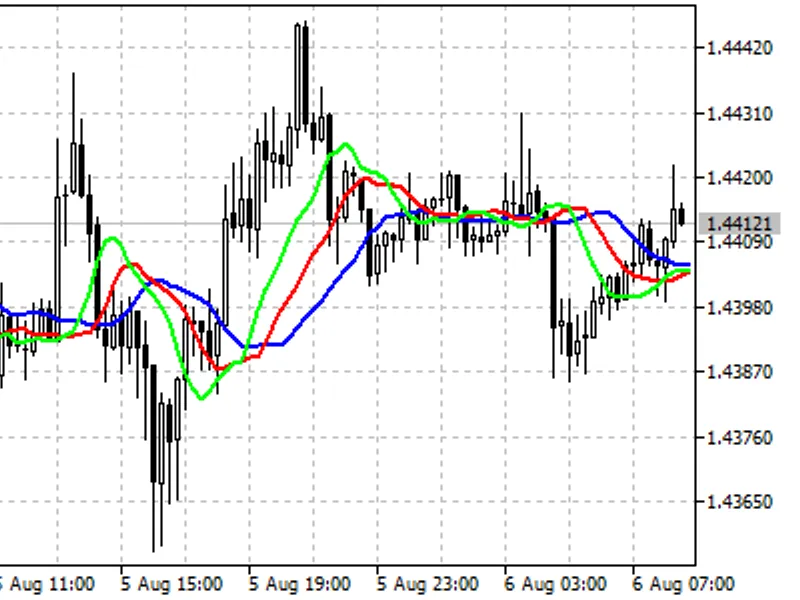
the alligator technical indicator is a powerful tool for traders, combining balance lines (moving averages) with fractal geometry and nonlinear dynamics. this indicator was introdu...
the average directional movement index wilder (adx wilder) is a technical indicator that assists in identifying market trends. it is derived from the algorithm outlined in welles w...
the average directional movement index (adx) is a technical indicator that assists in identifying market trends. it was introduced and comprehensively explained by welles wilder in...
the accumulation/distribution technical indicator is a valuable tool for traders, as it considers both price and volume changes. volume serves as a weighting factor, influencing th...
price is the last element to change in response to market forces. before price changes, the market driving force changes direction, and its acceleration must slow down and reach ze...
trade pilot — revolutionizing order managementmetatrader's default order management tools are outdated, requiring manual intervention for every step of the trading process.trade pi...
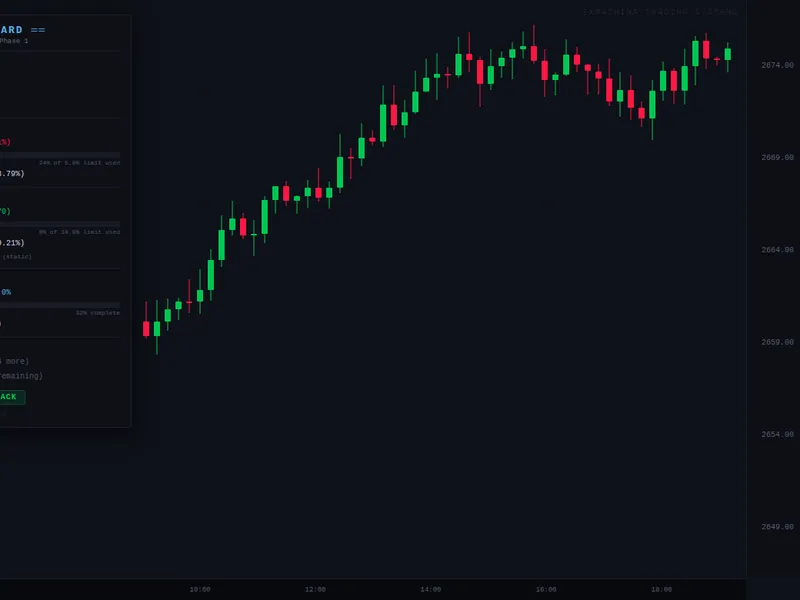
exmachina prop dashboard — never lose a funded account to math.precision before profit.imagine you're in the middle of a $100k ftmo challenge. you've been trading well for two week...
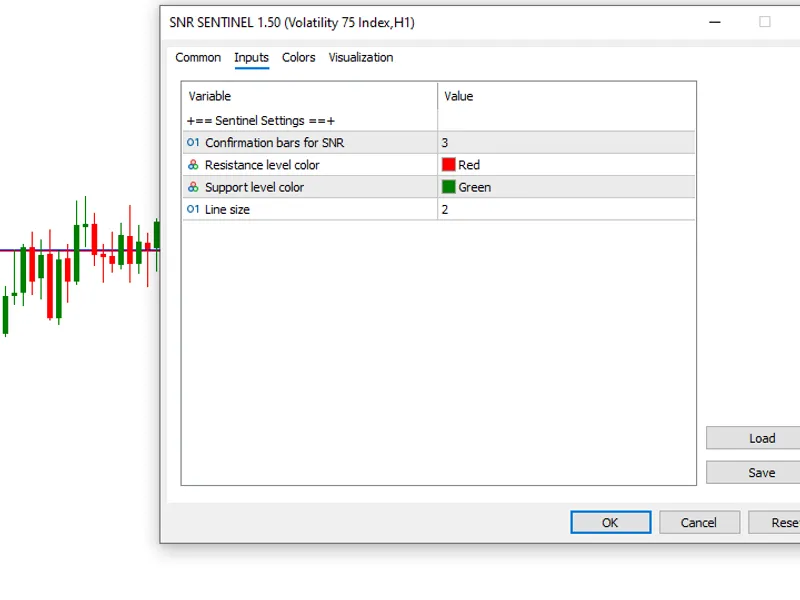
snr sentinel is an innovative indicator designed to streamline support and resistance (s/r) analysis by dynamically tracking the most relevant price levels.this indicator revolutio...
this script enables the user to download all available ohlc data from their terminal to a file in the commons folder. this data can be utilized to create custom symbols. if a file ...
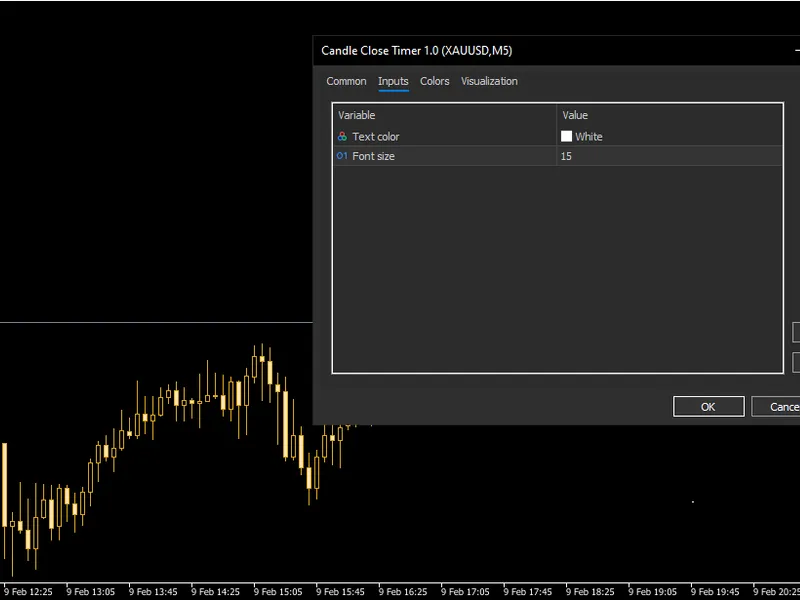
the candle close timer is a powerful metatrader 5 indicator designed to display the remaining time until the current candle's closure. features:- real-time countdown above the cand...
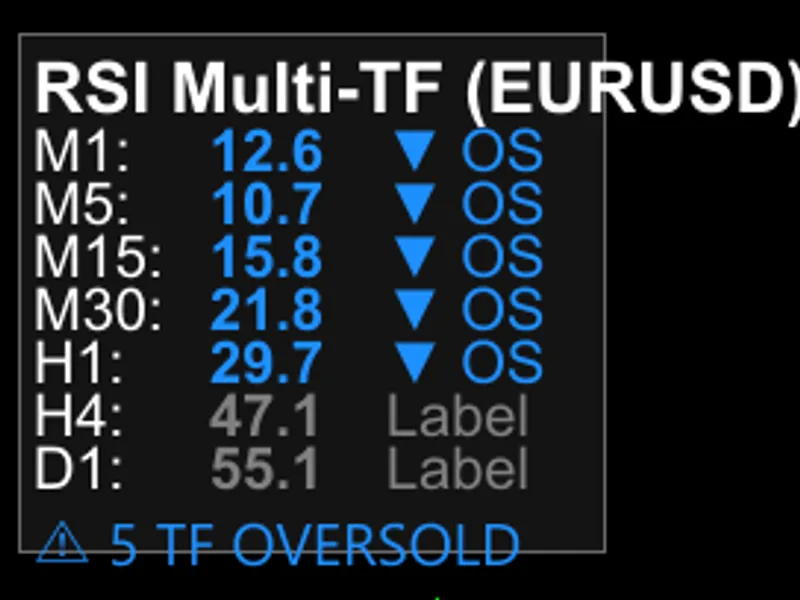
this multi-timeframe rsi scanner is designed to catch convergence setups before they fully develop. it monitors 7 timeframes and provides a visual dashboard with real-time rsi valu...
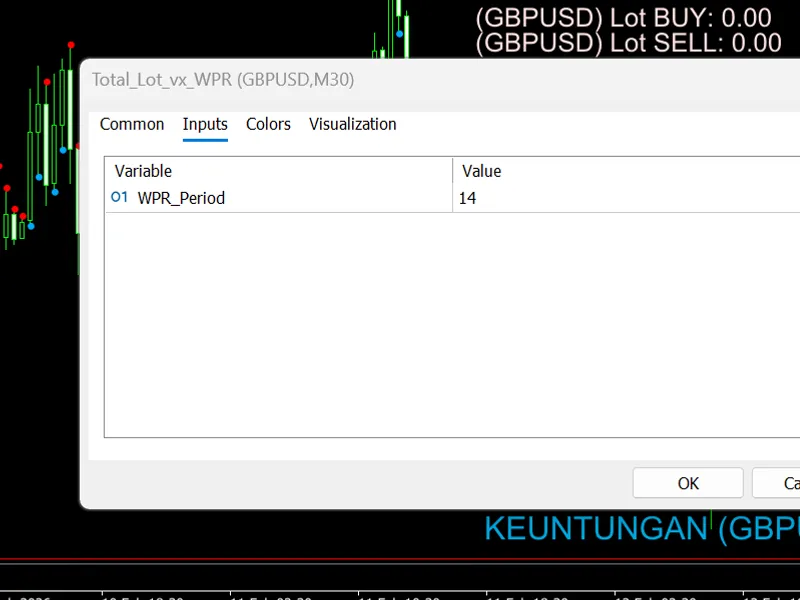
this indicator utilizes the wpr (williams percent range) to determine buy/sell signals. the initial approach involved identifying trends through overbought and oversold conditions....
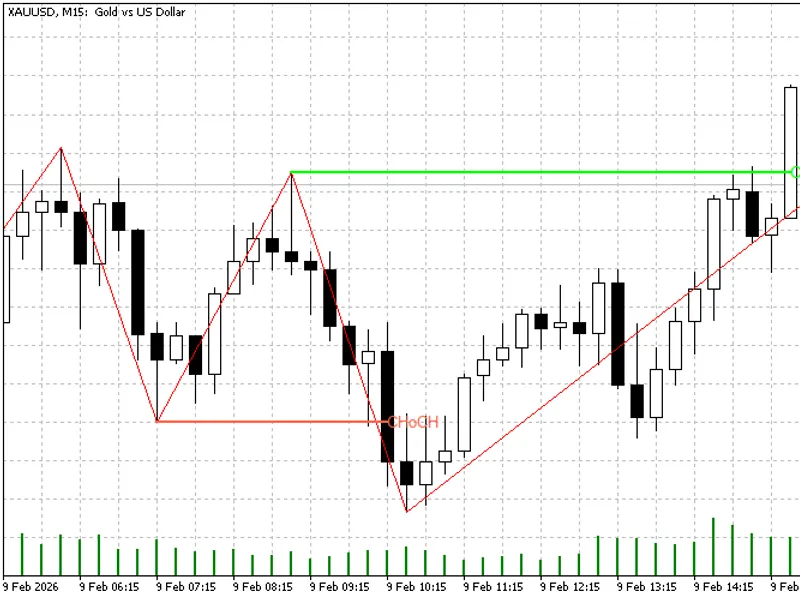
this indicator offers classic zigzag swing detection with automatic pivot tracking, providing a reliable foundation for structure analysis.break of structure (bos) detection identi...