Download ALL MT5 indicators (5653)

Similar MetaTrader Tools
MT4 Experts


MT4 Indicators


MT5 Experts


MT5 Indicators


Ichimoku Kinko Hyo Technical Indicator
Info
The Ichimoku Kinko Hyo Technical Indicator is a Indicator for MetaTrader 5 that the ichimoku kinko hyo technical indicator is a comprehensive tool for market analysis, offering insights into trend identification, support and resistance levels, and generating buy and sell signals. This indicator is most effective on weekly and daily charts, utilizing four time intervals of varying lengths to define its parameters.
Usage
This tool is typically used for enhancing chart analysis and decision making.
Platform
This Indicator works exclusively on MetaTrader 5 (both build 600+ and newer versions).
Setup
Place the downloaded file in MQL5/Indicators folder via File ? Open Data Folder in MetaTrader 5.
How to Install and Use Ichimoku Kinko Hyo Technical Indicator
1. Installation: Place your file in the MQL/Indicators folder via "Open Data Folder" and restart your terminal.
2. Loading: Find the indicator in the Navigator, drag it onto your chart, and configure the input parameters in the popup window.
3. Customization: Press Ctrl+I to open the indicator list, select your tool, and click "Properties" to change colors, levels, or visual styles.
4. Updating: Replace the old file in the Indicators folder with the new version and restart the platform to apply changes.
Frequently Asked Questions
Q: Why is my indicator not showing? A: Verify the file is in the MQL/Indicators folder, or try right-clicking the "Indicators" tree in the Navigator and clicking "Refresh."
Q: Do custom indicators slow down the platform? A: Too many complex indicators can impact performance; remove unused ones via the "Indicator List" (Ctrl+I).
Q: Can I use MT4 indicators on MT5? A: No, MQL4 and MQL5 are distinct languages; ensure the indicator is compiled specifically for your platform version.
What this tool does
The Ichimoku Kinko Hyo technical indicator is a comprehensive tool for market analysis, offering insights into trend identification, support and resistance levels, and generating buy and sell signals.
Typical Use Case
This Indicator excels in automated trading and technical analysis on MetaTrader 5.
Compatible Platform & Setup
This Indicator works on MetaTrader 5. Place the file in the MQL5/Indicators folder and restart the terminal.
Description & Settings
Related: Ichimoku Oscillator - another powerful indicator for MetaTrader 5 traders.
The Ichimoku Kinko Hyo technical indicator is a comprehensive tool for market analysis, offering insights into trend identification, support and resistance levels, and generating buy and sell signals.Also recommended: Ichimoku Cloud - similar indicator with strong performance on MetaTrader 5.
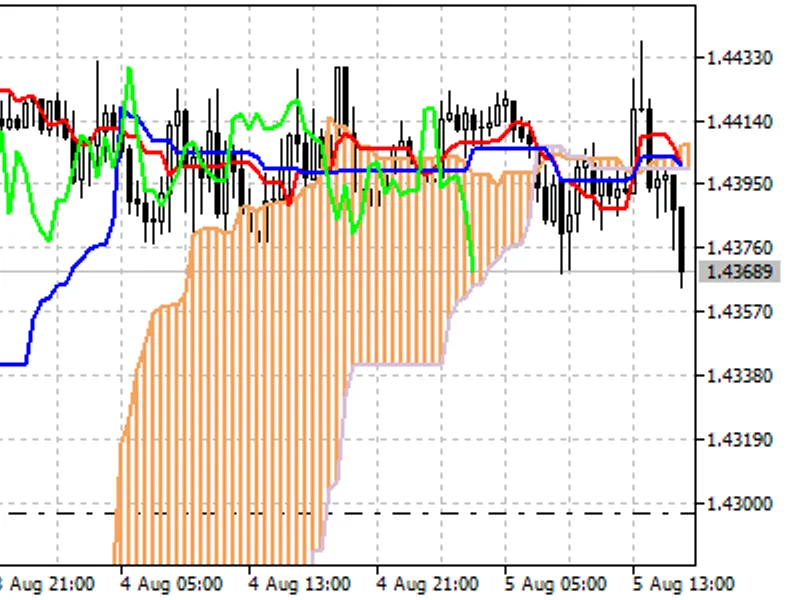
This indicator is most effective on weekly and daily charts, utilizing four time intervals of varying lengths to define its parameters. The key lines and their calculations are as follows:
- Tenkan-sen: Represents the average price during the first time interval, calculated as the sum of the maximum and minimum within this period, divided by two.
- Kijun-sen: Displays the average price over the second time interval.
- Senkou Span A: Indicates the midpoint between Tenkan-sen and Kijun-sen, projected forward by the length of the second time interval.
- Senkou Span B: Shows the average price during the third time interval, shifted forward by the second time interval.
- Chikou Span: Reflects the closing price of the current candle, shifted backward by the second time interval.
The area between Senkou Span A and B is known as the 'cloud', which provides valuable information:
- If the price is within the cloud, the market is considered non-trending, and the cloud's edges act as support and resistance levels.
- When the price is above the cloud, the upper line becomes the first support level, and the lower line becomes the second support level.
- Conversely, if the price is below the cloud, the lower line is the first resistance level, and the upper line is the second resistance level.
Chikou Span's movement also generates signals:
- A bottom-up traverse of the price chart by Chikou Span is a buy signal.
- A top-down traverse indicates a sell signal.
Kijun-sen serves as a market movement indicator. If the price is above it, further price increases are likely. When the price crosses this line, a trend change may occur. Buy and sell signals are generated when Tenkan-sen crosses Kijun-sen in the corresponding direction.
Tenkan-sen indicates the market trend. Its upward or downward slope suggests a trend, while a horizontal movement implies a channel.
Ichimoku Kinko Hyo is a versatile indicator, offering a holistic view of market dynamics and generating actionable trading signals.
You may also like: XM A Ichimoku - excellent alternative for indicator users on MetaTrader 5.
⚠ Limitations & Risk Warning
- This tool is provided for educational and testing purposes only.
- Past performance does not guarantee future results.
- Trading involves substantial risk of loss. Use on a demo account first.
- Results may vary depending on market conditions, broker, and settings.
- We recommend thorough backtesting and forward testing before using with real funds.