









relative strength index (rsi)
Info
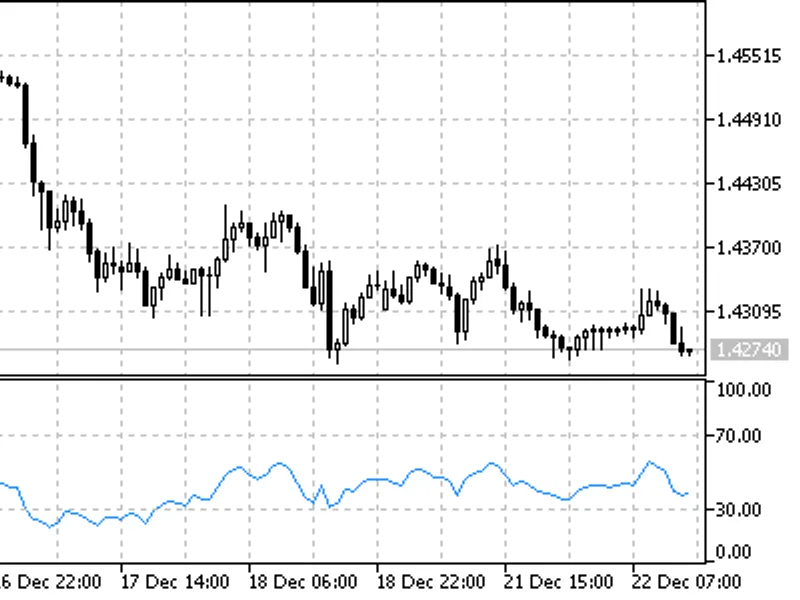
The relative strength index (rsi) is a Indicator for MetaTrader 5 that the relative strength index (rsi) is a widely used technical indicator that measures the speed and change of price movements. it is a price-following oscillator that fluctuates between 0 and 100, providing insights into potential overbought or oversold conditions in the market.
Usage
This tool is typically used for enhancing chart analysis and decision making.
Platform
This Indicator works exclusively on MetaTrader 5 (both build 600+ and newer versions).
Setup
Place the downloaded file in MQL5/Indicators folder via File ? Open Data Folder in MetaTrader 5.
How to Install and Use relative strength index (rsi)
1. Installation: Place your file in the MQL/Indicators folder via "Open Data Folder" and restart your terminal.
2. Loading: Find the indicator in the Navigator, drag it onto your chart, and configure the input parameters in the popup window.
3. Customization: Press Ctrl+I to open the indicator list, select your tool, and click "Properties" to change colors, levels, or visual styles.
4. Updating: Replace the old file in the Indicators folder with the new version and restart the platform to apply changes.
Frequently Asked Questions
Q: Why is my indicator not showing? A: Verify the file is in the MQL/Indicators folder, or try right-clicking the "Indicators" tree in the Navigator and clicking "Refresh."
Q: Do custom indicators slow down the platform? A: Too many complex indicators can impact performance; remove unused ones via the "Indicator List" (Ctrl+I).
Q: Can I use MT4 indicators on MT5? A: No, MQL4 and MQL5 are distinct languages; ensure the indicator is compiled specifically for your platform version.
What this tool does
the relative strength index (rsi) is a widely used technical indicator that measures the speed and change of price movements.
Typical Use Case
This Indicator excels in automated trading and technical analysis on MetaTrader 5.
Compatible Platform & Setup
This Indicator works on MetaTrader 5. Place the file in the MQL5/Indicators folder and restart the terminal.
Description & Settings
Related: multi-timeframe relative strength index (mtf rsi) indicator for mt4/mt5 - another powerful indicator for MetaTrader 5 traders.
the relative strength index (rsi) is a widely used technical indicator that measures the speed and change of price movements. it is a price-following oscillator that fluctuates between 0 and 100, providing insights into potential overbought or oversold conditions in the market.Also recommended: candle body ratio indicator: strength meter with heatmap - similar indicator with strong performance on MetaTrader 5.
introduced by j. welles wilder in 2026, the rsi has become a staple tool for traders and analysts. wilder initially suggested using a 14-day rsi, but over time, variations such as the 9-day and 25-day rsis have also gained traction.
one of the key methods of interpreting the rsi is by identifying divergences. a divergence occurs when the security reaches a new high, but the rsi fails to surpass its previous high. this discrepancy suggests a potential reversal in the market's direction. when the rsi subsequently turns down and drops below its most recent low, it forms a 'failure swing', which is considered a confirmation of the impending reversal.
here are some ways to utilize the rsi for chart analysis:
- **tops and bottoms**: the rsi typically peaks above 70 and bottoms out below 30, often preceding similar movements in the underlying price chart.
- **chart formations**: rsi can form recognizable chart patterns like head and shoulders or triangles, which may not always be apparent on the price chart.
- **failure swing**: this occurs when the rsi surpasses a previous high or falls below a recent low, indicating potential support or resistance penetrations or breakouts.
- **support and resistance levels**: rsi can clearly illustrate support and resistance levels, sometimes more visibly than price movements alone.
- **divergences**: as mentioned earlier, divergences between price and rsi can signal potential corrections, with prices often moving in the direction of the rsi.
the rsi is calculated using the following formula:
rsi = 100 - (100 / (1 + u / d))
where:
- u represents the average number of positive price changes.
- d represents the average number of negative price changes.
You may also like: relative strength index of volatility - excellent alternative for indicator users on MetaTrader 5.
Source Code
#property copyright "robotfx"
#property link "https://robotfx.org"
#property description "this code is educational. feel free to use, modify and upgrade as you wish. visit robotfx.org for professional trading tools"
#property indicator_separate_window
#property indicator_minimum 0
#property indicator_maximum 100
#property indicator_level1 30
#property indicator_level2 70
#property indicator_buffers 3
#property indicator_plots   1
.......
⚠ Limitations & Risk Warning
- This tool is provided for educational and testing purposes only.
- Past performance does not guarantee future results.
- Trading involves substantial risk of loss. Use on a demo account first.
- Results may vary depending on market conditions, broker, and settings.
- We recommend thorough backtesting and forward testing before using with real funds.