


Parabolic SAR Indicator for MetaTrader
Info
The Parabolic SAR Indicator for MetaTrader is a Indicator for MetaTrader 5 that the parabolic sar (stop and reverse) technical indicator is a powerful tool for analyzing trending markets. It is constructed on the price chart, resembling a moving average with a key difference: the Parabolic SAR moves with higher acceleration and can change its position relative to the price.
Usage
This tool is typically used for enhancing chart analysis and decision making.
Platform
This Indicator works exclusively on MetaTrader 5 (both build 600+ and newer versions).
Setup
Place the downloaded file in MQL5/Indicators folder via File ? Open Data Folder in MetaTrader 5.
How to Install and Use Parabolic SAR Indicator for MetaTrader
1. Installation: Place your file in the MQL/Indicators folder via "Open Data Folder" and restart your terminal.
2. Loading: Find the indicator in the Navigator, drag it onto your chart, and configure the input parameters in the popup window.
3. Customization: Press Ctrl+I to open the indicator list, select your tool, and click "Properties" to change colors, levels, or visual styles.
4. Updating: Replace the old file in the Indicators folder with the new version and restart the platform to apply changes.
Frequently Asked Questions
Q: Why is my indicator not showing? A: Verify the file is in the MQL/Indicators folder, or try right-clicking the "Indicators" tree in the Navigator and clicking "Refresh."
Q: Do custom indicators slow down the platform? A: Too many complex indicators can impact performance; remove unused ones via the "Indicator List" (Ctrl+I).
Q: Can I use MT4 indicators on MT5? A: No, MQL4 and MQL5 are distinct languages; ensure the indicator is compiled specifically for your platform version.
What this tool does
The Parabolic SAR (Stop and Reverse) technical indicator is a powerful tool for analyzing trending markets.
Typical Use Case
This Indicator excels in automated trading and technical analysis on MetaTrader 5.
Compatible Platform & Setup
This Indicator works on MetaTrader 5. Place the file in the MQL5/Indicators folder and restart the terminal.
Description & Settings
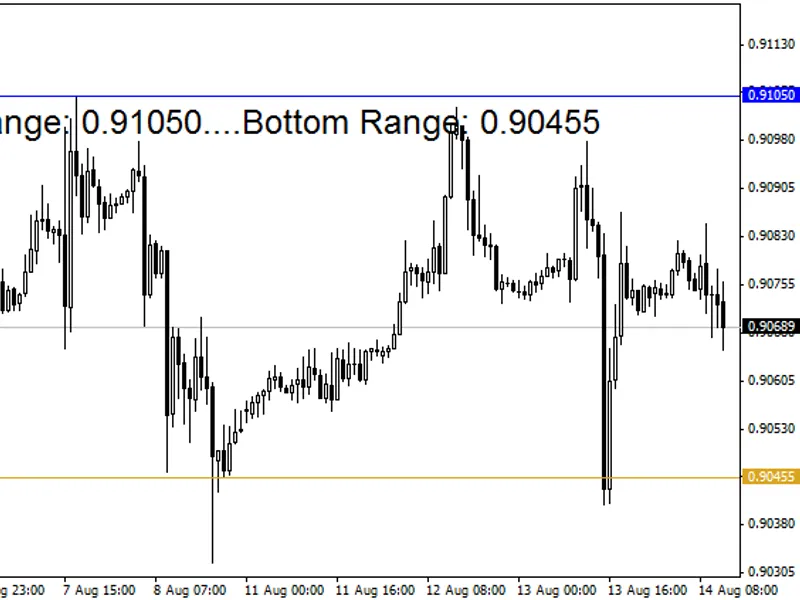
Related: Price Channel Indicator - another powerful indicator for MetaTrader 5 traders.
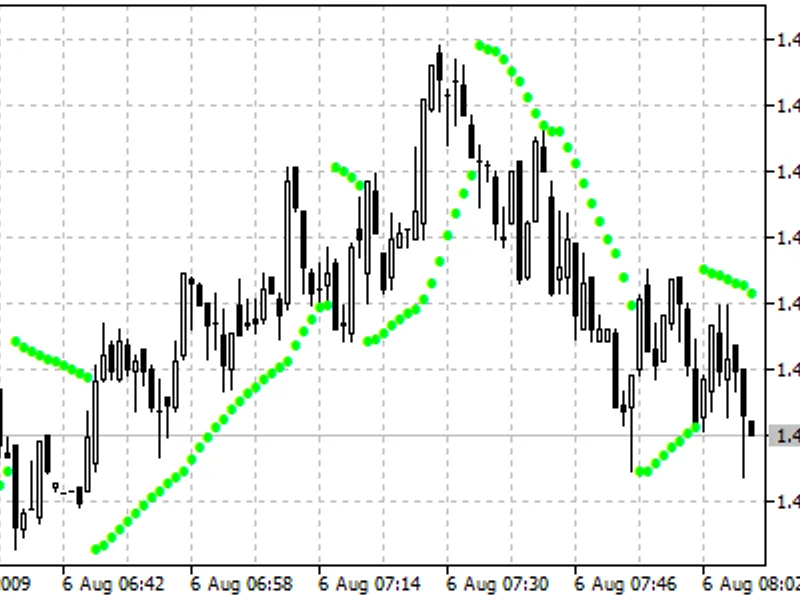
The Parabolic SAR (Stop and Reverse) technical indicator is a powerful tool for analyzing trending markets. It is constructed on the price chart, resembling a moving average with a key difference: the Parabolic SAR moves with higher acceleration and can change its position relative to the price.Also recommended: Multi-Timeframe Moving Average Indicator (v03) - similar indicator with strong performance on MetaTrader 5.
In an uptrend, the indicator is positioned below the prices, while in a downtrend, it sits above the prices. When the price crosses the Parabolic SAR lines, the indicator reverses, and its subsequent values are plotted on the opposite side of the price. This reversal indicates a potential trend change or a transition to a correction stage or flat market.
The Parabolic SAR is particularly useful for identifying exit points. Traders should close long positions when the price falls below the SAR line and short positions when the price rises above the SAR line. This strategy involves tracking the movement of the Parabolic SAR and maintaining open positions only in the direction of its movement. Often, the indicator acts as a trailing stop line.
For long positions, the Parabolic SAR line will ascend, regardless of price direction. The extent of this movement is determined by the price movement's magnitude. The calculation for long positions is as follows:
- SAR (i) = SAR (i - 1) + ACCELERATION * (HIGH (i - 1) - SAR (i - 1))
For short positions, the calculation is:
- SAR (i) = SAR (i - 1) + ACCELERATION * (LOW (i - 1) - SAR (i - 1))
Here, SAR (i - 1) represents the Parabolic SAR value on the previous bar, ACCELERATION is the acceleration factor, HIGH (i - 1) is the maximum price for the previous period, and LOW (i - 1) is the minimum price for the same period.
The indicator's value increases if the current bar's price is higher than the previous bullish bar, and vice versa. Simultaneously, the acceleration factor (ACCELERATION) doubles, causing the Parabolic SAR and the price to converge. Essentially, the faster the price rises or falls, the quicker the indicator moves towards the price.
You may also like: Multi-Timeframe Relative Strength Index (MTF RSI) Indicator for MT4/MT5 - excellent alternative for indicator users on MetaTrader 5.
⚠ Limitations & Risk Warning
- This tool is provided for educational and testing purposes only.
- Past performance does not guarantee future results.
- Trading involves substantial risk of loss. Use on a demo account first.
- Results may vary depending on market conditions, broker, and settings.
- We recommend thorough backtesting and forward testing before using with real funds.