
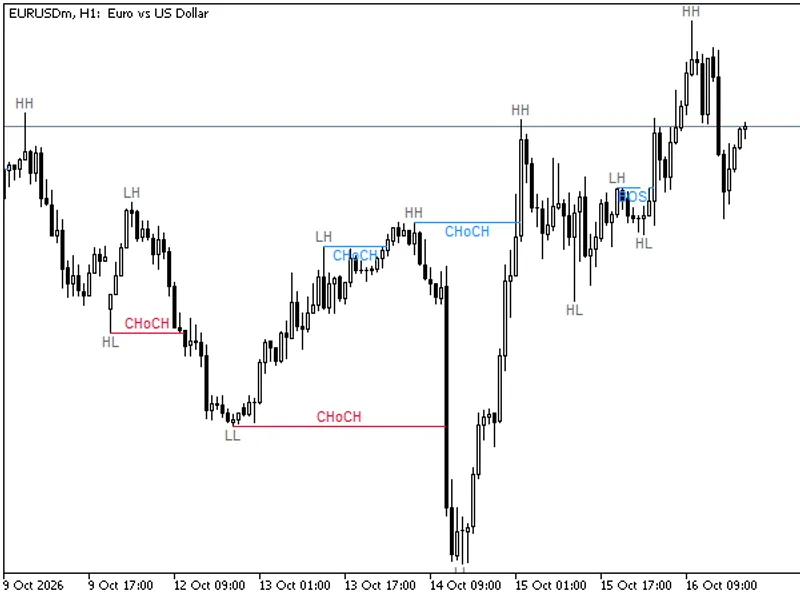
Market Structure from Pullback Swings -- BOS, CHoCH, IDM
Info
The Market Structure from Pullback Swings -- BOS, CHoCH, IDM is a Indicator for MetaTrader 5 that market structure from pullback swingsthis indicator identifies market structure based on smart money concepts (smc) principles, building upon a previous pullback detection indicator. It identifies key market structure elements: a trend, the current live high and low, and four critical events that influence them.
Usage
This tool is typically used for enhancing chart analysis and decision making.
Platform
This Indicator works exclusively on MetaTrader 5 (both build 600+ and newer versions).
Setup
Place the downloaded file in MQL5/Indicators folder via File ? Open Data Folder in MetaTrader 5.
How to Install and Use Market Structure from Pullback Swings -- BOS, CHoCH, IDM
1. Installation: Place your file in the MQL/Indicators folder via "Open Data Folder" and restart your terminal.
2. Loading: Find the indicator in the Navigator, drag it onto your chart, and configure the input parameters in the popup window.
3. Customization: Press Ctrl+I to open the indicator list, select your tool, and click "Properties" to change colors, levels, or visual styles.
4. Updating: Replace the old file in the Indicators folder with the new version and restart the platform to apply changes.
Frequently Asked Questions
Q: Why is my indicator not showing? A: Verify the file is in the MQL/Indicators folder, or try right-clicking the "Indicators" tree in the Navigator and clicking "Refresh."
Q: Do custom indicators slow down the platform? A: Too many complex indicators can impact performance; remove unused ones via the "Indicator List" (Ctrl+I).
Q: Can I use MT4 indicators on MT5? A: No, MQL4 and MQL5 are distinct languages; ensure the indicator is compiled specifically for your platform version.
What this tool does
Market Structure from Pullback SwingsThis indicator identifies market structure based on Smart Money Concepts (SMC) principles, building upon a previous pullback detection indicator.
Typical Use Case
This Indicator excels in automated trading and technical analysis on MetaTrader 5.
Compatible Platform & Setup
This Indicator works on MetaTrader 5. Place the file in the MQL5/Indicators folder and restart the terminal.
Description & Settings
Related: Smart Money Concepts: Break of Structure and Change of Character Analysis - another powerful indicator for MetaTrader 5 traders.
Market Structure from Pullback SwingsAlso recommended: Extreme Price Filter: Identify and Avoid Market Traps - similar indicator with strong performance on MetaTrader 5.
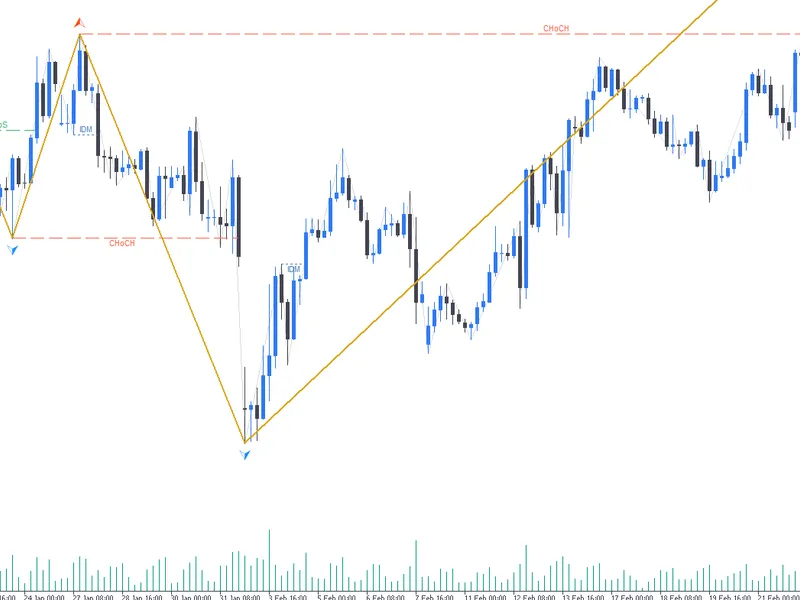
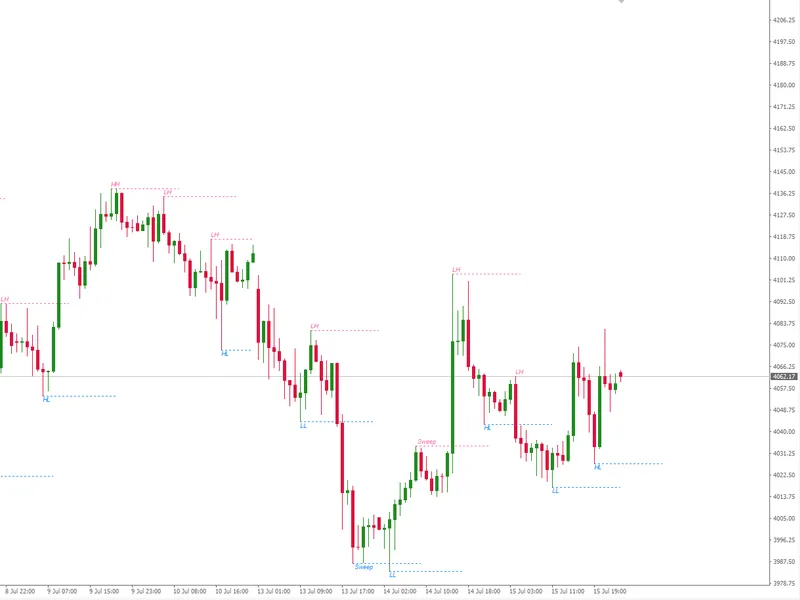
This indicator identifies market structure based on Smart Money Concepts (SMC) principles, building upon a previous pullback detection indicator. It identifies key market structure elements: a trend, the current live high and low, and four critical events that influence them.
Elements on the Chart:
Pullback zig-zag: A thin, pale line representing every swing identified by the pullback rule. This serves as raw context.
Structure zig-zag: A thick, gold line highlighting only the highs and lows actively used by the market structure. It is a subset of the pale zig-zag.
Structure markers: Arrows above or below indicating the structure high and low points.
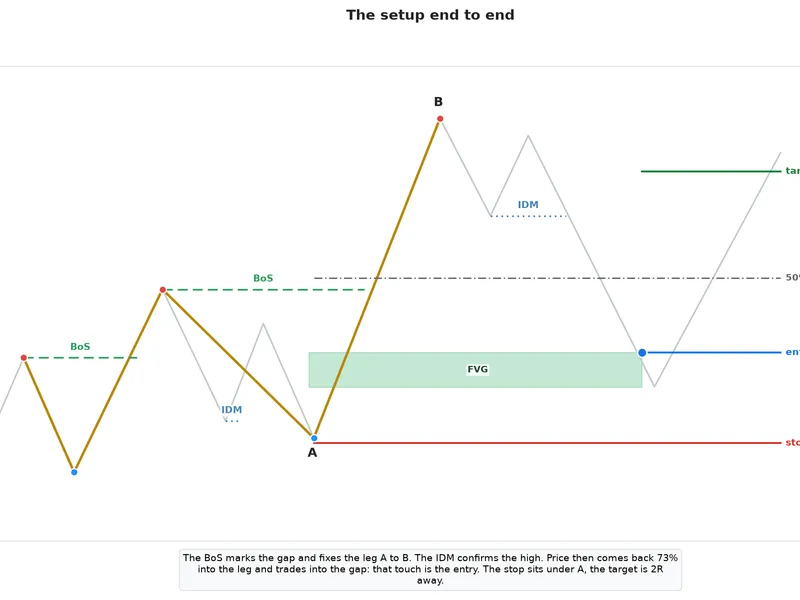
BoS (Break of Structure): Indicated by a dashed green line. This occurs when a level is taken in the direction of the trend.
CHoCH (Change of Character): Indicated by a dashed red line. This occurs when a level is taken against the trend, signaling a potential trend reversal.
x (Liquidity Sweep): Indicated by a solid purple line. This marks a liquidity sweep where only the wick of a candle breaches a level, and price subsequently moves in the opposite direction.
IDM (Inducement): Indicated by a dotted blue line. This represents a pullback level whose breach confirms a new structure extreme.
Each event line is horizontal and spans from the bar that set the level to the bar that took it, visually indicating the duration that level remained intact.
Layer One: The Pullback Swings
A high is considered a swing only after price trades back through the low of the candle that formed it. Swings are events with timestamps, not merely geometric shapes.
Key properties of this layer:
- The output strictly alternates between high and low. Two consecutive highs or lows are not possible.
- A swing is confirmed after the candle it is on is closed. The structure layer only processes confirmed pullbacks, ensuring structure is built on final swing points.
Both layers are processed one closed bar at a time, with pullbacks evaluated first, followed by structure. This ensures that when the structure layer evaluates a bar, it has access to any swing confirmed on that same bar.
Layer Two: The Structure
This layer maintains three core components:
- Trend: Can be None, Up, or Down.
- Structure High: The current high whose break indicates bullish movement.
- Structure Low: The current low whose break indicates bearish movement.
The structure is initialized with the first pullback high and low, with the trend initially set to None. Subsequent actions by the pullback layer provide reference levels, but do not directly alter the structure.
The Break Rule: Close vs. Wick Sweeps
A level is considered broken only when a candle closes beyond it. A candle whose wick extends beyond a level, but closes within it, is considered a sweep.
For each closed candle, the following events are determined based on the current trend and levels:
- Trend: None, Candle Action: Closed above high / below low, Event: BoS — Trend becomes Up / Down.
- Trend: Up, Candle Action: Closed above structure high, Event: BoS — continuation, trend stays Up.
- Trend: Up, Candle Action: Closed below structure low, Event: CHoCH — trend flips to Down.
- Trend: Down, Candle Action: Closed below structure low, Event: BoS — continuation, trend stays Down.
- Trend: Down, Candle Action: Closed above structure high, Event: CHoCH — trend flips to Up.
- Trend: Any, Candle Action: Wick beyond a level, close back inside, Event: Sweep candidate — recorded, not yet drawn.
- Trend: Any, Candle Action: Stayed inside both levels, Event: Nothing.
BoS and CHoCH are fundamentally the same event (a close through a level), distinguished only by whether the break aligns with the prevailing trend. The initial break establishes a BoS in the absence of a trend.
The Sweep: When a Wick Becomes an 'x'
A wick breaching a level is initially ambiguous. It becomes an 'x' only when the next break occurs on the opposite side. For example, in an uptrend:
1. Price wicks above the structure high but closes back below it. This is noted as a sweep candidate.
2. Price then closes below the structure low.
This resolves the ambiguity: the upward move is identified as a liquidity grab. The indicator then moves the structure high to the sweep candle, draws the solid 'x' line at the old level, and records the CHoCH.
The 'x' line spans from the bar that set the level to the bar whose wick breached it, drawn at the old level's price. The bearish scenario is the mirror image.
Three rules govern sweeps:
- If multiple candles wick through a level, the furthest one prevails.
- If price later closes through the level in the same direction, the sweep candidate is discarded as it was part of an ordinary break.
- A sweep candidate is discarded if any new structure point is published, as older wicks must not retroactively alter points once the structure has progressed.
IDM: Confirming the New Extreme
A break confirms an event but raises a new question: the location of the new extreme. The inducement (IDM) provides the answer. At the moment of a BoS:
- The latest pullback low becomes the reference (the IDM).
- Price continues to move; the indicator tracks the highest high reached but does not publish it.
- Each time a new pullback low forms above the current IDM, the IDM ratchets up to it. The reference is always the highest pullback low observed since the break.
- When price eventually takes the IDM, the new structure high is confirmed as the highest high between the breaking candle and the candle that took the IDM.
The dotted IDM line is drawn from the pullback that set it to the candle that breached it, with the structure high marker appearing simultaneously. This line serves as an audit: every structure high should have an IDM line ending on the bar where its marker appears.
The bearish case is mirrored: after a bearish break, the IDM is the lowest pullback high, and taking it confirms the new structure low.
While an extreme is pending, its own side of the structure has no level, meaning only the opposite side can be broken. The IDM naturally sits at or above the structure low, so price must take the IDM before it can reach the low.
Keeping the Chain a Zig-Zag
Structure points must alternate, similar to the pullback layer. Two consecutive highs or lows indicate a broken chain.
- A bullish break aims to publish a high. If the newest point is already a high, a low is inserted by taking the lowest low between that high and the breaking candle. If the newest point is a low, the chain alternates naturally.
- This rule applies to all cases: BoS in an established trend, CHoCH, and the first break after seeding.
Edge Cases, Stated Openly:
- One candle takes the IDM and closes through the opposite level: The extreme is confirmed first, then the break is recorded. This mirrors the sweep-then-CHoCH scenario.
- A pending extreme is never confirmed because price breaks the other way first: The tracked extreme is published as is, then the break is processed. The chain remains alternating.
- The breaking candle itself returns to the IDM: Confirmation cannot occur on the breaking candle; the earliest is the following bar.
- No pullback exists yet to serve as the IDM: The current structure level on that side is used instead, typically only on the oldest chart bars.
On Repainting - Read Before Using:
The pullback layer does not repaint. The structure layer does repaint, which is an inherent characteristic of the method, not a defect.
Two elements repaint:
- A pending extreme moves as price extends until the IDM is taken. It is published live to show structure formation.
- A sweep relocates a point backwards by design; this is the purpose of the 'x'.
Once an extreme is confirmed by its IDM and no sweep is pending, it becomes final. Events (BoS, CHoCH, x, IDM) are append-only and do not move.
Treat structure points as provisional until their IDM line exists, and events as the stable record. Only closed candles are evaluated; the forming candle is ignored.
Inputs:
Pullback Layer:
- Start by looking for: Determines the initial search direction for a swing high or low. Affects only the oldest bars.
- Pullback break confirmed by: Controls the sensitivity. 'Wick' uses the standard rule. 'Close' yields fewer, larger pullbacks and structure moves, suitable for lower timeframes or volatile symbols.
Market Structure:
- Extreme confirmed when reference is: Dictates how the IDM must be taken. 'Wick' means touched; 'Close' requires a close through it, confirming extremes later and filtering shallow pokes.
- Detect liquidity sweeps: If true, liquidity sweeps are detected, and points may be relocated. If false, levels are taken by close only, with no 'x' marker, and points are never relocated. Useful for comparative analysis.
There are no period, depth, or sensitivity settings for the structure itself. To achieve larger structures, increase the timeframe or set the pullback rule to 'Close'.
Display Options:
- Pullback zig-zag: Controls the appearance of the faint underlying swings (color, style, width, or off).
- Structure zig-zag: Controls the appearance of the gold structure line.
- Structure markers: Controls arrows on structure high/low (Wingdings codes, pixel distance). Buffers remain filled even when arrows are off for iCustom access.
- Break lines: Separate colors for BoS, CHoCH, x, and IDM, plus line width and captions. Captions can be turned off on dense charts.
- Alerts: Popup and push notifications for structure events, firing only on live updates and once per event.
Using it from an EA:
Five buffers are available:
- Buffer 0: Price of a structure high.
- Buffer 1: Price of a structure low.
- Buffer 2: Trend on every bar (1 for up, -1 for down, 0 for none). This buffer is filled on every bar, including the forming one, allowing real-time trend reading.
- Buffer 3: Price of a confirmed pullback high.
- Buffer 4: Price of a confirmed pullback low.
Example snippet:
int h = iCustom(_Symbol, _Period, "SMC_MarketStructure");
double trend[];
CopyBuffer(h, 2, 0, 1, trend); // 1 = up, -1 = down, 0 = none
The other four buffers are sparse. Both the pullback and structure engines are self-contained classes that can be copied directly into an Expert Advisor for direct use, bypassing iCustom. This method also provides access to events not exposed through buffers.
What it Deliberately Does Not Do:
This indicator focuses solely on market structure. It does not provide order blocks, fair value gaps, premium/discount zones, entry signals, or explicit HH/HL/LH/LL labeling. Its purpose is to provide a dependable trend and pair of levels, with each decision visible and verifiable on the chart.
You may also like: Market Structure BOS and CHoCH Indicator: Swing Points, No Repaint, Alerts - excellent alternative for indicator users on MetaTrader 5.
Source Code
#property copyright "RobotFX"
#property link "https://robotfx.org"
#property version   "1.00"
#property description "This code is educational. Feel free to use, modify and upgrade as you wish. Visit ROBOTFX.ORG for professional trading tools"
#property indicator_chart_window
#property indicator_buffers 5
#property indicator_plots   5
#property indicator_label1  "MS High"
#property indicator_type1   DRAW_ARROW
#property indicator_color1  clrOrangeRed
.......
⚠ Limitations & Risk Warning
- This tool is provided for educational and testing purposes only.
- Past performance does not guarantee future results.
- Trading involves substantial risk of loss. Use on a demo account first.
- Results may vary depending on market conditions, broker, and settings.
- We recommend thorough backtesting and forward testing before using with real funds.