
Equity and Drawdown Monitor Panel
Info
The Equity and Drawdown Monitor Panel is a Indicator for MetaTrader 5 that equity/drawdown monitor panelthe core idea of this panel is to provide a clear and immediate view of your account's performance, specifically focusing on equity and its drawdown from the highest point. Unlike balance, which only reflects closed trades, equity includes the floating profit or loss of open positions.
Usage
This tool is typically used for enhancing chart analysis and decision making.
Platform
This Indicator works exclusively on MetaTrader 5 (both build 600+ and newer versions).
Setup
Place the downloaded file in MQL5/Indicators folder via File ? Open Data Folder in MetaTrader 5.
How to Install and Use Equity and Drawdown Monitor Panel
1. Installation: Place your file in the MQL/Indicators folder via "Open Data Folder" and restart your terminal.
2. Loading: Find the indicator in the Navigator, drag it onto your chart, and configure the input parameters in the popup window.
3. Customization: Press Ctrl+I to open the indicator list, select your tool, and click "Properties" to change colors, levels, or visual styles.
4. Updating: Replace the old file in the Indicators folder with the new version and restart the platform to apply changes.
Frequently Asked Questions
Q: Why is my indicator not showing? A: Verify the file is in the MQL/Indicators folder, or try right-clicking the "Indicators" tree in the Navigator and clicking "Refresh."
Q: Do custom indicators slow down the platform? A: Too many complex indicators can impact performance; remove unused ones via the "Indicator List" (Ctrl+I).
Q: Can I use MT4 indicators on MT5? A: No, MQL4 and MQL5 are distinct languages; ensure the indicator is compiled specifically for your platform version.
What this tool does
Equity/Drawdown Monitor PanelThe core idea of this panel is to provide a clear and immediate view of your account's performance, specifically focusing on equity and its drawdown from the highest point.
Typical Use Case
This Indicator excels in automated trading and technical analysis on MetaTrader 5.
Compatible Platform & Setup
This Indicator works on MetaTrader 5. Place the file in the MQL5/Indicators folder and restart the terminal.
Description & Settings
Related: Account Information Panel with Daily P/L and Equity Drawdown - another powerful indicator for MetaTrader 5 traders.
Equity/Drawdown Monitor PanelAlso recommended: Equity Drawdown Monitor: Real-Time Account Performance Tracker - similar indicator with strong performance on MetaTrader 5.
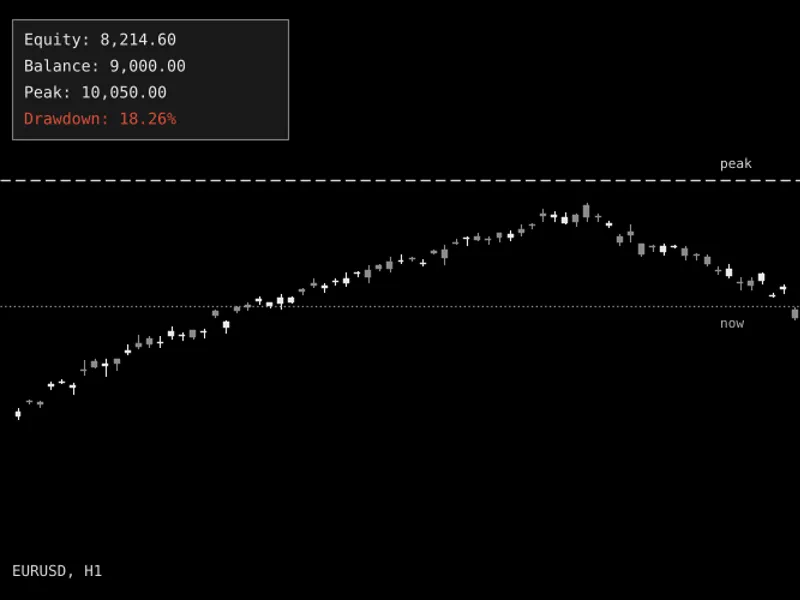
The core idea of this panel is to provide a clear and immediate view of your account's performance, specifically focusing on equity and its drawdown from the highest point. Unlike balance, which only reflects closed trades, equity includes the floating profit or loss of open positions. This panel tracks your equity's peak value in real-time and displays the current drawdown as a percentage. This crucial information is presented directly on your chart, eliminating the need to constantly check separate terminal tabs.
The panel efficiently reads account data directly, avoiding the need to process historical bar data. It optimizes performance by only redrawing when essential data changes.
Understanding the Metrics
Equity: The current total value of your account, including any unrealized profit or loss from open positions.
Balance: The value of your account based solely on closed trades, excluding any floating profit or loss.
Peak: The highest equity value recorded since the indicator was initialized or since the last daily reset, if enabled.
Drawdown: The current decrease in equity from its recorded peak, expressed as a percentage.
Visual and Alerting Features
The panel's text color changes from silver to red when the drawdown exceeds your specified threshold. This provides a quick visual warning, independent of any active alerts.
When alerts are enabled, crossing the drawdown threshold triggers a single alert and an entry in the Experts log. The alert system re-arms only after the equity recovers to a level within a defined re-arm band, preventing repeated alerts while the drawdown is at the threshold.
External Variables (Inputs)
Input Name
Default Value
Purpose
InpResetPeakDaily
false
Resets the tracked equity peak at the beginning of each trading day. If disabled (false), the peak is tracked continuously from when the indicator was attached.
InpAlertOnDrawdown
false
Enables a one-time alert when the drawdown from the peak equity crosses the InpDrawdownAlertPercent value.
InpDrawdownAlertPercent
10.0
The drawdown percentage from peak equity that triggers an alert and turns the panel text red.
InpRearmPercent
5.0
The percentage of drawdown recovery required before the alert threshold can be triggered again.
InpCorner
CORNER_LEFT_UPPER
Specifies which corner of the chart the panel will be anchored to.
InpCornerX
20
The horizontal offset in pixels from the selected chart corner.
InpCornerY
20
The vertical offset in pixels from the selected chart corner.
Recommended Usage
This indicator is designed for account-level monitoring. Since the metrics are universal across all trades, it is recommended to attach it to a single chart. It does not need to run on every symbol.
Using the default setting for InpResetPeakDaily (false) ensures that the tracked peak reflects the absolute highest equity level since the indicator was attached. Enabling daily resets would provide a per-day reading but might obscure the overall maximum drawdown from the account's all-time high.
The panel is purely a read-only reporting tool and does not place any orders or manage positions, therefore carrying no inherent risk. It functions identically on all account types.
It's important to note that the tracked peak starts from the equity level present when the indicator is first attached. For a true all-time drawdown calculation, attach the indicator as early as possible and avoid removing it.
The panel's functionality is the same on both demo and live accounts; its significance depends entirely on the account it is monitoring. As of 2026, this tool remains a valuable asset for traders.
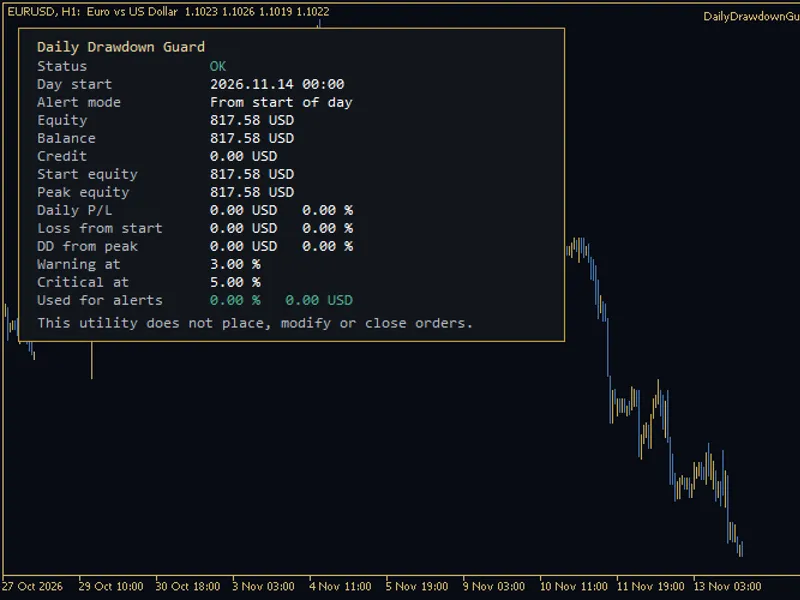
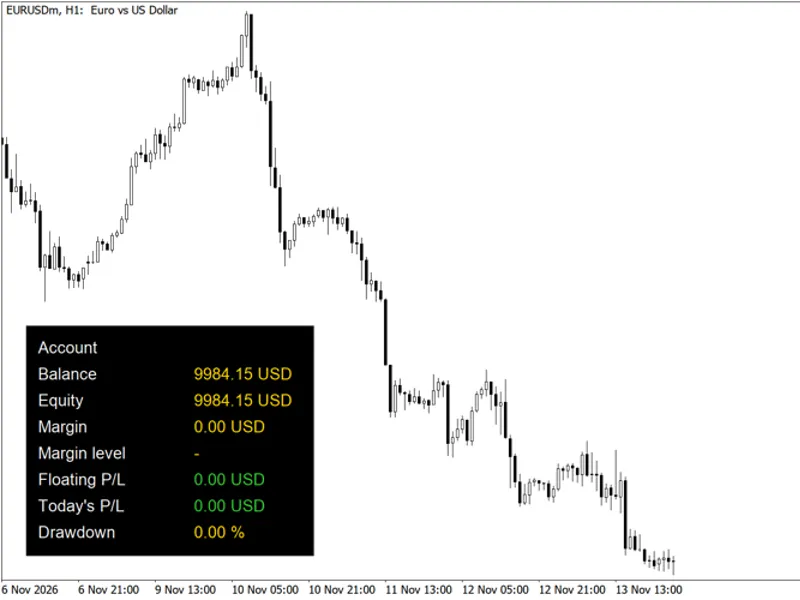
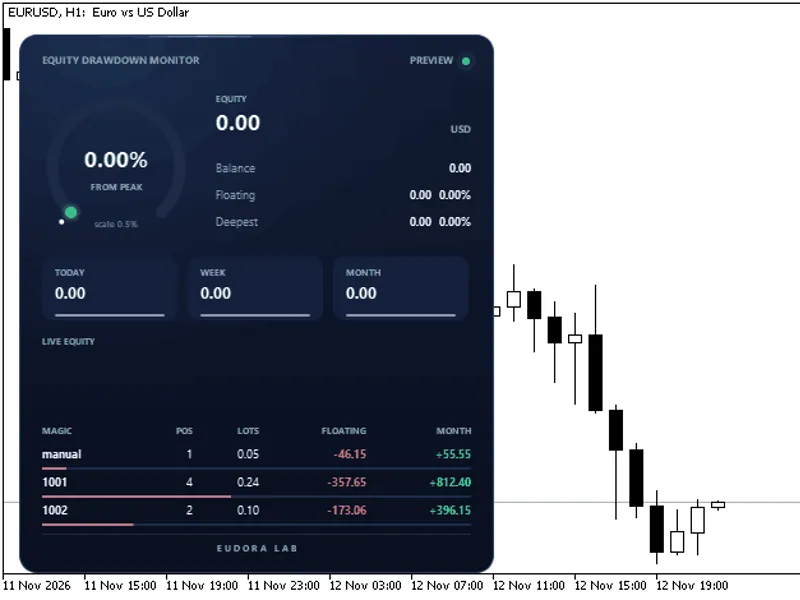
Figure 1. Equity/Drawdown Monitor Panel displayed on a chart during a drawdown period. (Note: Image may be shown in black & white for guideline purposes; on a live chart, the panel would appear red if the drawdown threshold is exceeded).
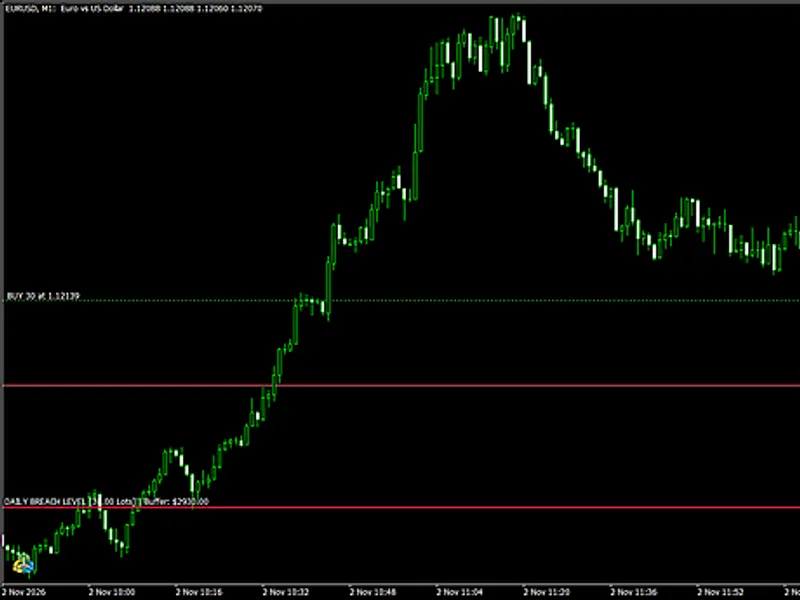
You may also like: Prop Firm Live Daily Breach Line: Accurate Drawdown Monitoring - excellent alternative for indicator users on MetaTrader 5.
Source Code
#property copyright "RobotFX"
#property link "https://robotfx.org"
#property version   "1.00"
#property description "This code is educational. Feel free to use, modify and upgrade as you wish. Visit ROBOTFX.ORG for professional trading tools"
#property indicator_chart_window
#property indicator_plots 0
input group "Tracking";
input bool InpResetPeakDaily = false;
input group "Alerts";
input bool   InpAlertOnDrawdown     = false;
.......
⚠ Limitations & Risk Warning
- This tool is provided for educational and testing purposes only.
- Past performance does not guarantee future results.
- Trading involves substantial risk of loss. Use on a demo account first.
- Results may vary depending on market conditions, broker, and settings.
- We recommend thorough backtesting and forward testing before using with real funds.