

Daily P/L by Magic Number: Performance Breakdown
Info
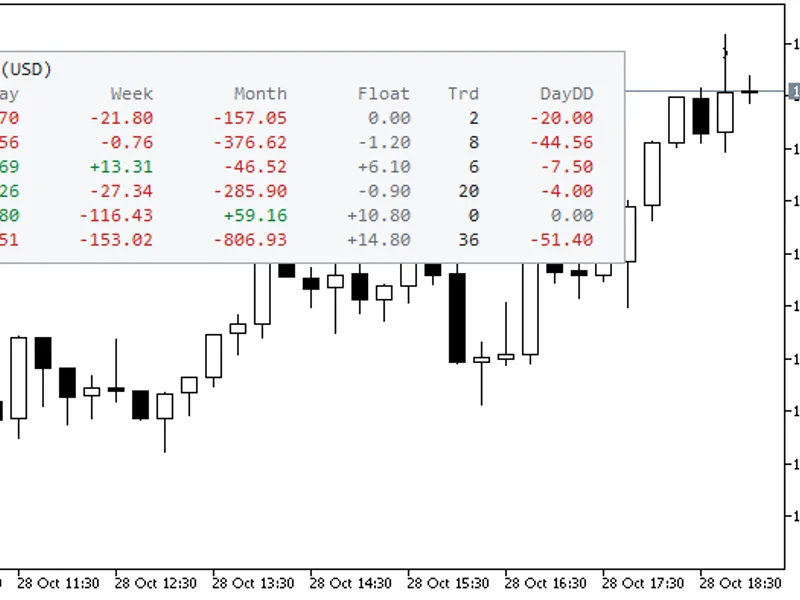
The Daily P/L by Magic Number: Performance Breakdown is a Indicator for MetaTrader 5 that what it doesdaily p/l by magic number displays account history and open positions in a concise table on your chart. Column Descriptions:StrategyThis represents the magic number assigned to a trading strategy, or a custom name you provide.
Usage
This tool is typically used for enhancing chart analysis and decision making.
Platform
This Indicator works exclusively on MetaTrader 5 (both build 600+ and newer versions).
Setup
Place the downloaded file in MQL5/Indicators folder via File ? Open Data Folder in MetaTrader 5.
How to Install and Use Daily P/L by Magic Number: Performance Breakdown
1. Installation: Place your file in the MQL/Indicators folder via "Open Data Folder" and restart your terminal.
2. Loading: Find the indicator in the Navigator, drag it onto your chart, and configure the input parameters in the popup window.
3. Customization: Press Ctrl+I to open the indicator list, select your tool, and click "Properties" to change colors, levels, or visual styles.
4. Updating: Replace the old file in the Indicators folder with the new version and restart the platform to apply changes.
Frequently Asked Questions
Q: Why is my indicator not showing? A: Verify the file is in the MQL/Indicators folder, or try right-clicking the "Indicators" tree in the Navigator and clicking "Refresh."
Q: Do custom indicators slow down the platform? A: Too many complex indicators can impact performance; remove unused ones via the "Indicator List" (Ctrl+I).
Q: Can I use MT4 indicators on MT5? A: No, MQL4 and MQL5 are distinct languages; ensure the indicator is compiled specifically for your platform version.
What this tool does
What it doesDaily P/L by Magic Number displays account history and open positions in a concise table on your chart.
Typical Use Case
This Indicator excels in automated trading and technical analysis on MetaTrader 5.
Compatible Platform & Setup
This Indicator works on MetaTrader 5. Place the file in the MQL5/Indicators folder and restart the terminal.
Description & Settings
Related: Prop Firm Live Daily Breach Line: Accurate Drawdown Monitoring - another powerful indicator for MetaTrader 5 traders.
What it doesAlso recommended: Opening Gap Tracker: Daily, Weekend Gaps with Fill Tracking and Alerts - similar indicator with strong performance on MetaTrader 5.
Daily P/L by Magic Number displays account history and open positions in a concise table on your chart.
Column Descriptions:
Strategy
This represents the magic number assigned to a trading strategy, or a custom name you provide. Manual trades are designated with magic number 0.
Today / Week / Month
This column shows the closed profit, including swaps, commissions, and fees, along with the current floating profit or loss for that strategy's open positions. This floating P/L can be optionally excluded.
Float
This displays the current floating profit or loss for all open positions associated with the strategy.
Trd
This indicates the number of trades closed within the current day.
DayDD
This represents the largest intraday drawdown experienced, calculated from the day's peak profit (including closed trades and floating P/L) while the indicator was active.
The final row, labeled TOTAL, aggregates all the displayed values. Profit is shown in green, losses in red, and zero values in grey.
Why it is useful
If you manage multiple Expert Advisors (EAs) on a single account, the standard terminal view shows a unified balance curve. This table provides a detailed breakdown of each strategy's contribution to performance, both daily and over weekly and monthly periods.
Quickly identify underperforming EAs: strategies showing a significant DayDD or an unusual loss today are immediately apparent.
Distinguish manual trades from EA-executed trades, preventing them from being mixed together.
This tool is compatible with hedging and netting accounts, any trading symbol, and any timeframe. When applied to a single chart, it provides a comprehensive overview of the entire account's performance.
How periods are defined
The Day, Week, and Month periods are based on the broker's server time. The week begins on Monday, and the month starts on the 1st day of the month.
To maintain performance, especially on accounts with extensive history, the indicator reads historical data starting from the first day of the current week or month, whichever is earlier.
The intraday drawdown calculation incorporates the closed trade data for the day and floating values sampled while the indicator is running. If the trading terminal was closed for any portion of the day, the floating P/L data for that specific period may not be fully reconstructible.
Inputs
Names : An optional list to assign custom names to magic numbers, formatted as "magic=name;magic=name". For example: 1001=Breakout;1002=Grid.
Show manual trades (magic 0) : A toggle to display or hide the row for manual trades (magic 0).
Add floating P/L to Today / Week / Month : This option is enabled by default, including floating P/L in the daily, weekly, and monthly performance figures.
Max strategy rows : Sets the maximum number of strategy rows to display.
Refresh every N seconds : Specifies the refresh interval for the indicator in seconds.
Panel corner : Determines the corner of the chart where the indicator panel will be placed.
X/Y offset : Adjusts the horizontal and vertical position of the panel.
Font size : Controls the size of the text displayed in the panel.
Dark theme : Enables or disables a dark theme for the indicator panel.
Notes
This is a read-only indicator. It does not send, modify, or close any orders. It does not utilize buffers and does not generate alerts.
The account number, account name, broker details, and balance are never displayed by this indicator.
All totals are presented in the account's currency, as indicated in the title.
Deals opened and closed by other EAs or manually on the same account are included in the calculations, as they are part of the account history.
This tool is for informational purposes only and does not constitute financial advice. It reports on past performance data.
Test in Strategy Tester
Since the indicator analyzes the deal history of the account it is attached to, you can also load it within the Strategy Tester. This allows you to review the table's functionality and appearance before deploying it on a demo or live trading account.
You may also like: ATR Monitor — Daily, Weekly, and Monthly Range - excellent alternative for indicator users on MetaTrader 5.
Source Code
#property copyright "RobotFX"
#property version   "1.00"
#property description "This code is educational. Feel free to use, modify and upgrade as you wish. Visit ROBOTFX.ORG for professional trading tools"
#property indicator_chart_window
#property indicator_plots 0
input string InpNames        = "";
input bool   InpShowManual   = true;
input bool   InpIncludeFloat = true;
input int    InpMaxRows      = 12;
input int    InpRefreshSec   = 2;
.......
⚠ Limitations & Risk Warning
- This tool is provided for educational and testing purposes only.
- Past performance does not guarantee future results.
- Trading involves substantial risk of loss. Use on a demo account first.
- Results may vary depending on market conditions, broker, and settings.
- We recommend thorough backtesting and forward testing before using with real funds.