

Trend Regime Indicator: Identify Market Trends on Every Bar
Info
The Trend Regime Indicator: Identify Market Trends on Every Bar is a Indicator for MetaTrader 5 that this indicator precisely identifies market trends: up, down, or sideways, and indicates the duration of each regime on every bar. The indicator visually represents this information directly on the price chart with distinct boxes for each distinct market regime.
Usage
This tool is typically used for trend following strategies across multiple currency pairs.
Platform
This Indicator works exclusively on MetaTrader 5 (both build 600+ and newer versions).
Setup
Place the downloaded file in MQL5/Indicators folder via File ? Open Data Folder in MetaTrader 5.
How to Install and Use Trend Regime Indicator: Identify Market Trends on Every Bar
1. Installation: Place your file in the MQL/Indicators folder via "Open Data Folder" and restart your terminal.
2. Loading: Find the indicator in the Navigator, drag it onto your chart, and configure the input parameters in the popup window.
3. Customization: Press Ctrl+I to open the indicator list, select your tool, and click "Properties" to change colors, levels, or visual styles.
4. Updating: Replace the old file in the Indicators folder with the new version and restart the platform to apply changes.
Frequently Asked Questions
Q: Why is my indicator not showing? A: Verify the file is in the MQL/Indicators folder, or try right-clicking the "Indicators" tree in the Navigator and clicking "Refresh."
Q: Do custom indicators slow down the platform? A: Too many complex indicators can impact performance; remove unused ones via the "Indicator List" (Ctrl+I).
Q: Can I use MT4 indicators on MT5? A: No, MQL4 and MQL5 are distinct languages; ensure the indicator is compiled specifically for your platform version.
What this tool does
This indicator precisely identifies market trends: up, down, or sideways, and indicates the duration of each regime on every bar.
Typical Use Case
This Indicator excels in trend following on MetaTrader 5.
Compatible Platform & Setup
This Indicator works on MetaTrader 5. Place the file in the MQL5/Indicators folder and restart the terminal.
Description & Settings
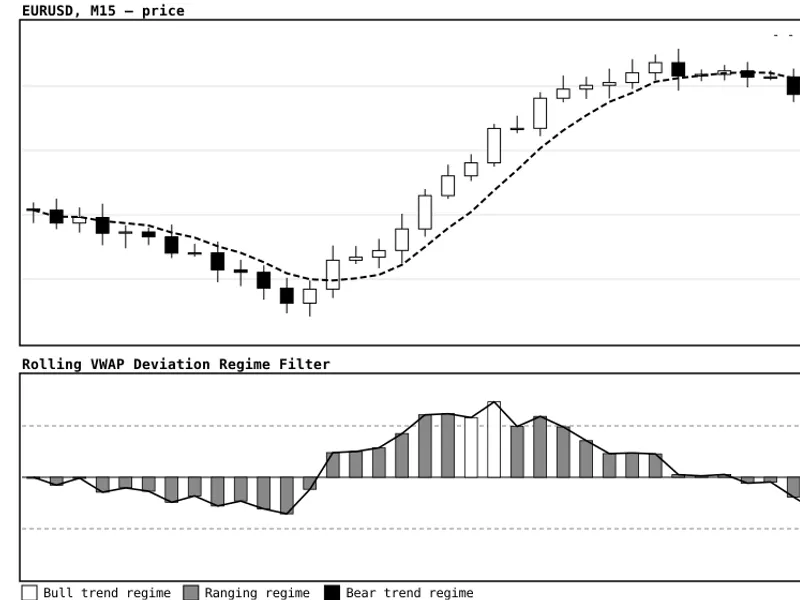
Related: Rolling VWAP Deviation Regime Filter - another powerful indicator for MetaTrader 5 traders.
This indicator precisely identifies market trends: up, down, or sideways, and indicates the duration of each regime on every bar.Also recommended: ADX Auto Range: Automated Trend Strength and Consolidation Detection - similar indicator with strong performance on MetaTrader 5.
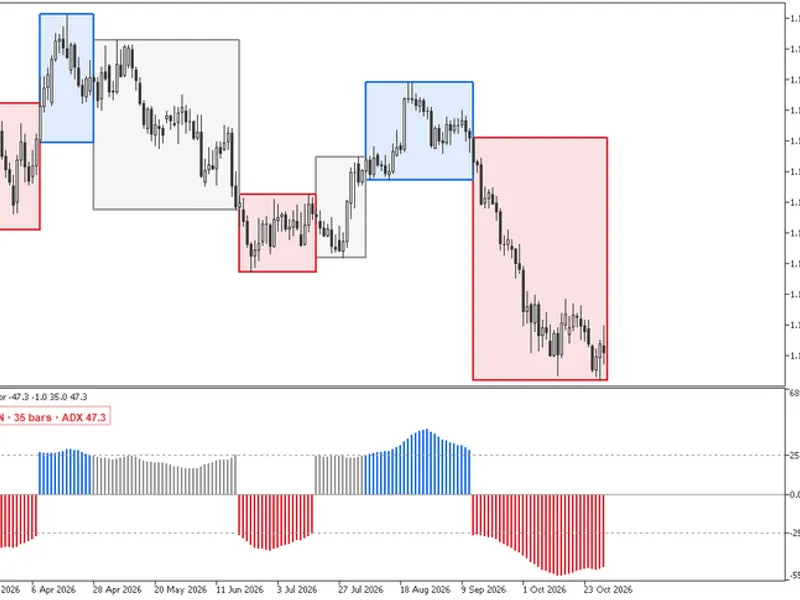
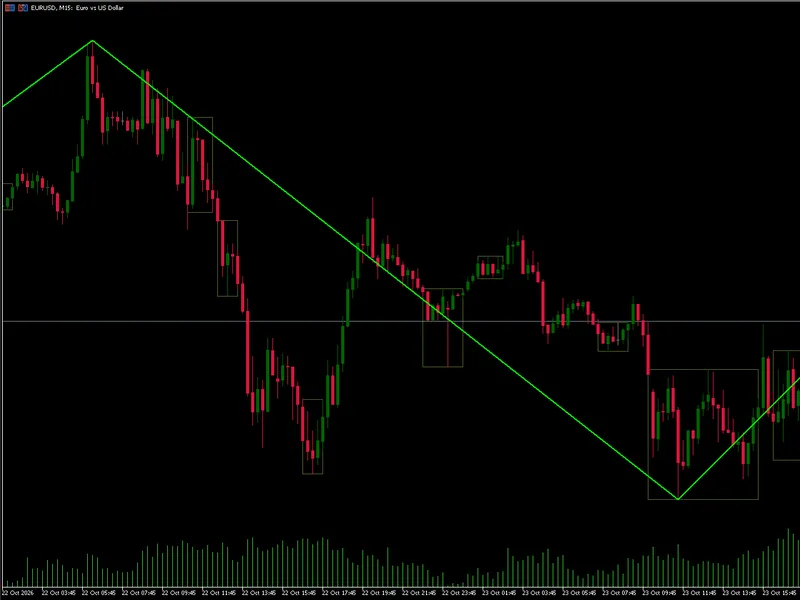
The indicator visually represents this information directly on the price chart with distinct boxes for each distinct market regime. A separate column window below the chart displays the strength of each move.Market Regime Boxes on the Price Chart
A blue box signifies an uptrend, red indicates a downtrend, and gray represents a sideways market. Each box spans from the first bar of its regime to the first bar of the next regime. The box extends from the lowest low to the highest high within that period. A solid outline in the designated color and a light fill behind the candles are used. The fill color is designed to blend seamlessly with your chart's background, ensuring readability on both light and dark themes, and adapts to your chosen color scheme.
For example, on a EURUSD daily chart, the market's movement since February can be seen as a timeline: a decline in March, a rally in April, a prolonged sideways period from late April to mid-June, another decline into July, a brief pause, a rally from August to September, and the subsequent downtrend that began in mid-September. The most recent box remains open and expands with each new bar as long as the downtrend persists.
A minimum of three bars is required for a regime to be represented by a box. Shorter fluctuations of one or two bars are still reflected in the column window, while the price chart remains uncluttered. Both the minimum bar count for a box and the types of regimes to be boxed (trends and sideways, trends only, or none) are configurable through input settings.
Strength Visualization in the Window Below
Each bar is also represented as a column in the lower window, with its height corresponding to the ADX value. Bars within an uptrend or a sideways market rise above the zero line, while trend-down bars are positioned below it. Both are displayed in their respective regime colors. Dotted lines are included at plus and minus the default ADX level of 25. An increasing trend strength is indicated by columns that progressively lengthen, while a weakening trend is shown by columns shrinking back towards the dotted line. The vertical scale dynamically adjusts to fit the visible columns and rescales as you scroll or zoom.
In the top-left corner, a single line in the regime's color displays the current regime, the number of bars it has lasted, and the ADX value. For example: TRENDING DOWN · 35 bars · ADX 47.3. The bar count starts at 1 on the bar where the regime began. In a sideways market, the line additionally indicates the reason: weak ADX or quiet ATR.
Consider a six-week period on a gold H4 chart, represented by fourteen boxes. The uptrend above 2,480 in mid-July is contained within a single blue box, followed by a red box for the subsequent decline, and another red box for the sharp drop in early August. On two occasions, the regime reversed downwards for only two bars (July 8 and August 14); these are recorded by red columns, and no box obstructs the price chart. The latest box, which is three bars old, is just long enough to be drawn. The indicator panel indicates the reason for the sideways market: RANGING · 3 bars · ADX 22.3 · weak ADX.
Regime Representation on the Generating Bar
A market regime is depicted on the bar where it was identified, encompassing that bar and preceding bars. Once closed, bars are calculated once and retain their column, values, and box. Therefore, the historical data displayed on your chart accurately reflects the indicator's readings at the close of each bar. Only the current, in-progress bar is recalculated on a tick-by-tick basis, using a copy of the confirmed state.
Default Settings Based on Empirical Measurement
The default settings were determined through extensive testing, not arbitrary choices. Hundreds of combinations of periods, ADX levels, ATR filters, and smoothing were evaluated using over ten years of H1 and H4 historical data for gold, EURUSD, and a US stock index. Each combination was scored based on the earliness of new regime detection and the frequency of regime flips. The optimal settings, which emerged from this analysis, are the defaults: an ADX and DI period of 14, an ADX level of 25, the ATR filter disabled, and a smoothing factor of 1, ensuring each bar's reading is considered independently.
The ATR filter can be enabled via an input setting. By specifying an ATR average period, bars with an ATR value at or below that average are also classified as sideways, providing a more stringent definition of quiet markets. The smoothing option can be increased up to 5 bars, averaging recent readings for a more stable visualization.
Integration with Expert Advisors and Alerts
Four values per bar are available in the Data Window and can be accessed programmatically using iCustom and CopyBuffer functions. Buffer 2 provides the regime identification: 1 for trend up, 0 for sideways, and -1 for trend down. Buffer 3 indicates the duration of the current regime in bars, buffer 4 shows the ADX value, and buffer 0 represents the column's value (ADX for uptrend and sideways markets, -ADX for downtrend). Buffer 1 holds the color index (0 for up, 1 for sideways, 2 for down). The indicator window's title line displays these numerical values, for instance: -47.3, -1.0, 35.0, and 47.3 on the EURUSD chart. Using a shift of 1 provides data for the last closed bar.
These numerical outputs enable an Expert Advisor to execute trades exclusively within the prevailing trend, wait for a trend to persist for a specified duration, or remain inactive during sideways market conditions. The optional alert system triggers a single notification when a closed bar initiates a new regime. This alert includes the symbol, timeframe, the new regime type, the duration of the previous regime, and its ADX value. Attaching the indicator to a chart does not activate the alert.
Input Parameters
Fourteen configurable settings are organized into four groups. Setting any of the ADX level, ATR filter, or share line parameters to zero effectively disables them.
Trend Settings:
- ADX and DI period: Adjustable from 1 to 50 (default: 14).
- ADX level for trend identification: Default is 25.
Volatility Settings:
- ATR period: Default is 14.
- ATR average period: Set to 0 to disable the filter (default: 0).
- ATR average type: Choose between simple or exponential smoothing (default: simple).
Display Settings:
- Regime smoothing: Adjustable from 1 to 5 bars (default: 1).
- Price chart boxes display: Options include none, trends only, or trends and sideways (default: trends and sideways).
- Bars back for boxes: Maximum historical bars to display boxes for (default: 300).
- Shortest stretch for a box: Minimum duration in bars required for a regime to be boxed (default: 3).
- Regime shares over N bars: Displays the proportion of trend-up, sideways, and trend-down bars over a specified number of bars in a second panel line (default: 0, hidden).
- Colors: Customizable colors for trend up (default: blue), sideways (default: gray), and trend down (default: red), used for columns, boxes, and the panel.
Alert Settings:
- Alert on regime change: Set to true to enable alerts (default: false).
This indicator is compatible with any symbol and timeframe. The columns are displayed in a separate indicator window, the boxes appear on the price chart, and all elements are removed when the indicator is detached from the chart.
Educational content, not financial advice. Trading involves risk of loss. Copyright 2026.
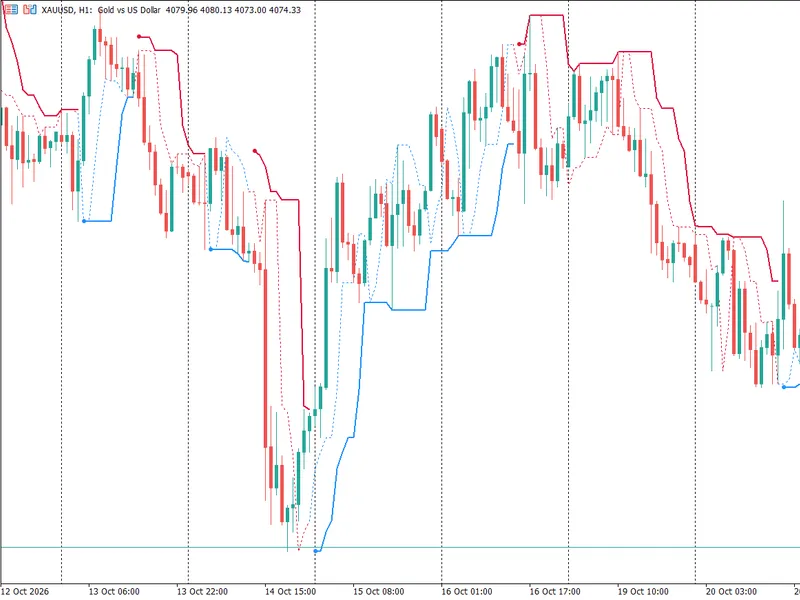
You may also like: Line Master: Advanced Trend Lines with Change Signals - excellent alternative for indicator users on MetaTrader 5.
Source Code
#property copyright "RobotFX"
#property link "https://robotfx.org"
#property version   "1.06"
#property description "This code is educational. Feel free to use, modify and upgrade as you wish. Visit ROBOTFX.ORG for professional trading tools"
#property indicator_separate_window
#property indicator_buffers 5
#property indicator_plots   4
#property indicator_type1   DRAW_COLOR_HISTOGRAM
#property indicator_label1  "Regime column"
#property indicator_type2   DRAW_NONE
.......
⚠ Limitations & Risk Warning
- This tool is provided for educational and testing purposes only.
- Past performance does not guarantee future results.
- Trading involves substantial risk of loss. Use on a demo account first.
- Results may vary depending on market conditions, broker, and settings.
- We recommend thorough backtesting and forward testing before using with real funds.