
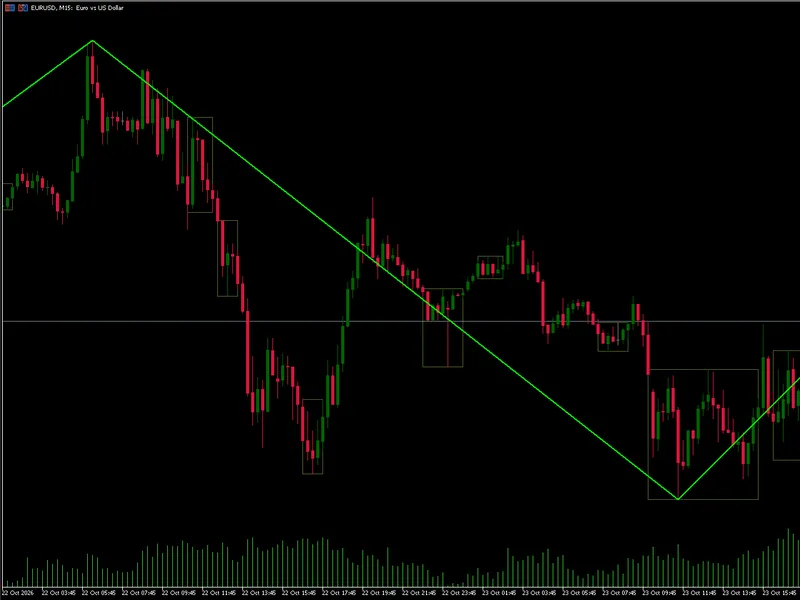
Exponential Trend Channel Indicator for MT5
Info
The Exponential Trend Channel Indicator for MT5 is a Indicator for MetaTrader 5 that the price scale in metatrader 5 is linear. On a linear scale, a trend that grows by a steady percentage does not appear as a straight line.
Usage
This tool is typically used for trend following strategies across multiple currency pairs.
Platform
This Indicator works exclusively on MetaTrader 5 (both build 600+ and newer versions).
Setup
Place the downloaded file in MQL5/Indicators folder via File ? Open Data Folder in MetaTrader 5.
How to Install and Use Exponential Trend Channel Indicator for MT5
1. Installation: Place your file in the MQL/Indicators folder via "Open Data Folder" and restart your terminal.
2. Loading: Find the indicator in the Navigator, drag it onto your chart, and configure the input parameters in the popup window.
3. Customization: Press Ctrl+I to open the indicator list, select your tool, and click "Properties" to change colors, levels, or visual styles.
4. Updating: Replace the old file in the Indicators folder with the new version and restart the platform to apply changes.
Frequently Asked Questions
Q: Why is my indicator not showing? A: Verify the file is in the MQL/Indicators folder, or try right-clicking the "Indicators" tree in the Navigator and clicking "Refresh."
Q: Do custom indicators slow down the platform? A: Too many complex indicators can impact performance; remove unused ones via the "Indicator List" (Ctrl+I).
Q: Can I use MT4 indicators on MT5? A: No, MQL4 and MQL5 are distinct languages; ensure the indicator is compiled specifically for your platform version.
What this tool does
The price scale in MetaTrader 5 is linear.
Typical Use Case
This Indicator excels in trend following on MetaTrader 5.
Compatible Platform & Setup
This Indicator works on MetaTrader 5. Place the file in the MQL5/Indicators folder and restart the terminal.
Description & Settings
Related: MTF Trend Matrix: Your Watchlist Trend Overview - another powerful indicator for MetaTrader 5 traders.
The price scale in MetaTrader 5 is linear. On a linear scale, a trend that grows by a steady percentage does not appear as a straight line. Instead, it bends upwards when rising and flattens when falling. A straight channel drawn over such a trend would be positioned too high in the middle and too low at the ends. This indicator addresses this by fitting the trend to the logarithm of price, where steady growth is represented as a straight line. It then redraws this trend on your chart as its actual curve, bar by bar. It includes zones, a projection, and a card displaying the trend's clarity and speed.Also recommended: Trend Regime Indicator: Identify Market Trends on Every Bar - similar indicator with strong performance on MetaTrader 5.
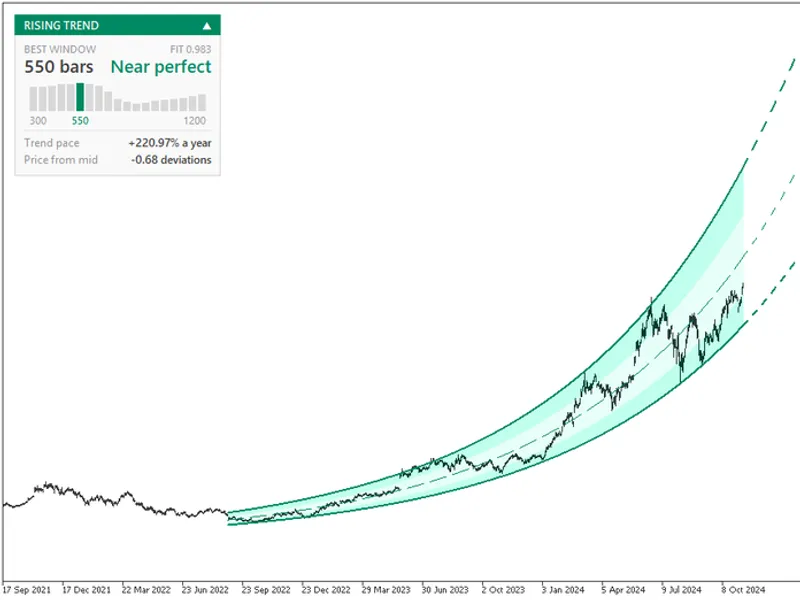
Consider NVDA on the daily chart from late August 2022 to early November 2026. The indicator analyzed its long windows and selected a 550-bar window with a fit of 0.983, grading it as Near Perfect. The trend's pace was calculated at +220.97% per year. Within this window, the midline increased from 12.73 to 162.71, a nearly thirteenfold rise, with only 14 out of 550 daily closes falling outside the channel edges.
A Curve Where a Straight Line Would Miss
At the halfway point of that window, in October 2023, the fitted trend was near 45, and the upper edge was just under 60. If a straight line were drawn connecting the two endpoints of the midline, it would pass near 88 on the same day, above the entire channel and far from the price candles. This illustrates the difference between a straight channel and the actual curve on a linear chart. This discrepancy widens as the price range within the window increases.
The channel edges follow the same principle. Each edge is positioned a fixed number of standard deviations from the midline in logarithmic terms. Consequently, the channel widens in price terms as the trend ascends and narrows as it descends, always maintaining the same percentage distance from the middle. A price swing of $5 near a price of $15 is considered equivalent to a $50 swing near a price of $150.
It Selects the Optimal Window Automatically
There is no manual tuning required for the look-back period. On each completed bar, the indicator evaluates 19 look-back windows, ranging from 20 to 200 bars in increments of 10, or from 300 to 1200 bars in increments of 50 when the long setting is active. It then selects the window where the logarithmic prices align most closely with a straight trend, as measured by correlation. In cases of a tie, the shorter window is chosen. Windows that exceed the available chart history or contain prices at or below zero are excluded from the analysis.
The Card: Trend Clarity, Speed, and Price Position
A colored band indicates the trend direction, either RISING TREND or FALLING TREND, and the entire indicator drawing adopts this color. Below this, two prominent figures display the winning window's length and its correlation grade, one of 13 levels from Negligible to Near Perfect, with the exact correlation value shown just above.
Beneath these figures, 19 small columns illustrate the correlation for each analyzed window. The winning window is highlighted, with its length indicated below. This visual representation offers more insight than a single number: a single tall column signifies a dominant trend horizon, while a broad plateau suggests a consistent trend across multiple timeframes.
Trend pace converts the slope into growth per unit of calendar time. This is measured using the actual time elapsed within the window, accounting for weekends, trading session breaks, and missing bars by clock time, not just bar count. It displays daily growth for windows under 20 days, monthly growth for windows up to a year, and annual growth for longer periods, regardless of the chart's timeframe. The 'Price from mid' metric shows the live price's distance from the midline in standard deviations. For instance, on the NVDA chart, it might show -0.68, indicating the price is slightly below the channel's midpoint.
Zones and Projection
The channel is divided into zones. The area within one standard deviation of the midline is shown in a lighter shade. As the distance from the midline increases towards the channel edges, the color intensity grows. This allows for a quick assessment of whether the price is trading within the core trend area or has moved towards an edge.
The channel edges are solid lines, the midline is dashed, and these dashes extend forward from the current bar along the same curve for approximately one-fifth of the window's length (between 6 and 60 bars). The length of these projection dashes adjusts with the chart zoom level, ensuring the projection remains consistent at any scale.
Rising trends are depicted in teal green, and falling trends in raspberry. These colors are customizable inputs. The zones are displayed behind the price candles, and their color tint adapts to the background color of your chart, ensuring readability on both white and dark backgrounds. Changes to the background color automatically adjust the zones and the card's colors.
Real-time Updates While the Bar Forms
Only completed bars are used for fitting the trend channel. The channel, selected window, and trend pace remain static while a bar is forming and are updated only once, upon its closure. In the interim, the live price is measured against this fixed channel. Consequently, the position indicated on the card and within the data buffer fluctuates with every price tick, even though the channel itself remains unchanged.
For Expert Advisors
Six values are available in the Data Window and can be accessed using iCustom and CopyBuffer functions. Buffer 6 represents the upper channel edge, buffer 7 the midline, buffer 8 the lower edge, and buffer 9 the price's position in standard deviations. These are available for every bar within the window and for the bar currently forming. Buffer 10 provides the length of the best-fit window, and buffer 11 the signed correlation (negative for a falling trend). These values are updated for the newest closed bar and the bar in progress. Using a shift of 0 retrieves the live position, while a shift of 1 provides data for the last closed bar.
With this data, an Expert Advisor can be programmed to trade only when the correlation fit exceeds a specified level, identify entry opportunities as the price approaches an edge in the trend's direction, or remain inactive if the best-fit window length fluctuates frequently.
Inputs
Six settings are organized into two groups.
Channel:
- Price source for fitting: close (default), open, high, low, median, typical, or weighted.
- Windows to search: short (20 to 200 bars) or long (300 to 1200 bars).
- Channel width in standard deviations (default 2.0): any value greater than zero.
Look:
- Rising trend color.
- Falling trend color.
- Fit card position: choose from any of the four corners or disable (default bottom left).
This indicator operates on any symbol and timeframe. Removing the indicator will also remove all graphical elements it has drawn on the chart.
Educational content. Trading involves risk of loss.
You may also like: ADX Auto Range: Automated Trend Strength and Consolidation Detection - excellent alternative for indicator users on MetaTrader 5.
Source Code
#property copyright "RobotFX"
#property link "https://robotfx.org"
#property version   "1.06"
#property description "This code is educational. Feel free to use, modify and upgrade as you wish. Visit ROBOTFX.ORG for professional trading tools"
#property indicator_chart_window
#property indicator_buffers 12
#property indicator_plots   9
#property indicator_type1   DRAW_FILLING
#property indicator_type2   DRAW_FILLING
#property indicator_type3   DRAW_FILLING
.......
⚠ Limitations & Risk Warning
- This tool is provided for educational and testing purposes only.
- Past performance does not guarantee future results.
- Trading involves substantial risk of loss. Use on a demo account first.
- Results may vary depending on market conditions, broker, and settings.
- We recommend thorough backtesting and forward testing before using with real funds.