







Draw On Liquidity and Kill Zones Indicator
Info
The Draw On Liquidity and Kill Zones Indicator is a Indicator for MetaTrader 5 that automated identification of liquidity levels and high-probability trading sessions. Price often gravitates towards liquidity levels.
Usage
This tool is typically used for enhancing chart analysis and decision making.
Platform
This Indicator works exclusively on MetaTrader 5 (both build 600+ and newer versions).
Setup
Place the downloaded file in MQL5/Indicators folder via File ? Open Data Folder in MetaTrader 5.
How to Install and Use Draw On Liquidity and Kill Zones Indicator
1. Installation: Place your file in the MQL/Indicators folder via "Open Data Folder" and restart your terminal.
2. Loading: Find the indicator in the Navigator, drag it onto your chart, and configure the input parameters in the popup window.
3. Customization: Press Ctrl+I to open the indicator list, select your tool, and click "Properties" to change colors, levels, or visual styles.
4. Updating: Replace the old file in the Indicators folder with the new version and restart the platform to apply changes.
Frequently Asked Questions
Q: Why is my indicator not showing? A: Verify the file is in the MQL/Indicators folder, or try right-clicking the "Indicators" tree in the Navigator and clicking "Refresh."
Q: Do custom indicators slow down the platform? A: Too many complex indicators can impact performance; remove unused ones via the "Indicator List" (Ctrl+I).
Q: Can I use MT4 indicators on MT5? A: No, MQL4 and MQL5 are distinct languages; ensure the indicator is compiled specifically for your platform version.
What this tool does
Automated identification of liquidity levels and high-probability trading sessions.
Typical Use Case
This Indicator excels in automated trading and technical analysis on MetaTrader 5.
Compatible Platform & Setup
This Indicator works on MetaTrader 5. Place the file in the MQL5/Indicators folder and restart the terminal.
Description & Settings
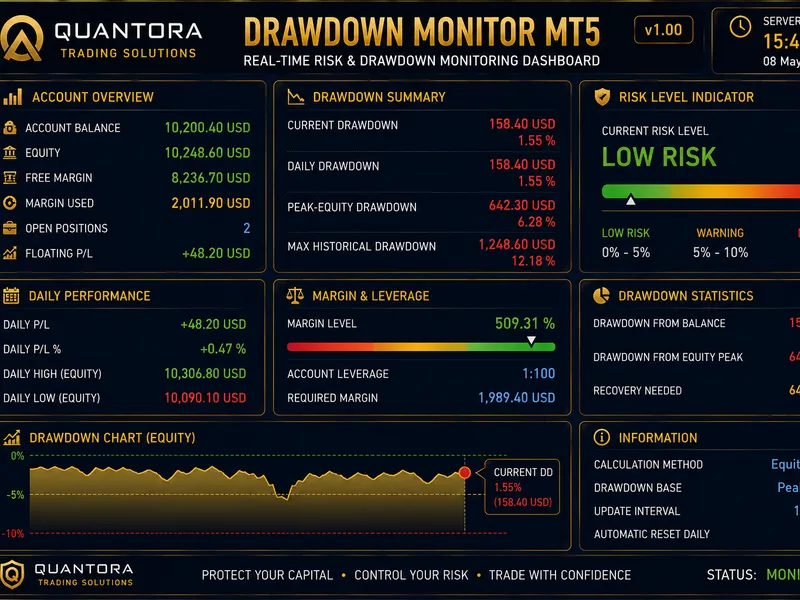
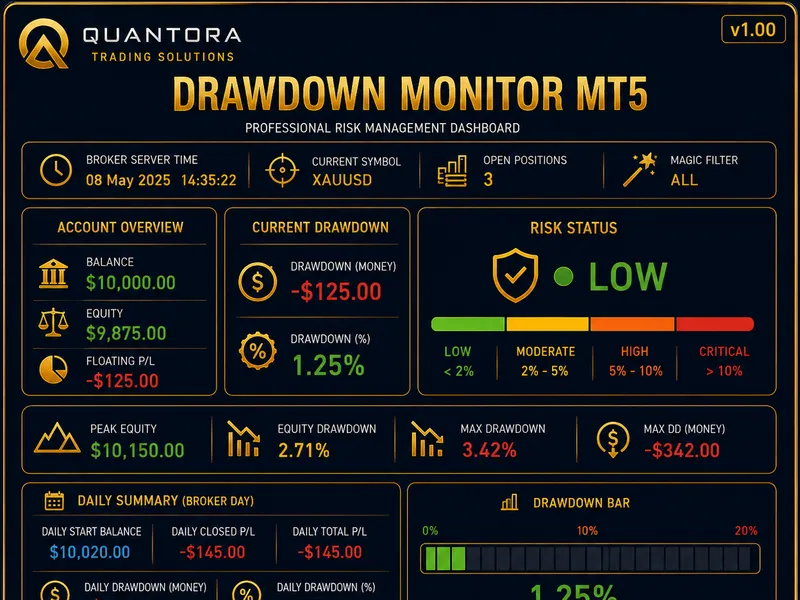
Related: Quantora Drawdown Monitor MT5: Professional Account Risk and Drawdown Dashboard - another powerful indicator for MetaTrader 5 traders.
Automated identification of liquidity levels and high-probability trading sessions.Also recommended: Quantora Drawdown Monitor MT5 - Professional Account Risk and Equity Drawdown Monitor - similar indicator with strong performance on MetaTrader 5.
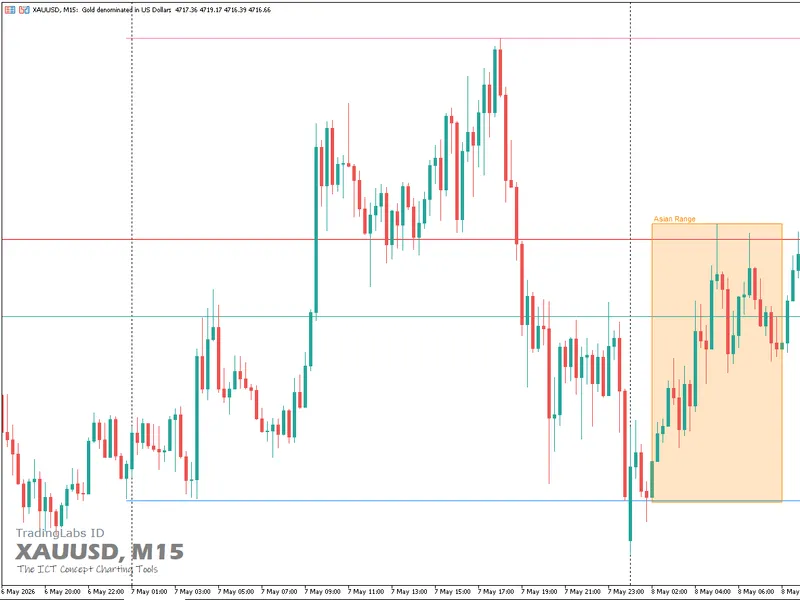
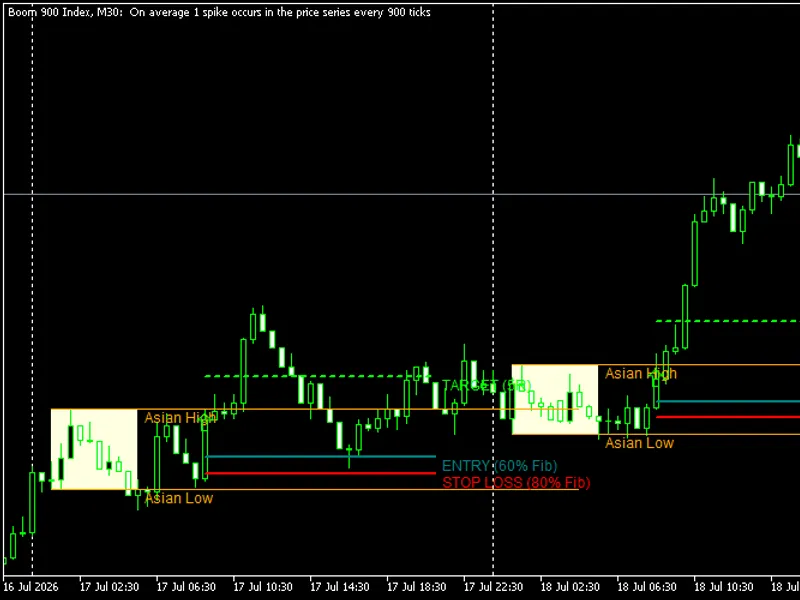
Price often gravitates towards liquidity levels. Key reference points such as the previous day's high and low (PDHL) and the previous week's high and low (PWHL) are crucial areas where stop orders and institutional trading activities tend to concentrate. Manually identifying these levels can be inefficient and error-prone.
The Draw On Liquidity (DOL) indicator automatically plots these vital levels on your chart. It also highlights high-probability trading windows using session kill zones. With comprehensive customization options, this indicator offers a clear, professional, and informative display to improve your trading decisions.
Key Features :
Automatic PDHL & PWHL Plotting – Displays the previous day's and week's highs/lows accurately and instantly.
Liquidity Zone Visualization – Clearly identifies areas where price is likely to target liquidity pools.
Session Kill Zones – Marks the Tokyo, London, and New York sessions with adjustable times, allowing focus on the most active trading periods.
Fully Customizable – Modify colors, line styles, thickness, and labels to suit your chart preferences.
Clean & User-Friendly Interface – All settings are logically organized for quick configuration without cluttering the chart.
Benefits for Your Trading :
Save valuable time by eliminating manual line drawing.
Anticipate potential price movements around significant liquidity zones.
Concentrate on the most pertinent trading sessions for opportunities.
Maintain a professional and organized trading chart.
Adjustable Parameters :
Option to show or hide Previous Daily & Weekly High/Low.
Adjustable line styles, widths, and colors.
Customizable text labels (color & size).
Session markers with configurable start and end times for Tokyo, London, and New York sessions.
Number of past sessions to display.
You may also like: Session-Based Liquidity Breakout Strategy - excellent alternative for indicator users on MetaTrader 5.
Source Code
#property copyright "RobotFX"
#property link "https://robotfx.org"
#property version   "2.5"
#property description "This code is educational. Feel free to use, modify and upgrade as you wish. Visit ROBOTFX.ORG for professional trading tools"
#property indicator_chart_window
#property indicator_buffers 0
#property indicator_plots   0
input group "Charting Tools Information"
input string  Tools                  = "Draw On Liquidity ( DOL )";
input string  Company                = "Copyright @ 2025 - TradingLabs ID";
.......
⚠ Limitations & Risk Warning
- This tool is provided for educational and testing purposes only.
- Past performance does not guarantee future results.
- Trading involves substantial risk of loss. Use on a demo account first.
- Results may vary depending on market conditions, broker, and settings.
- We recommend thorough backtesting and forward testing before using with real funds.