
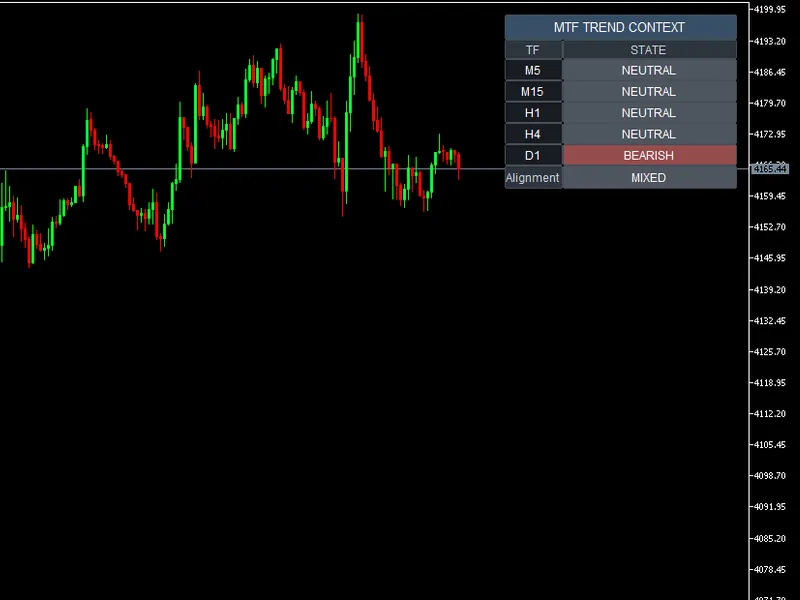
Arixis Market Regime Map: Trend, Range, and Volatility Classifier
Info
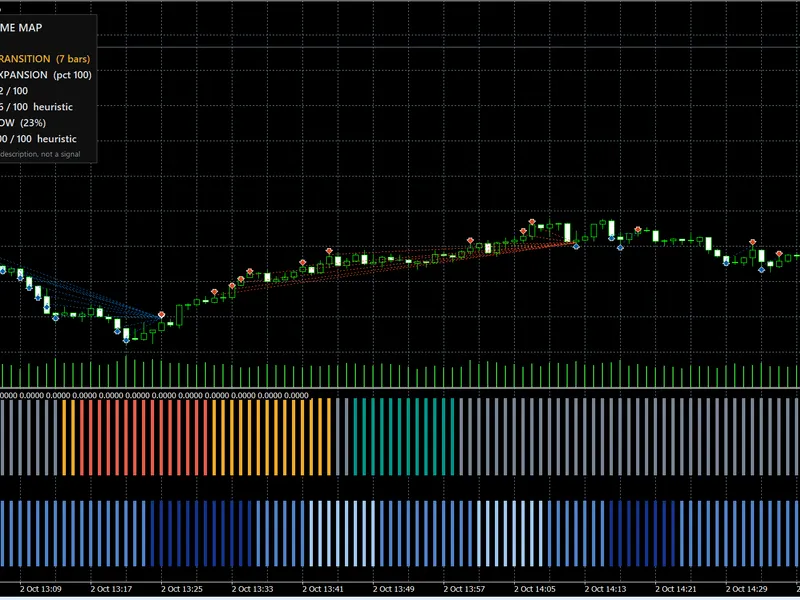
The Arixis Market Regime Map: Trend, Range, and Volatility Classifier is a Indicator for MetaTrader 5 that arixis market regime map is a market-state classification indicator for metatrader 5 designed to answer a simple but important question:what type of market am i trading right now. Instead of generating Buy or Sell signals, the indicator analyzes price behavior and classifies the current market into four primary regimes:TREND UPTREND DOWNRANGETRANSITIONThe classification is based on a combination of quantitative measurements including price efficiency, normalized directional slope, volatility, market structure, and agreement across multiple analysis horizons.
Usage
This tool is typically used for trend following strategies across multiple currency pairs.
Platform
This Indicator works exclusively on MetaTrader 5 (both build 600+ and newer versions).
Setup
Place the downloaded file in MQL5/Indicators folder via File ? Open Data Folder in MetaTrader 5.
How to Install and Use Arixis Market Regime Map: Trend, Range, and Volatility Classifier
1. Installation: Place your file in the MQL/Indicators folder via "Open Data Folder" and restart your terminal.
2. Loading: Find the indicator in the Navigator, drag it onto your chart, and configure the input parameters in the popup window.
3. Customization: Press Ctrl+I to open the indicator list, select your tool, and click "Properties" to change colors, levels, or visual styles.
4. Updating: Replace the old file in the Indicators folder with the new version and restart the platform to apply changes.
Frequently Asked Questions
Q: Why is my indicator not showing? A: Verify the file is in the MQL/Indicators folder, or try right-clicking the "Indicators" tree in the Navigator and clicking "Refresh."
Q: Do custom indicators slow down the platform? A: Too many complex indicators can impact performance; remove unused ones via the "Indicator List" (Ctrl+I).
Q: Can I use MT4 indicators on MT5? A: No, MQL4 and MQL5 are distinct languages; ensure the indicator is compiled specifically for your platform version.
What this tool does
Arixis Market Regime Map is a market-state classification indicator for MetaTrader 5 designed to answer a simple but important question:What type of market am I trading right now.
Typical Use Case
This Indicator excels in trend following on MetaTrader 5.
Compatible Platform & Setup
This Indicator works on MetaTrader 5. Place the file in the MQL5/Indicators folder and restart the terminal.
Description & Settings
Related: Extreme Price Filter: Identify and Avoid Market Traps - another powerful indicator for MetaTrader 5 traders.
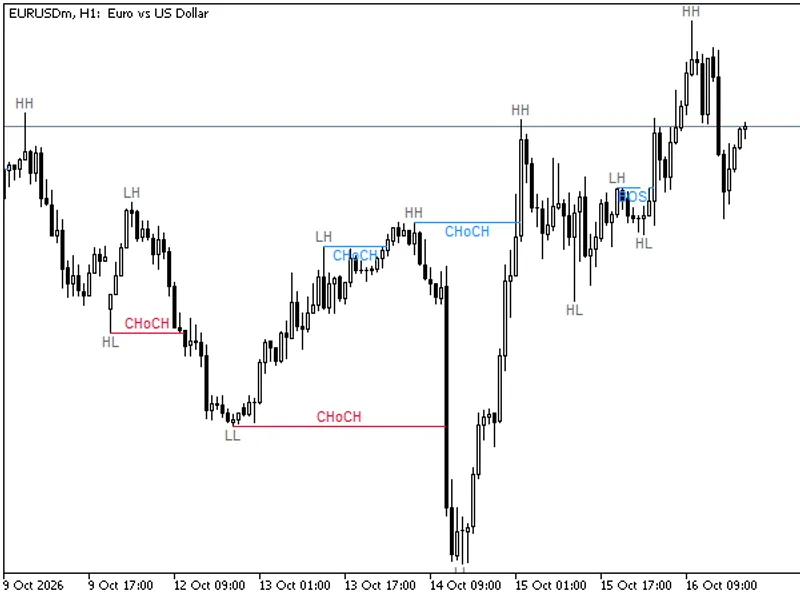
Arixis Market Regime Map is a market-state classification indicator for MetaTrader 5 designed to answer a simple but important question:Also recommended: Market Structure BOS and CHoCH Indicator: Swing Points, No Repaint, Alerts - similar indicator with strong performance on MetaTrader 5.
What type of market am I trading right now?
Instead of generating Buy or Sell signals, the indicator analyzes price behavior and classifies the current market into four primary regimes:
TREND UP
TREND DOWN
RANGE
TRANSITION
The classification is based on a combination of quantitative measurements including price efficiency, normalized directional slope, volatility, market structure, and agreement across multiple analysis horizons.
One of the core measurements is the Efficiency Ratio, which compares the net displacement of price with the total distance traveled during the same period. This helps distinguish directional movement from noisy or ranging price action.
Arixis Market Regime Map combines this information with directional and structural measurements to produce a transparent assessment of the current market regime.
Main features
Automatic classification of Trend Up, Trend Down, Range, and Transition
Non-repainting / causal calculations based on information available at the evaluated bar
Multi-horizon market analysis
Price Efficiency measurement
Normalized Direction Score
Market Structure analysis
Regime Strength measurement
Historical regime visualization
Hysteresis logic to reduce unnecessary regime switching
Works with different symbols and timeframes
Lightweight and designed for real-time use
Regime Strength
The indicator also calculates a Regime Strength value representing how strongly the available quantitative evidence supports the detected market state.
Regime Strength is not a probability of future price movement and should not be interpreted as a prediction that price will rise or fall.
Designed for analysis, not prediction
Arixis Market Regime Map does not attempt to predict the next candle or guarantee future market direction.
Its purpose is to provide a structured and quantitative description of the current market environment.
This can be useful for:
- discretionary traders
- algorithmic traders
- Expert Advisor developers
- strategy research
- regime filtering
- identifying transitions between trending and ranging conditions
- understanding when the behavior of a strategy changes across different market environments
For example, a trend-following system may behave differently during a RANGE regime, while a mean-reversion strategy may react differently during strong directional expansion.
Transparent quantitative approach
The indicator is built around interpretable mathematical measurements rather than opaque Buy/Sell signals.
The objective is not to tell the trader what trade to take, but to provide a clearer representation of the market structure in which a trading decision or algorithm is operating.
Arixis Market Regime Map — Understand the market environment before evaluating the strategy.
You may also like: MTF Trend Context - Professional Market Analysis Tool - excellent alternative for indicator users on MetaTrader 5.
Source Code
#property copyright "RobotFX"
#property version     "1.00"
#property description "This code is educational. Feel free to use, modify and upgrade as you wish. Visit ROBOTFX.ORG for professional trading tools"
#property indicator_separate_window
#property indicator_minimum 0.0
#property indicator_maximum 1.0
#property indicator_height  46
#property indicator_buffers 23
#property indicator_plots   14
#property indicator_type13  DRAW_COLOR_HISTOGRAM2
.......
⚠ Limitations & Risk Warning
- This tool is provided for educational and testing purposes only.
- Past performance does not guarantee future results.
- Trading involves substantial risk of loss. Use on a demo account first.
- Results may vary depending on market conditions, broker, and settings.
- We recommend thorough backtesting and forward testing before using with real funds.