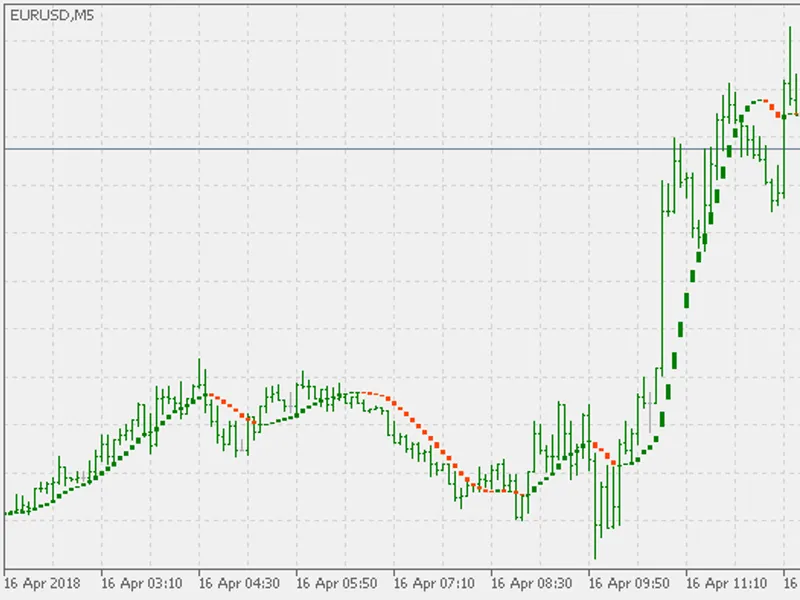
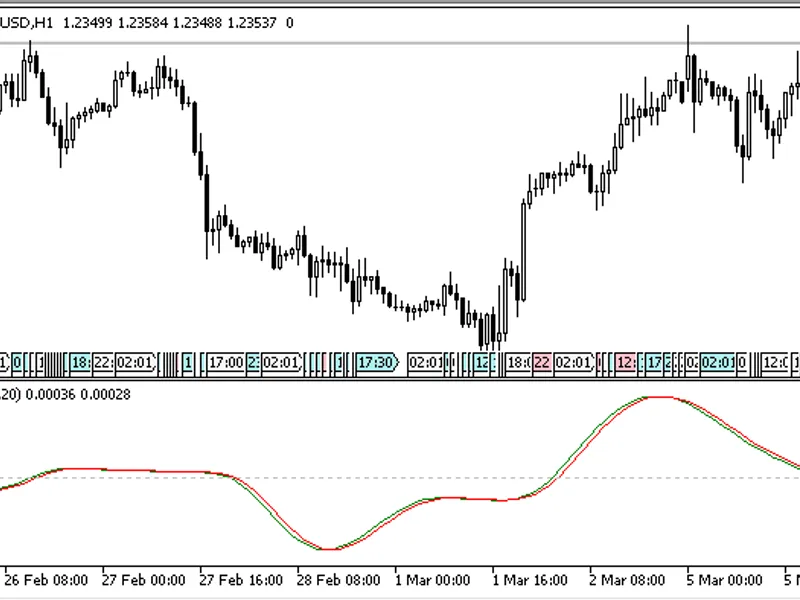
"sadukey" indicator is an indicator combining two digital filters on a chart to give us an assessment of current trend.unfortunately the exact nature of the digital filter is unkno...
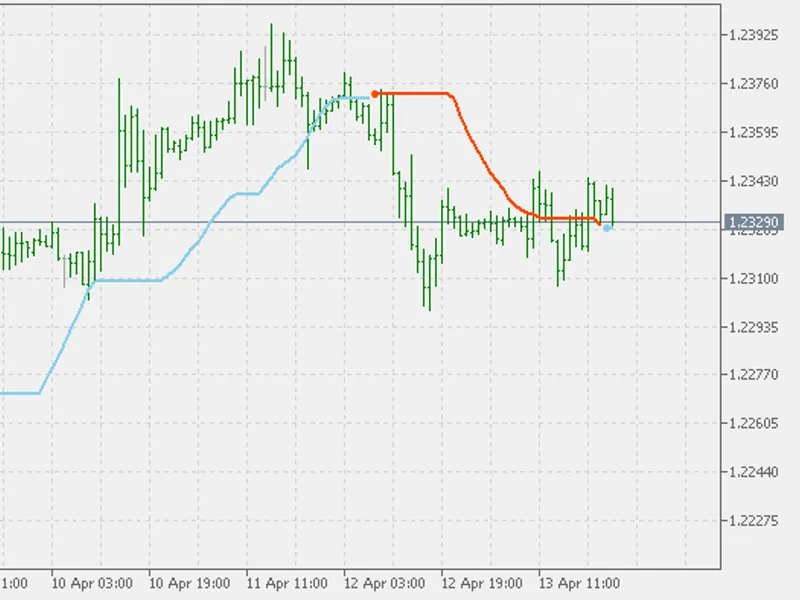
momentum is usually used for trend or price change direction assessment.this indicator changes that in some way. the stops are calculated using the smoother momentum and the direct...
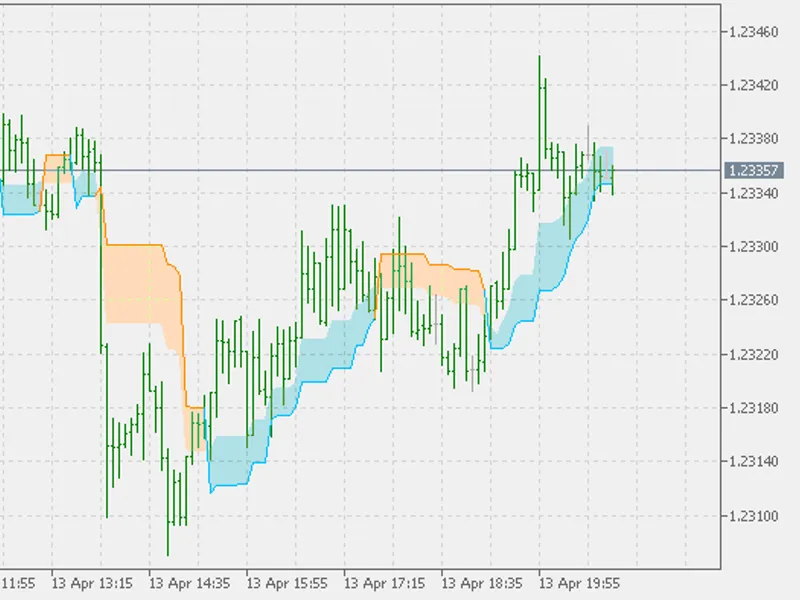
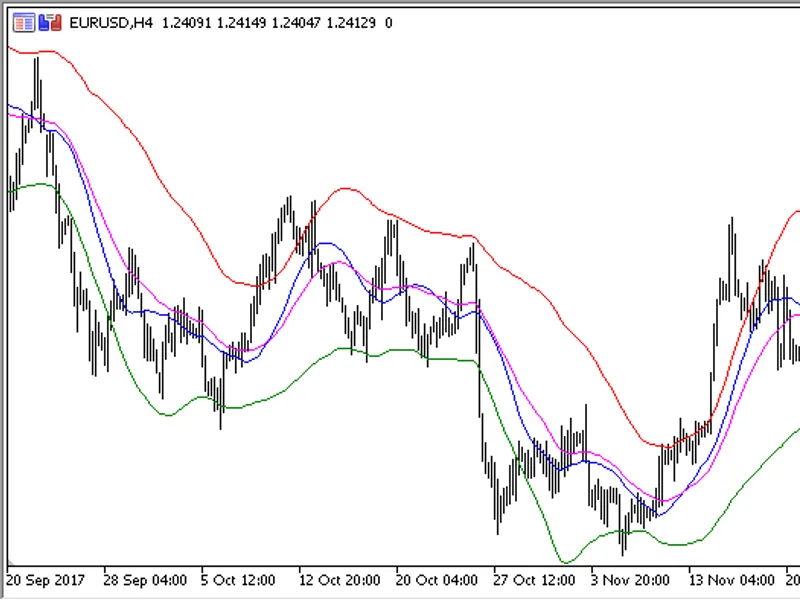
a new variation of a well known price channel indicator.the indicator shows the current estimated trend based on channel period and desired risk. it also shows two levels of values...
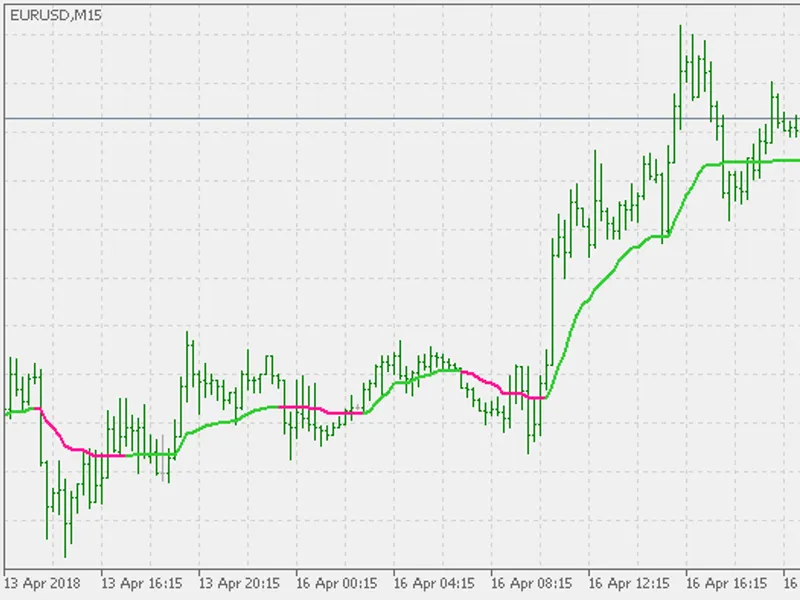
adaptive moving average (ama) technical indicator is used for constructing a moving average with low sensitivity to price series' noises and is characterized by the minimal lag for...
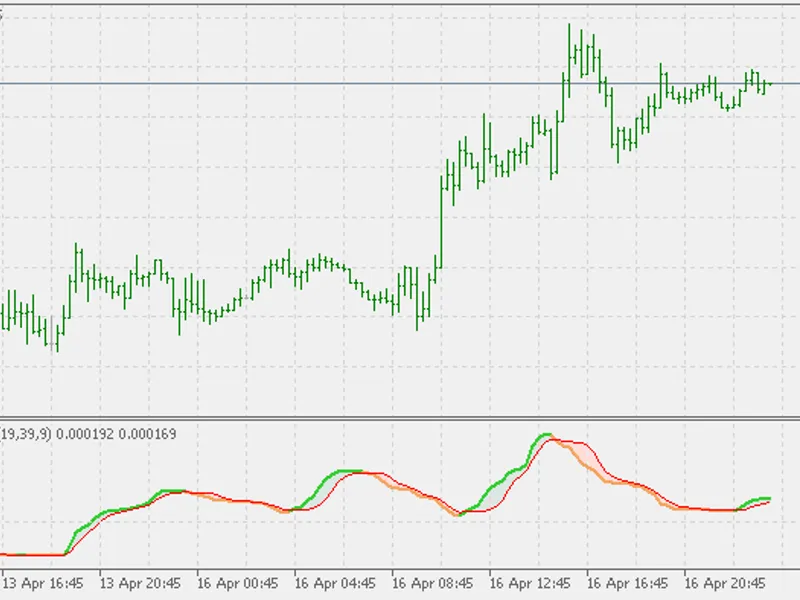
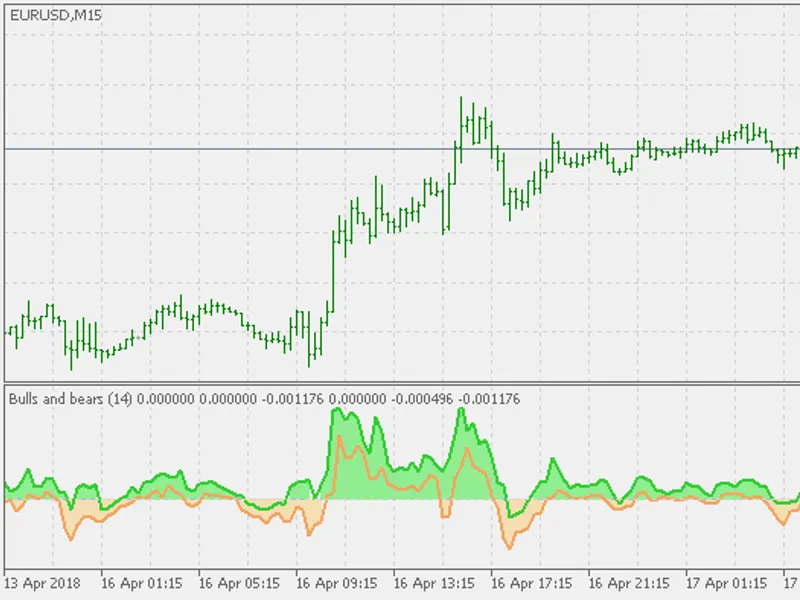
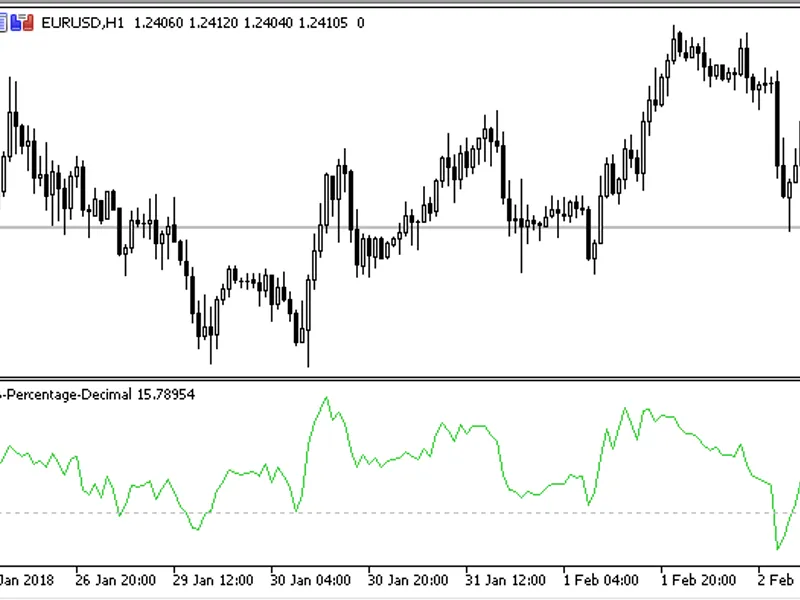
usually we have one indicator showing bulls power and one showing bears power.since they are not having the same ranges of values, they can not be just placed in the same window so...
adaptive moving average (ama) technical indicator is used for constructing a moving average with low sensitivity to price series noises and is characterized by the minimal lag for ...
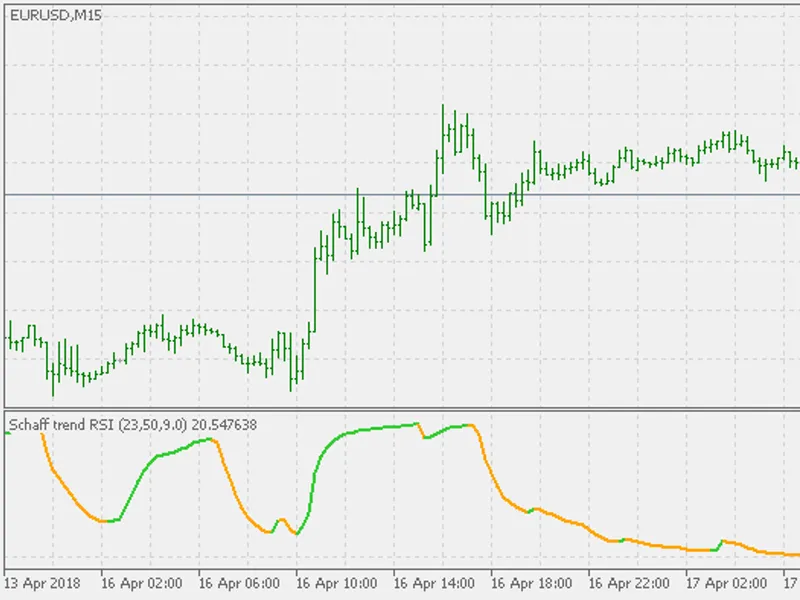
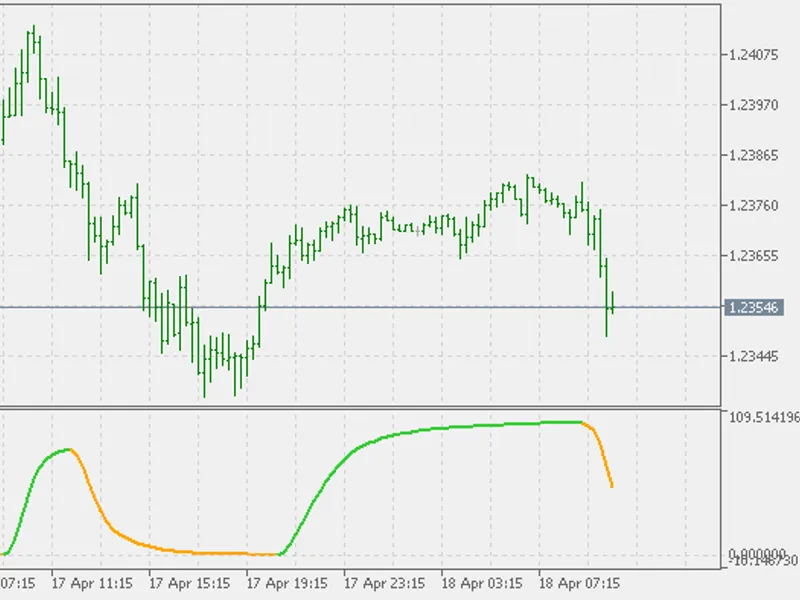
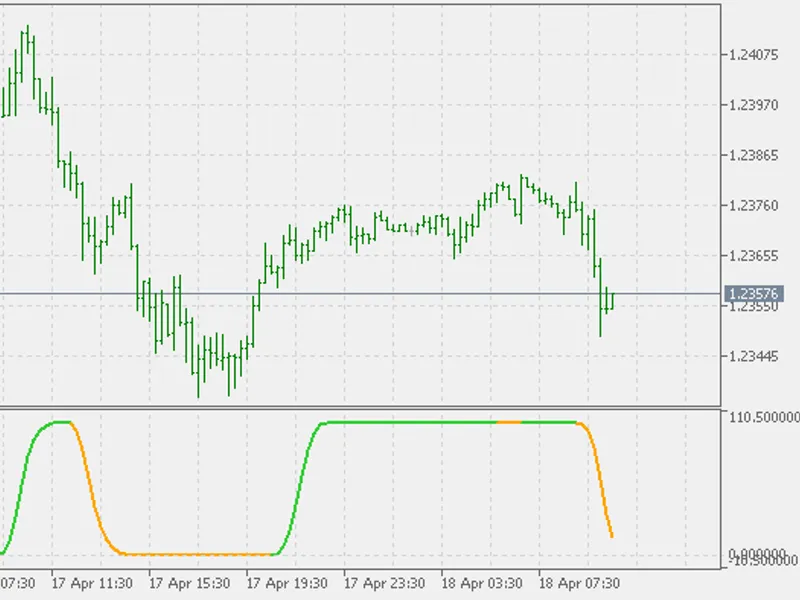
schaff trend series indicator that is less known.while is a sort of a double smoothed stochastic of a macd, this is an rsi of the macd. it partially reminds of a rsi of moving aver...
doug schaff created a few indicators that were meant to assess trends.in one of his indicators he uses what he calls "shaff cd" (which is actually macd signal line instead of using...
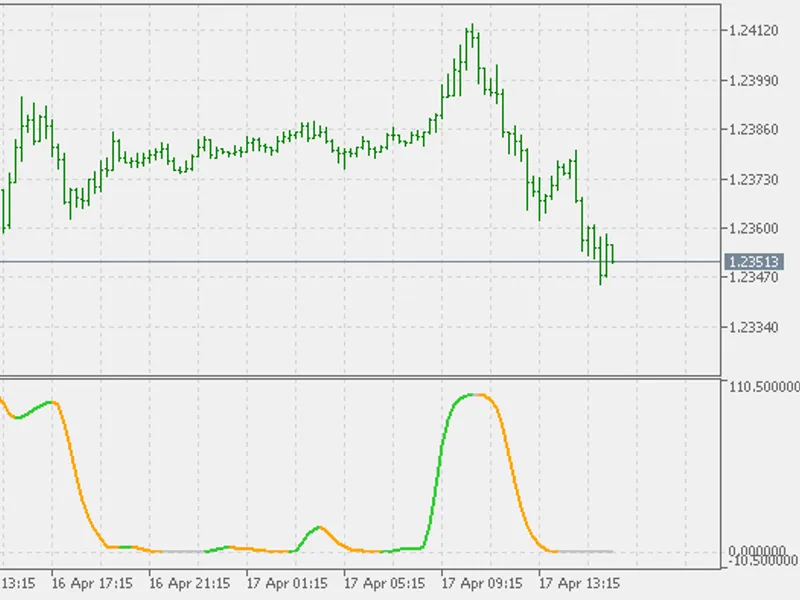
as a logical step to filter out more the possible false signals, this variation of is using rsx (which is a smoother rsi than the "regular" rsi) to produce a smoother result....
the indicator shows the so-called safe zone, which is calculated using the high, low and close prices, and the moving average indicator.it is recommended to perform trades when the...
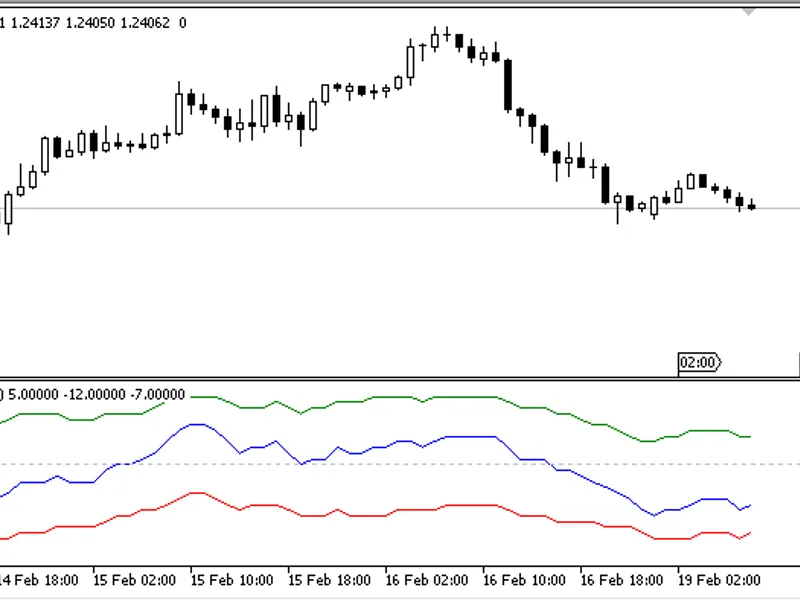
the indicator draws bollinger bands in a separate window in the form of an oscillator.there indicator has three adjustable parameters:period- period;bands deviation- deviation;appl...
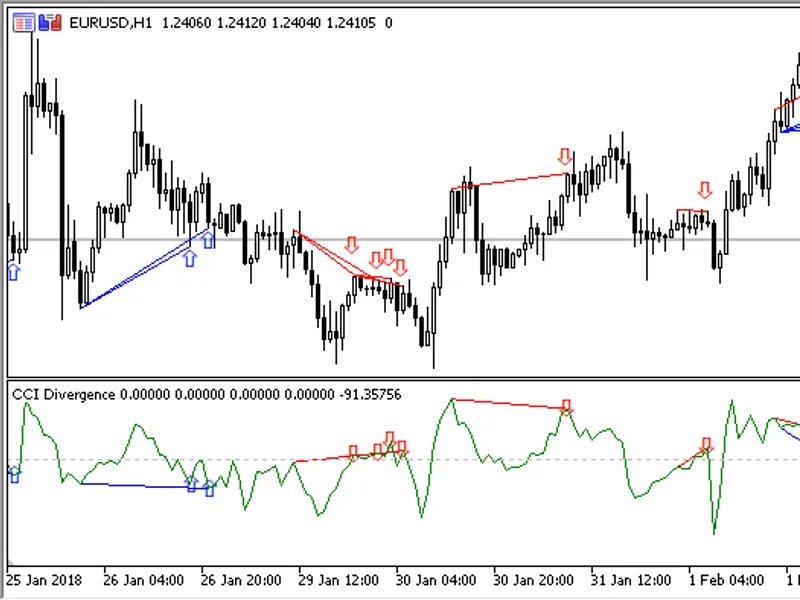
the custom indicator cci_divergence draws the cci indicator line in a separate window and displays found divergences in the indicator window and on the price chart.the indicator ha...
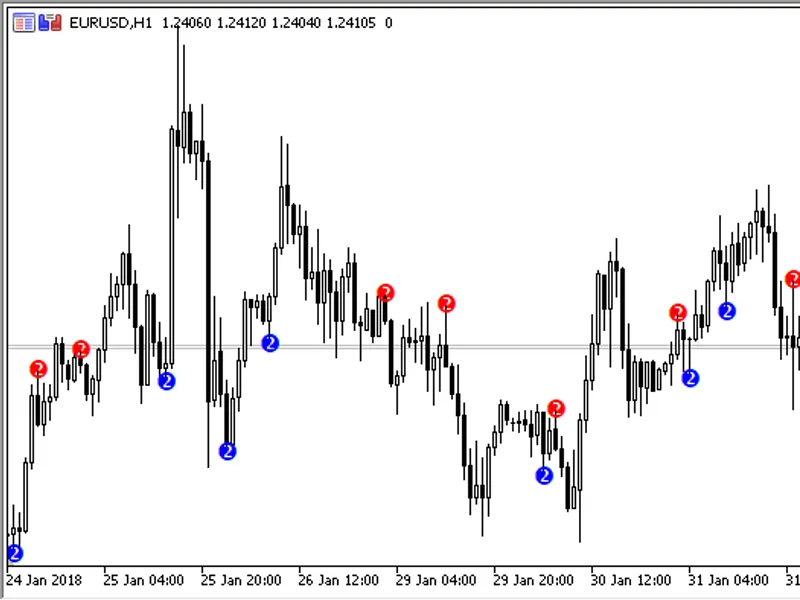
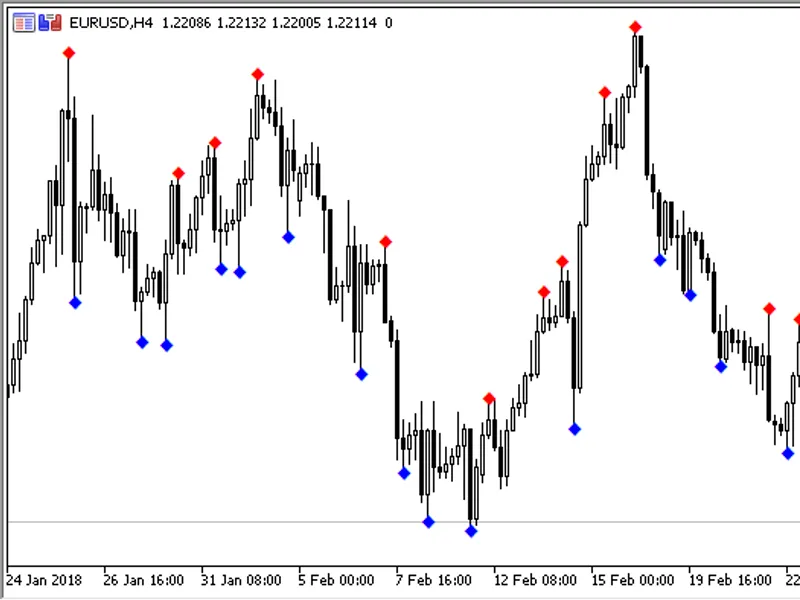
the indicator allows finding on the price chart fractals with different dimensions and displaying them simultaneously.it searches for fractals with dimensions form 1х1 to 10х10the ...
the new high new low index indicator displays the high/low values of a symbol.the index is calculated as the difference between the number of highest highs and the number of lowest...
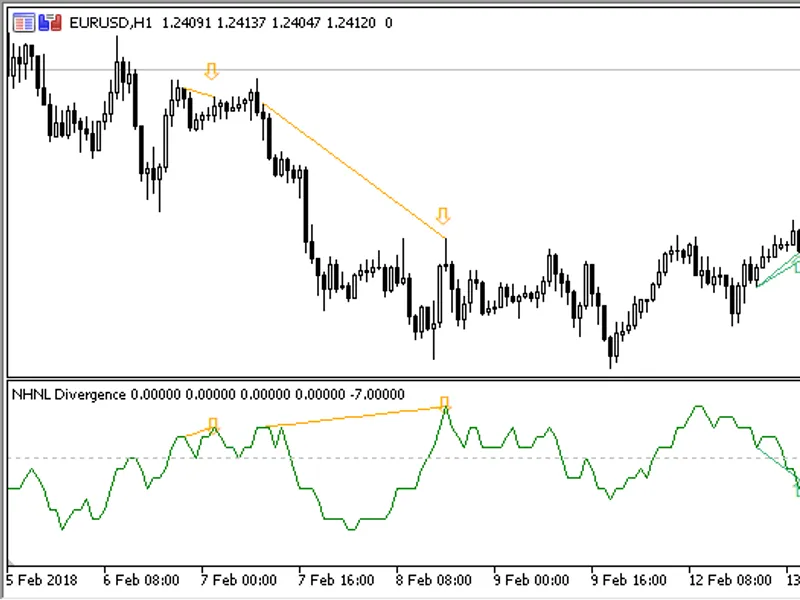
the custom nhnl_divergence indicator (based on the indicator) draws the hl index line in a separate window and displays found divergences in the indicator window and on the price c...
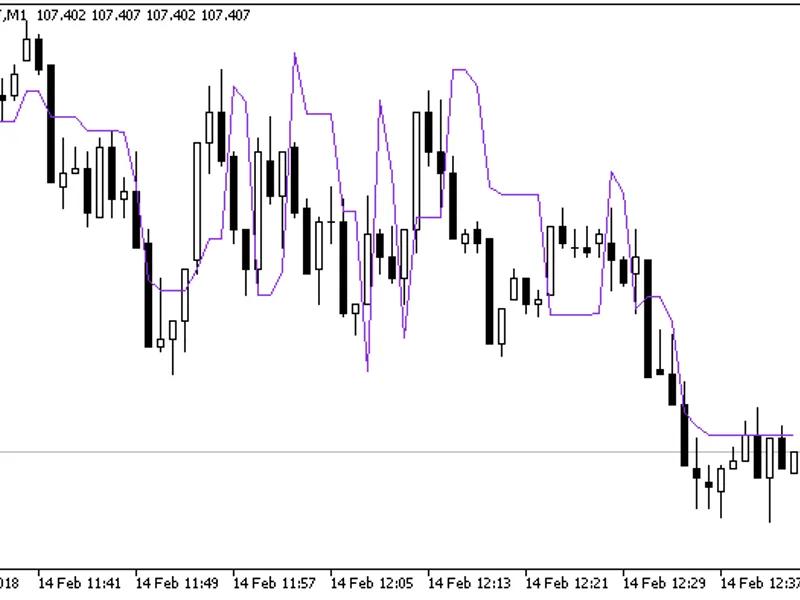
the indicator is based on moving averages. it dynamically calculates and shows possible support/resistance levels.it has two parameters:period- calculation period;applied price- pr...
a simple moving average with a variable (increasing) calculation period. the period is reset at the beginning of new calculation, when price and the ma intersect.the indicator has ...
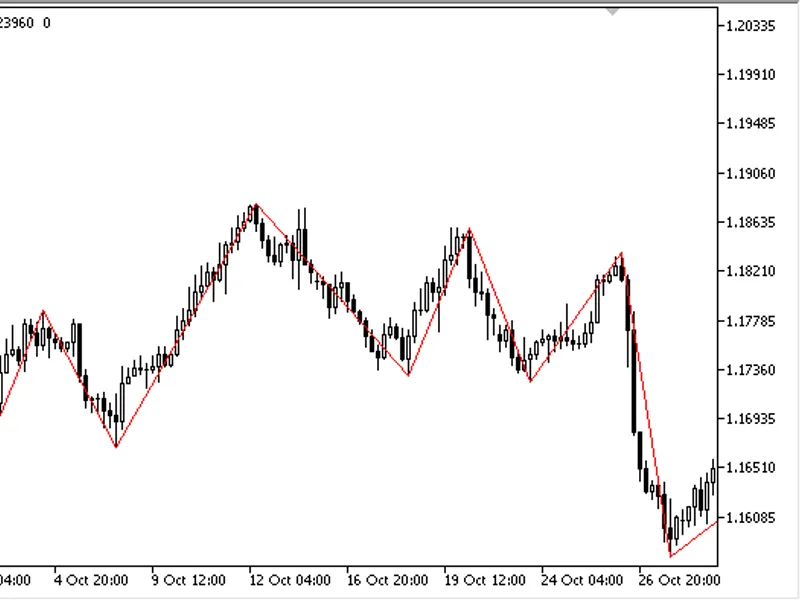
the indicator draws on the price chart a simple zigzag, for which you need to specify only the step value. a break point is added when the length of the zigzag leg (step) is exceed...
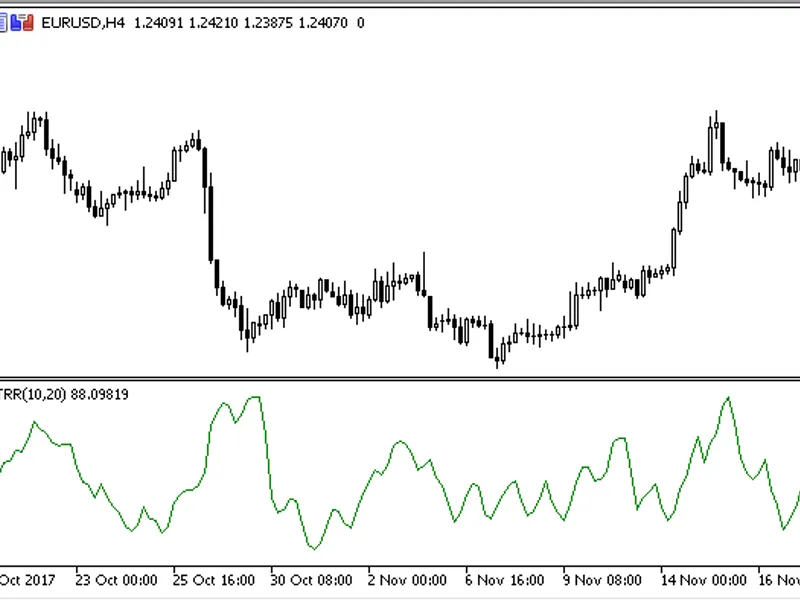
the indicator displays the ratio of two atrs with different periods.it is calculated by the following formula:atrr = (atr1/atr2)*100 it has two parameters:atr1 period- atr1 calcula...
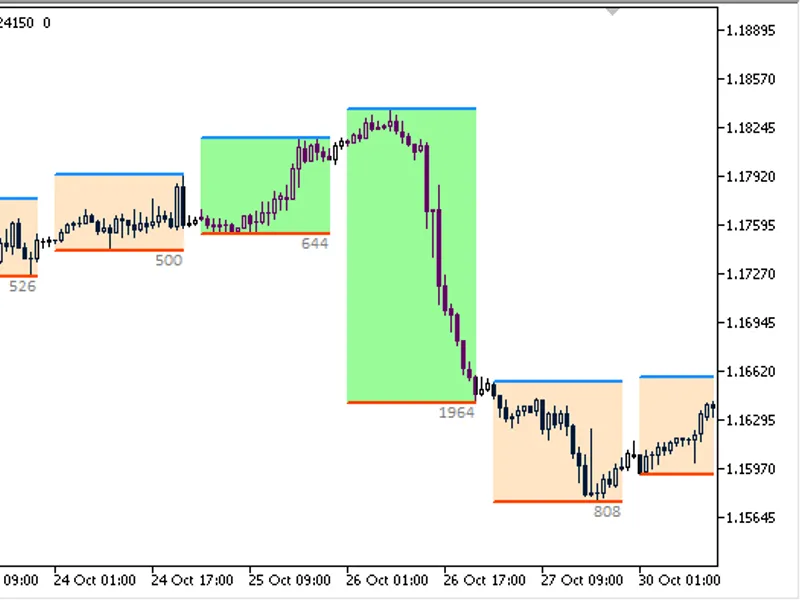
the indicator displays on the chart the previous trading day's channel. the indicator allows setting trading day start and end hours. channels are displayed in different colors dep...
the indicator searches for custom patterns specified in settings, and displays them on a chart. the pattern must be set as a text code, in which:u is a bullish candlestick d is a b...
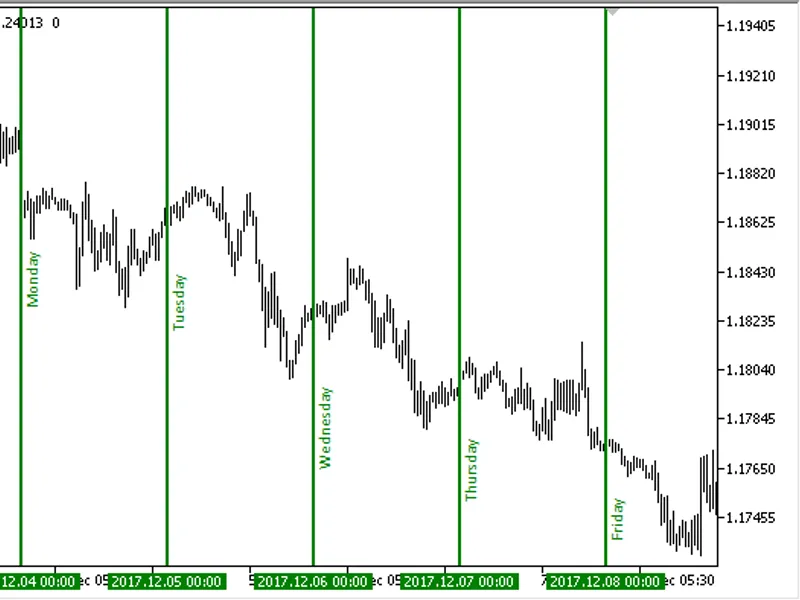
the indicator shows the names of the days of the week, as well as the beginning of each month and year as lines and text labels on the chart.the indicator has 31 input parameters:s...
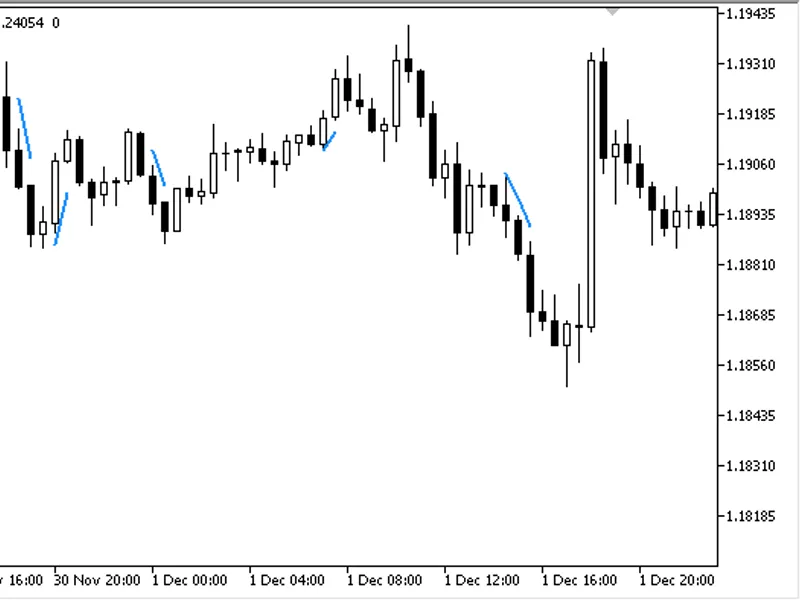
the kot (keep on trading) indicator shows time for holding a position. for example, if we have an open buy position, the indicator draws a line below the price, which means you can...
the indicator draws a moving average relative to atr and overbought/oversold levels in a separate window.calculation formula:overbought_oversold = (ma/atr)*100 where:ma - the movin...
the pmf (pivot money flow) indicator displays the direction and the reversal of money flows.it has two parameters:applied price- the calculation price;cumulative- apply cumulative ...
the indicator is similar to the standard macd, but is calculated using both macd and sar, which enables it to generate confident signals in trend areas. overbought/oversold levels ...
a simple oscillator, which is based on the values of the istochastic, irsi and imomentum indicators and is implemented as a two-colored histogram.indicator calculation formula:kwan...
the averaged non-trivial linear combination of irsi and idemarker implemented as a color histogram.indicator calculation formula:xrsidemarker = ma((irsi[bar] + 100 * idemarker[bar]...
the indicator with the possibility to change the indicator timeframe in input parameters:to enable the indicator operation, add the xrsidemarker_histogram.ex5indicator file to <...
the indicator with the possibility to change the indicator timeframe in input parameters:to enable the indicator operation, add the kwan_nrp.ex5indicator file to <terminal data ...
the indicator is an macd with expanded settings.in addition to the standard parameters of the fast and slow ema periods, signal sma periods and calculation price, this indicator al...
the indicator displays on a price chart fractals with any dimension of sides. a traditional fractal may have a dimension of 2x2, 3x3 etc. this indicator allows setting any dimensio...
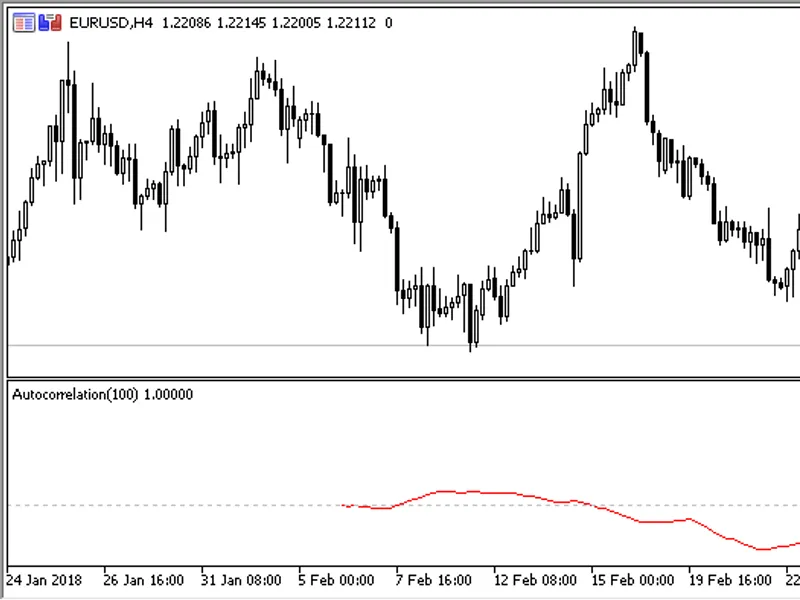
the indicator calculates and displays on a chart the autocorrelation function, which shows the relationship between the function (signal) and its shifted copy depending on the time...
the indicator searches for the "inside bar" pattern and marks it on a chart. in the inside bar candlestick pattern, the right candlestick is inside the right candlestick, which is ...
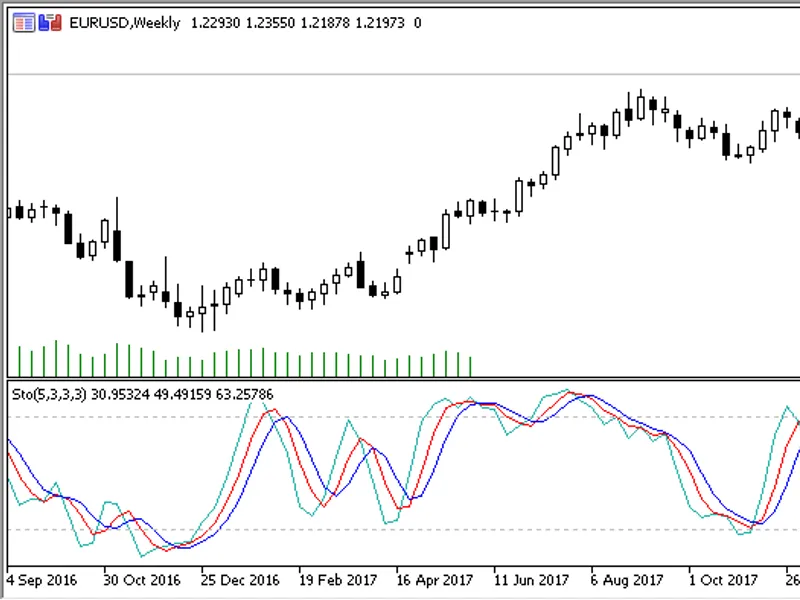
sss (special slow stochastic) has an additional smoothed (slow) line based on the stochastic signal line.it has six input parameters:%k period- the %k period of the standard stocha...
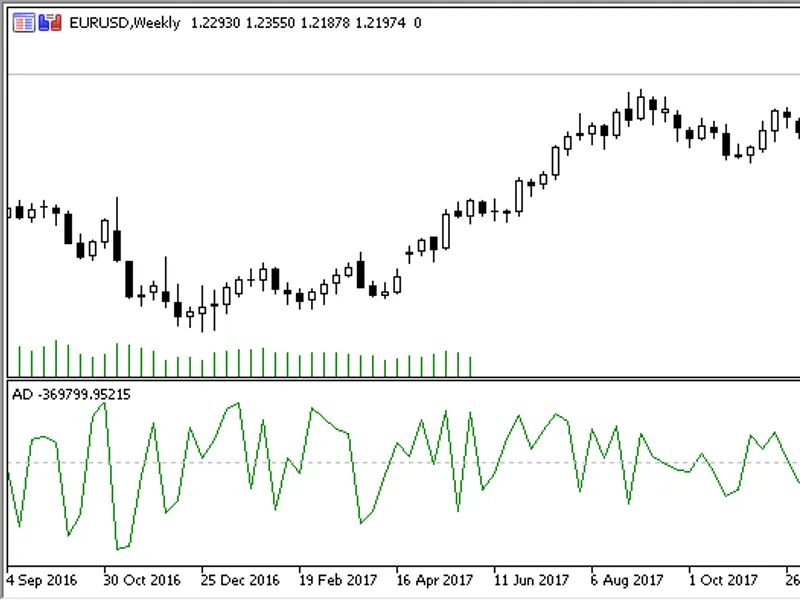
this accumulation/distribution indicator has three calculation methods:classical classical incremental (used in the standard ad indicator available in the terminal); trade station ...
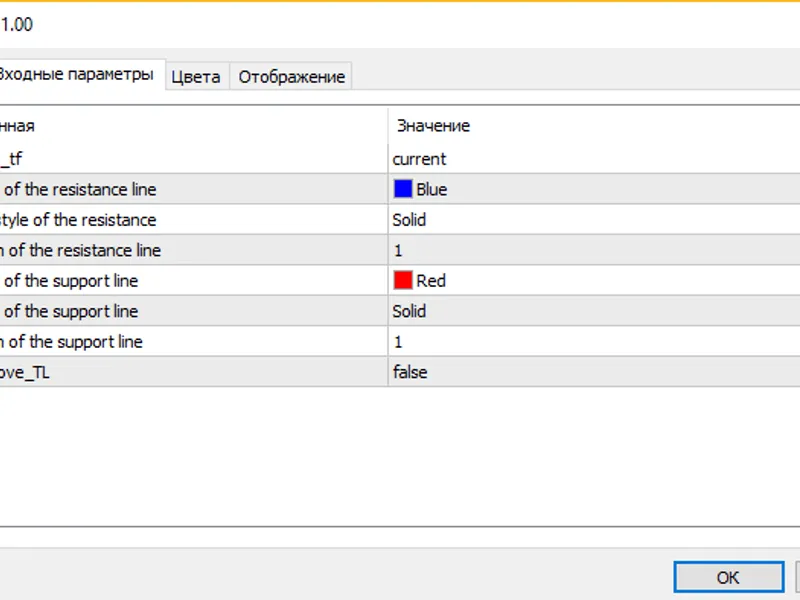
an indicator for automatic drawing of trendlines based on fractals of a given timeframe.input parameters base_tf- the timeframe for calculating fractals, based on which the trendli...
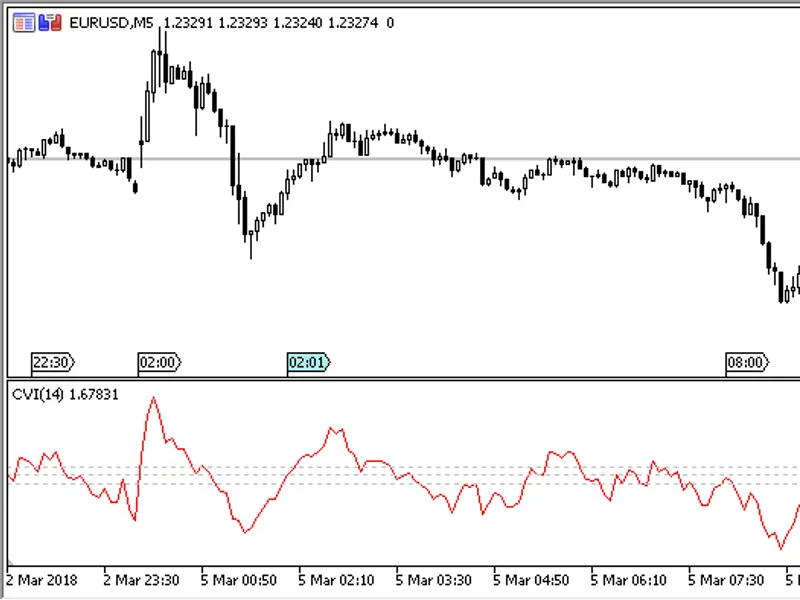
the oscillator shows the value of price deviation from the moving average taking into account atr.calculation formula:cvi = (close – ma ) / atr modified formula:(mcvi) = (close – m...
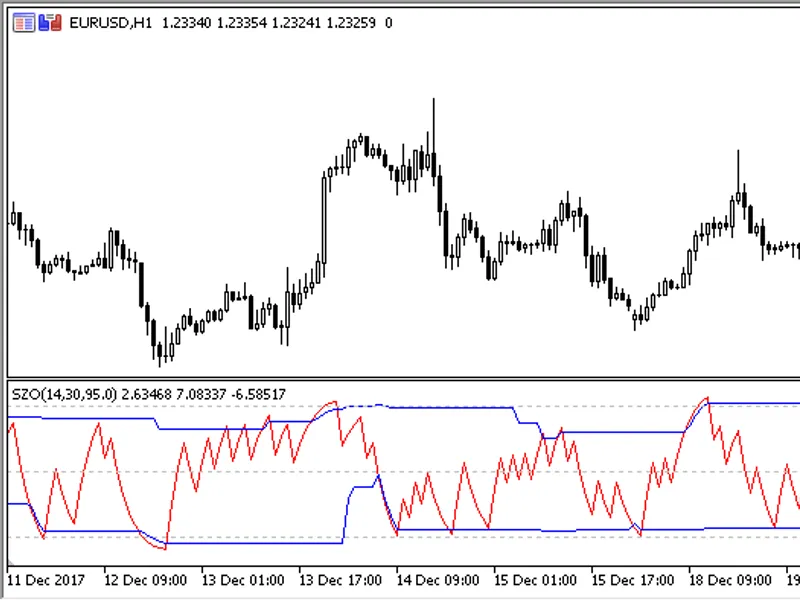
the szo (sentiment zone oscillator) indicator shows the market sentiment (activity and direction) and zones of excessive activity (overbought/oversold zones). it can display a dyna...
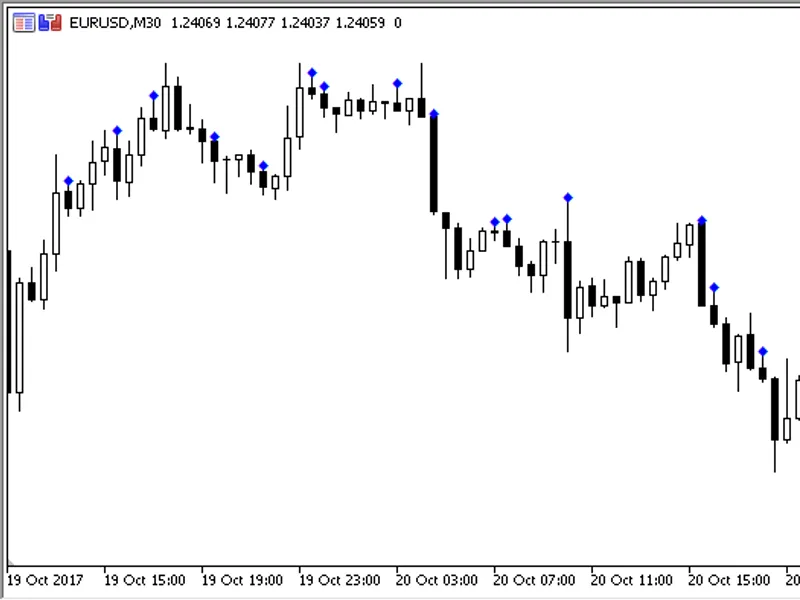
the indicator finds and displays gaps between high and low prices of two neighboring bars.the gap is marked with arrows: an up arrow is used for an upward gap and a down arrow is u...
the oscillator indicator draws a histogram (with border levels at two moving averages on the indicator histogram) showing three market states: a trend, a moderate or fading trend a...
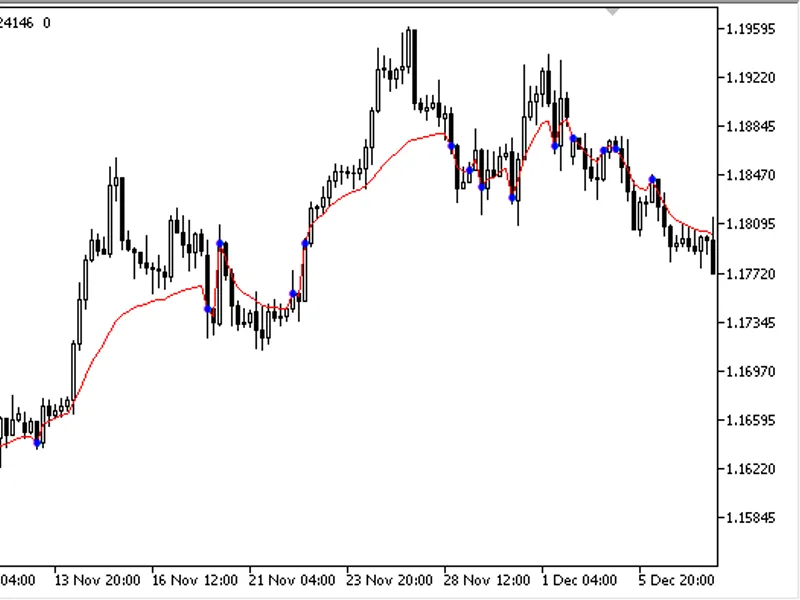
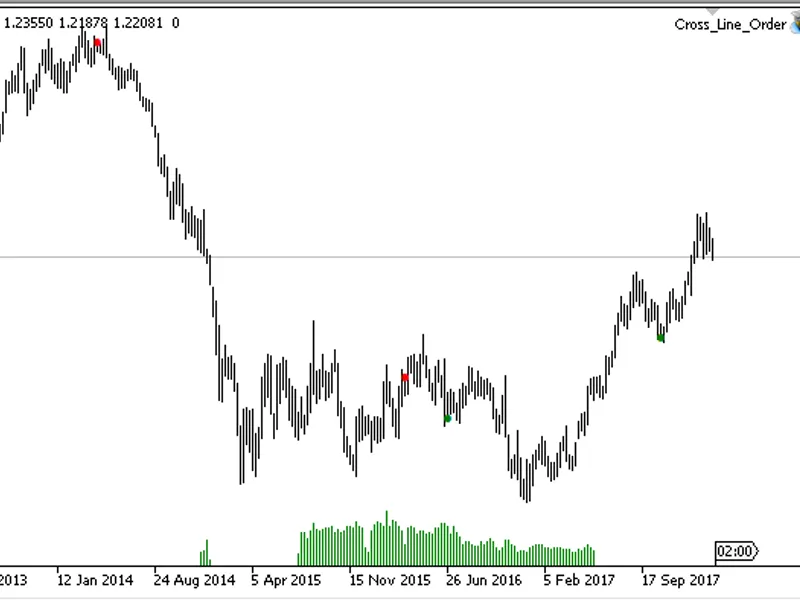
the indicator adds signal marks to a price chart when the indicator crosses its zero line. if cci crosses the zero line upwards, a dot is added below the candlestick, if downwards ...
the indicator draws a colored area on a price chart in the form of a histogram between two moving averages based on high/low prices.it has two parameters:ma period- ma calculation ...
two indicators in one: momentum and stochastic:if smoothing is applied, it is an average stochastic momentum (asm); if not, it is a stochastic momentum (sm). the indicator has eigh...
the idayiindex (intraday intensity index) oscillator indicator.it is calculated by the following formula:iii = sum((2c-h-l)/(h-l))*tickvolume normalized:normalized iii = (iii /sum(...
vsi - volatility switch indicator. the indicator measures the current volatility with respect to historical data for the selected period. it allows to evaluate the market state. th...