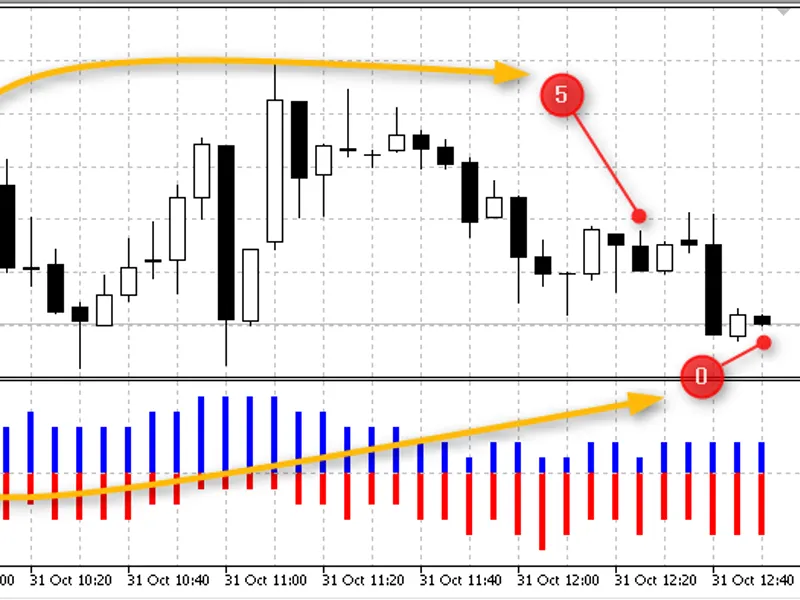
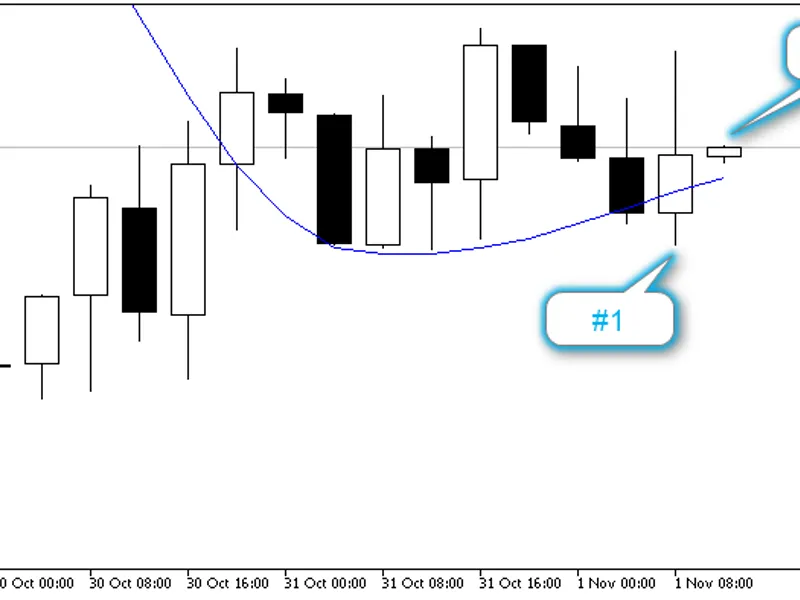
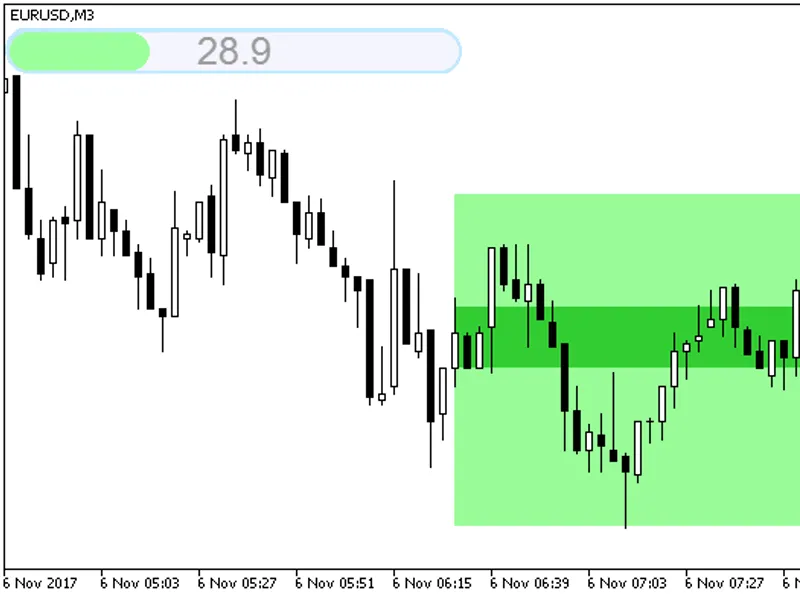
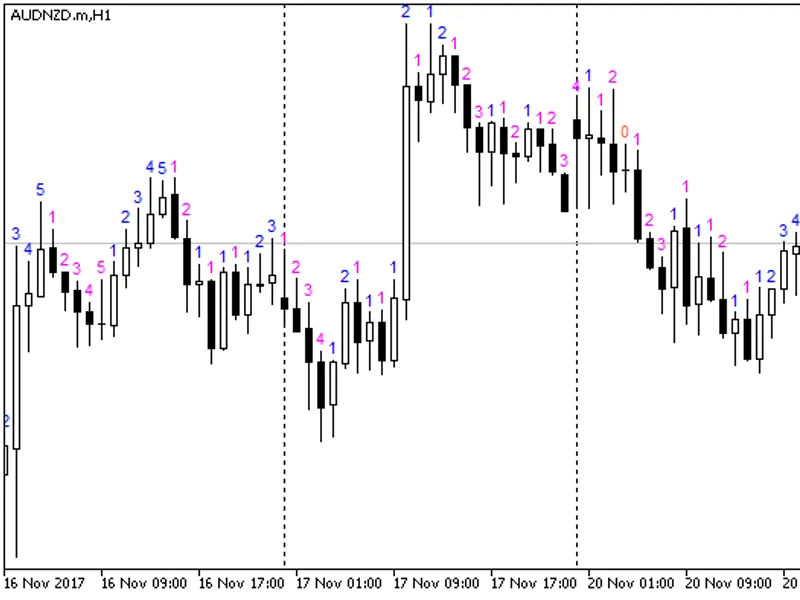
It displays the percentage of time elapsed since the start of the bar relative to the bar's total duration.The indicator is available in two versions: ascending and descending.To e...
It provides the ratio between time elapsed since the bar beginning and the duration of the entire bar in percent. The indicator is available in two variants: rising and falling, wi...
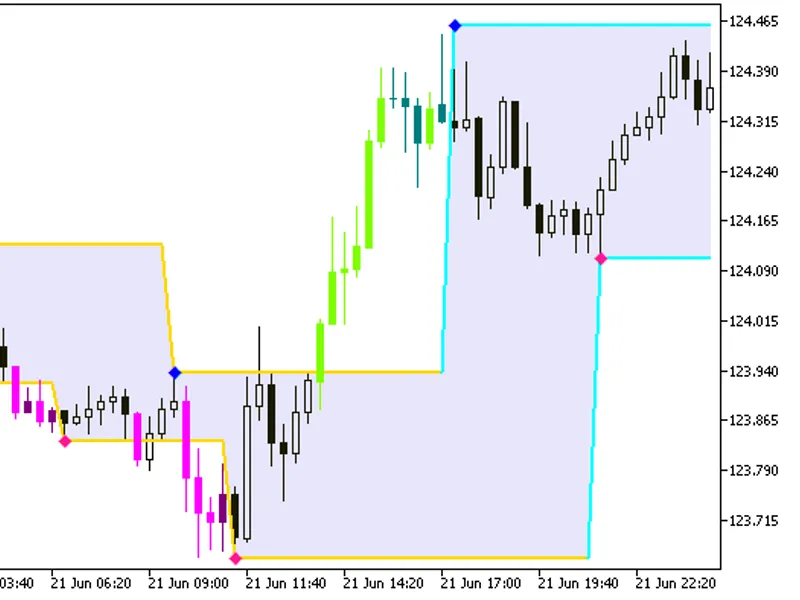
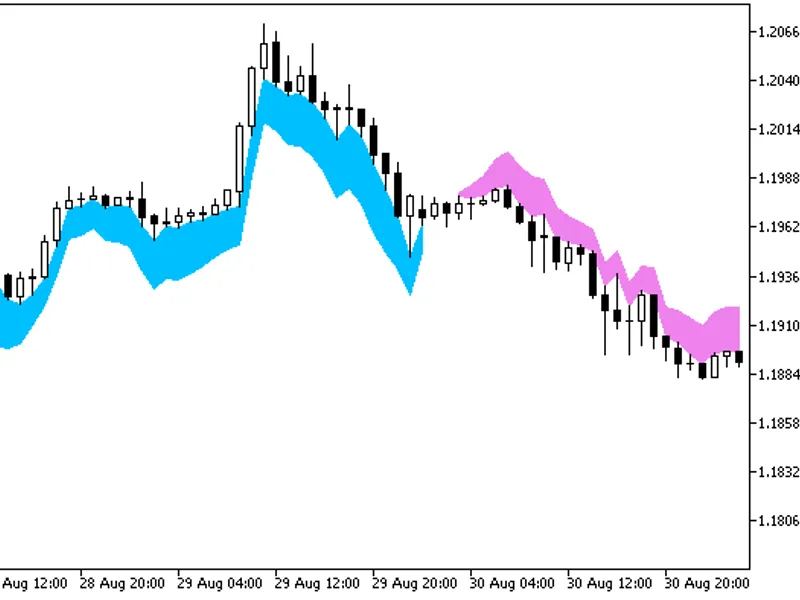
A channel indicator based on peaks and troughs of price action.For correct compilation, add the alexstal_outsidebar.mqh library to \mql5\include.Fig. 1. Alexstal Zigzag Prof Channe...
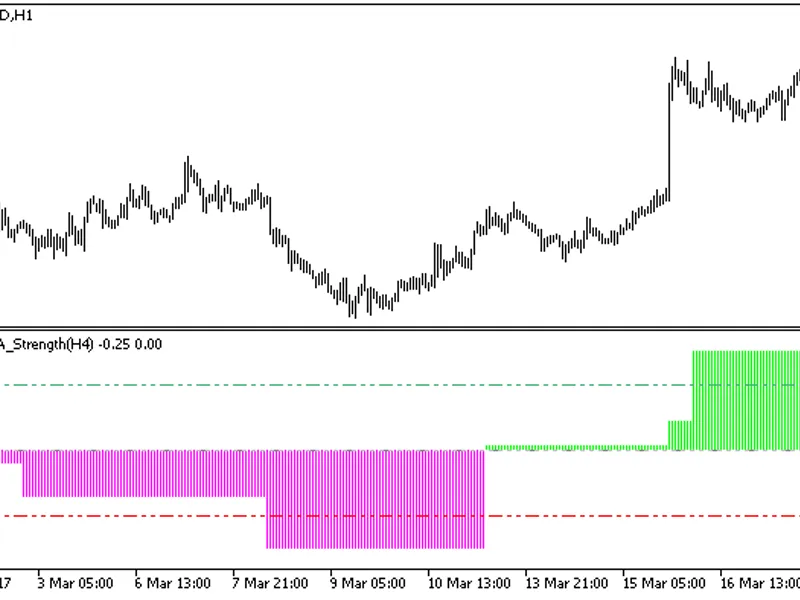
The indicator assesses trend power and direction using four moving averages. Four value levels are assigned to rising and falling trends, providing a clear indication of trend stre...
The indicator offers a timeframe selection option within its input parameters.To use this indicator, you must have the Mikahekin.mq5 indicator file saved in the following location:...
This indicator offers the flexibility to select the timeframe directly from the input parameters.To utilize this indicator, ensure you have the forcetrend.mq5 file saved in the <...
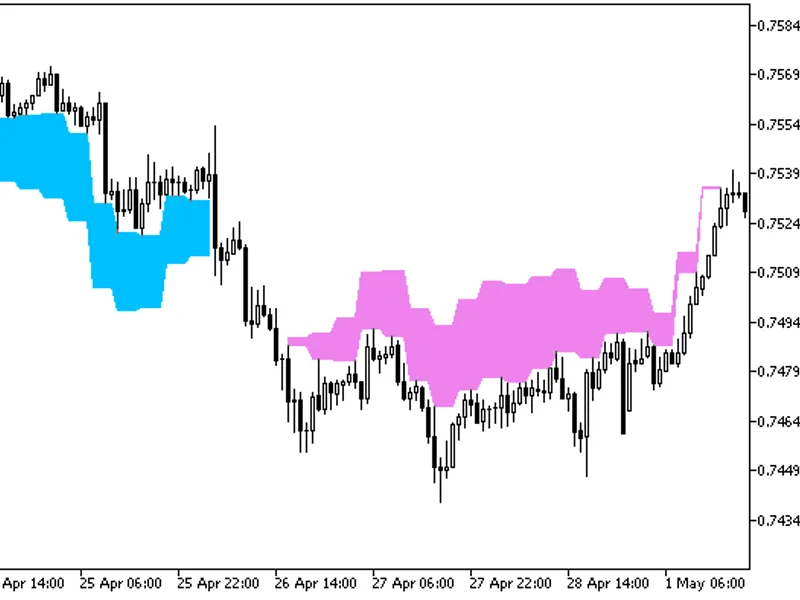
This indicator is designed to provide a visual representation of price breakouts using the Mikahekin indicator channel.When the price moves outside the gray channel, the candlestic...
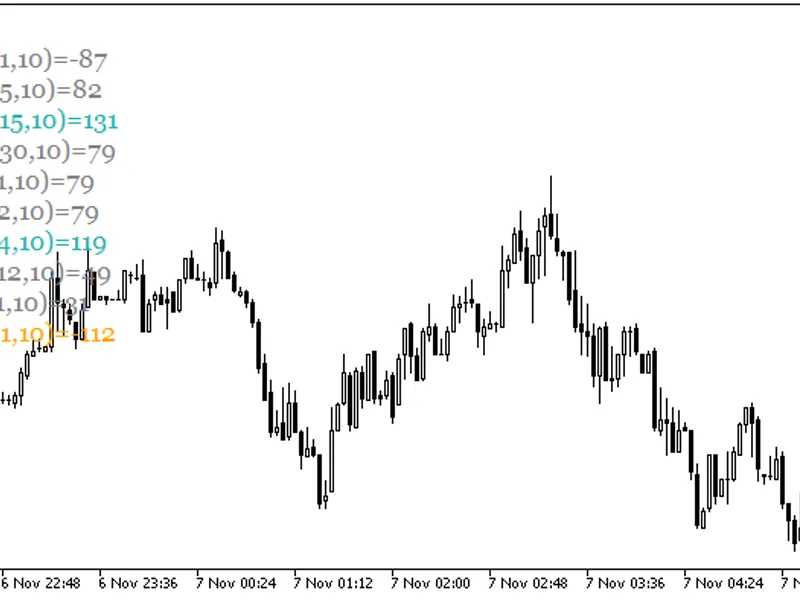
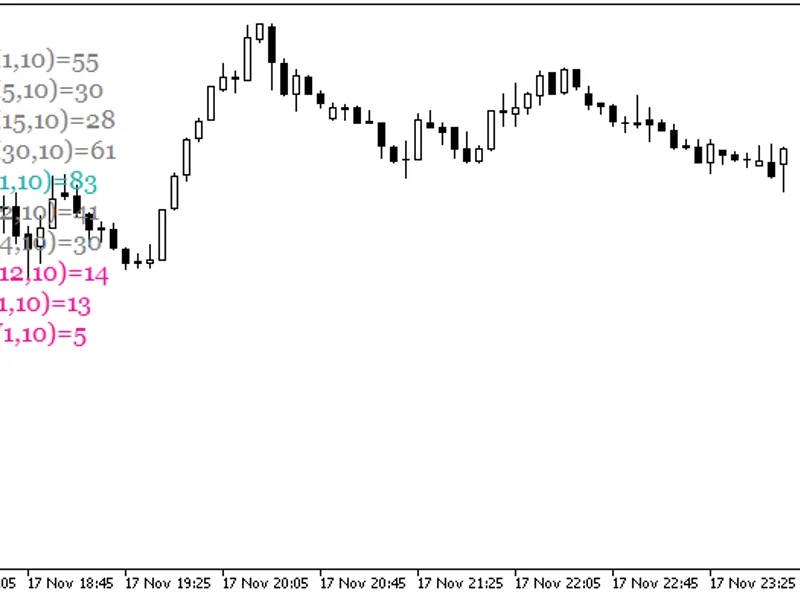
The indicator displays a text block with the values of the user-defined ATR period for various timeframes. The text block size is adjustable, and you can customize the font. Additi...
The indicator with the timeframe selection option in the input parameters.This indicator requires the four_ma_strength.mq5 indicator file. Save it to /mql5/indicators.Fig. 1. The f...
This indicator displays a text block with volatility values for a user-defined period across various timeframes. The text block size is adjustable, and users can customize the font...
The Color Derivative Indicator is a powerful tool that displays a colored histogram with an additional averaging feature.This indicator utilizes the smoothalgorithms.mqh library cl...
A classic oscillator imported from the FXAccuCharts platform, this indicator employs the same algorithm as the original platform.Figure 1: Psychological Indicator...
The indicator offers a timeframe selection option in the input parameters.It requires the kolierbands.mq5 indicator file. Save this file to \mql5\indicators.Fig. 1. The kolierbands...
The indicator offers a timeframe selection option within its input parameters.To utilize this indicator, you'll need the psychological.mq5 indicator file. Ensure you save it to the...
The RS i Values indicator displays a customizable text block with the values of the user-defined RSI period for various timeframes.Features:- Display RSI values for multiple timefr...
When the price exits the gray channel, the candlestick color changes to indicate the trend direction. Green signifies the growth of the financial asset, while pink represents its d...
This indicator is an implementation of the market cycle indicator described by Raghee Horner.The indicator's principle is straightforward:- Green bars indicate an uptrend when a ba...
Breakout of the Overbought ZoneWhen the price breaks out of the overbought zone, it indicates a potential reversal from a buy to a sell trend.Trend in the Overbought ZoneIf the pri...
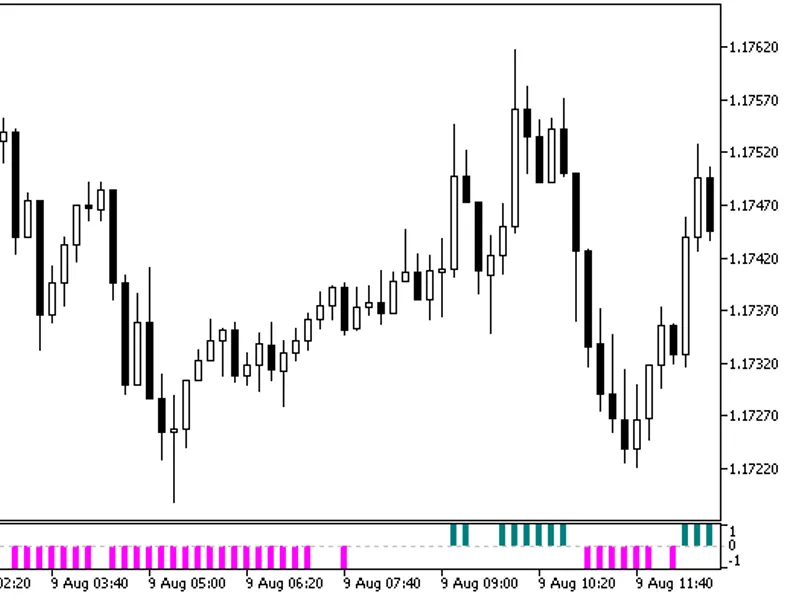
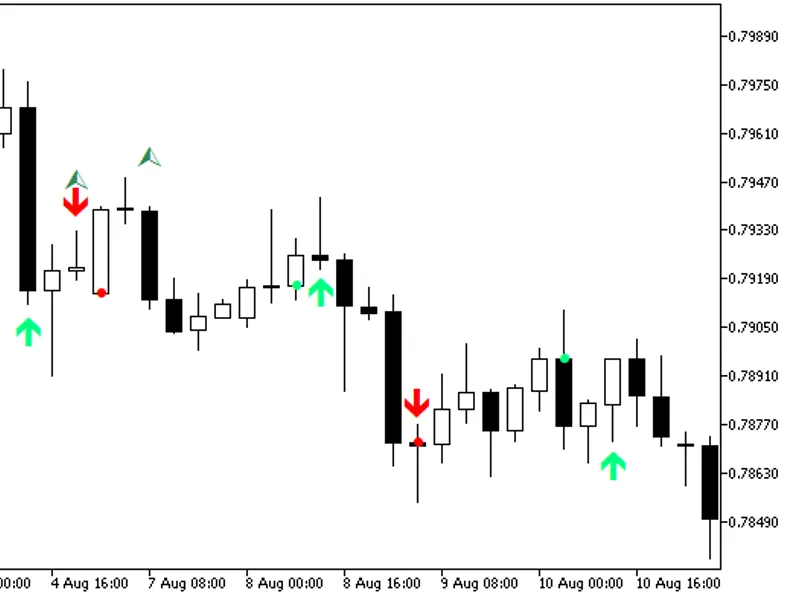
This indicator provides an additional signal line and arrows to indicate the intersection of the main and signal lines.The indicator determines the intersection as follows:When the...
The Vortex Indicator is a technical analysis tool introduced in the January 2026 issue of "Technical Analysis of Stocks & Commodities".This indicator provides a comprehensive frame...
The Momentum Indicator is presented as a color histogram, offering a visual representation of price trends.Indicator Settings:Momentum Period- The number of periods used to calcula...
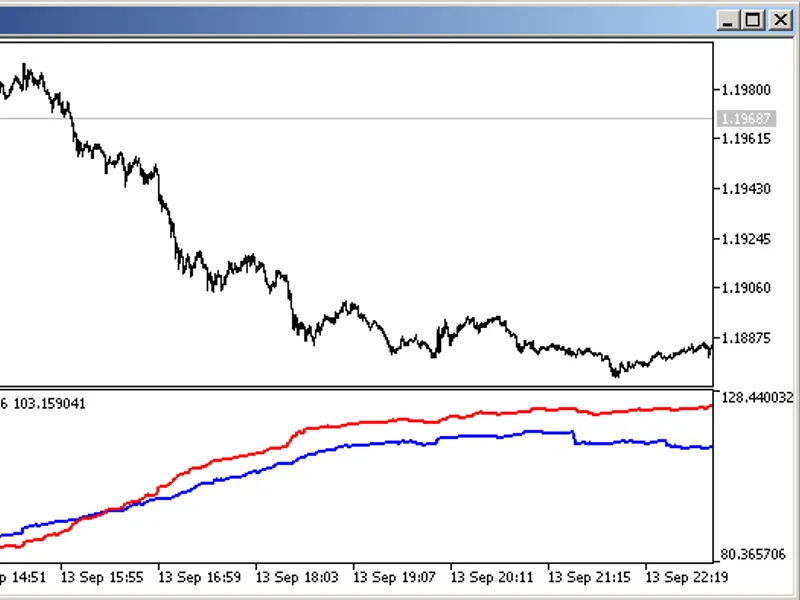
Indicator lines display the cumulative sums of bulls and bears power over a user-defined period.Calculation MethodBulls power is determined using the formula:bullspower(i) = sum(cl...
The Resistance and Support indicator draws lines based on the underlying indicator's calculations. It considers the potential redrawing of the last fractal value and analyzes an ad...
This indicator displays three moving averages to identify potential targets and entry points.It is suitable for all timeframes but is most effective in short intervals like M1, M2,...
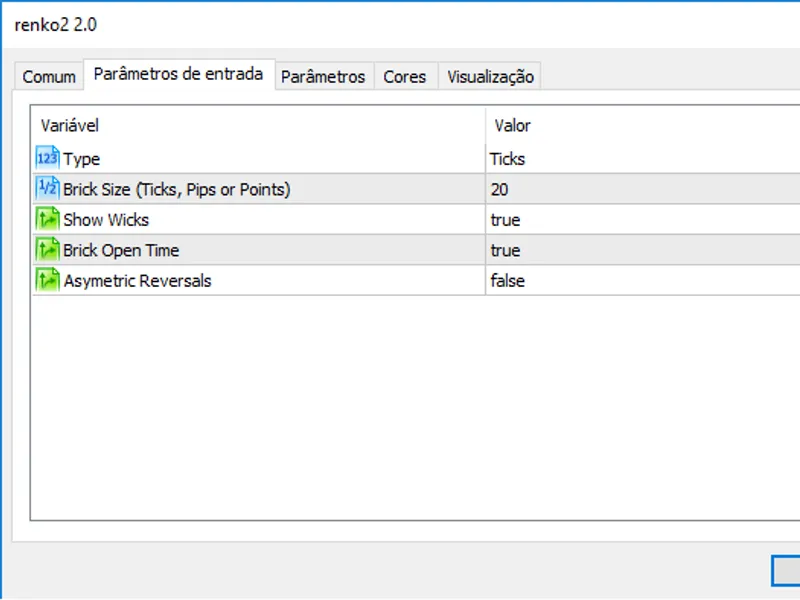
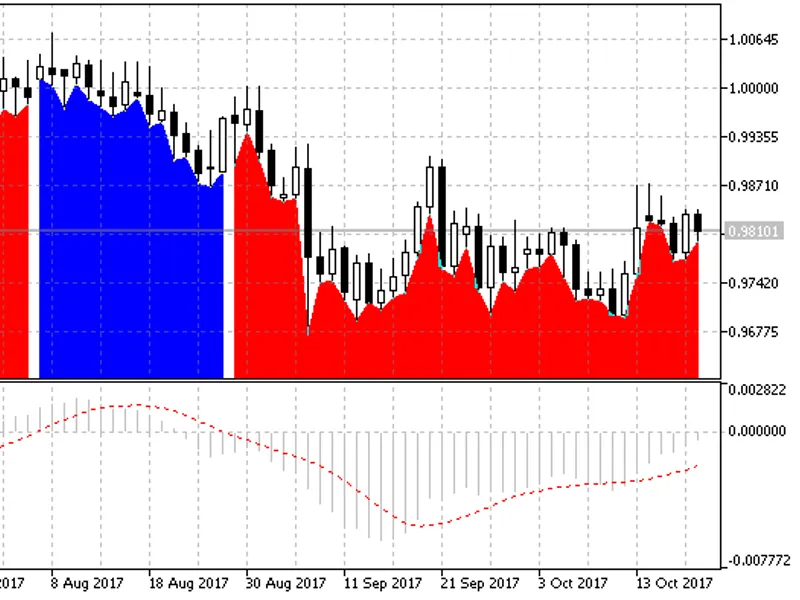
A new and improved Renko 2.0 indicator with enhanced features, including time, volumes, and spread information.This indicator is inspired by the work of Serhii Ivanenko and Tim Wel...
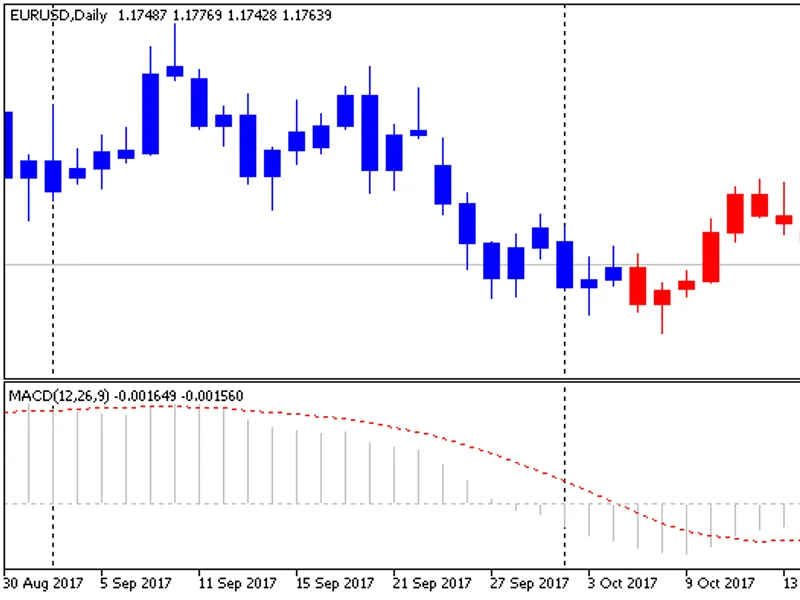
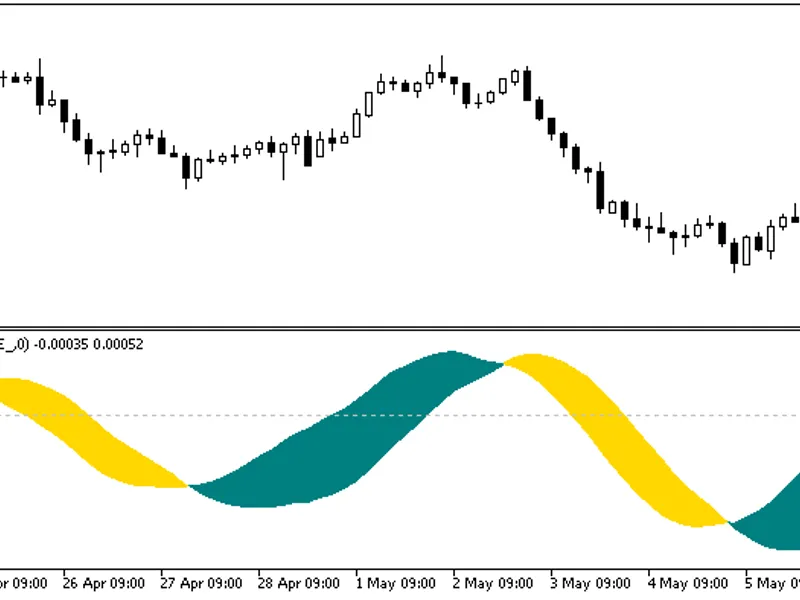
The "MACD Crossing the Zero Level" indicator employs a unique style to highlight areas where the MACD line is either above or below the zero line.Within the indicator settings, use...
The "MACD Crossing the Zero Level" indicator employs a unique style to visually represent areas where the MACD line is above or below the zero line.Through the indicator settings, ...
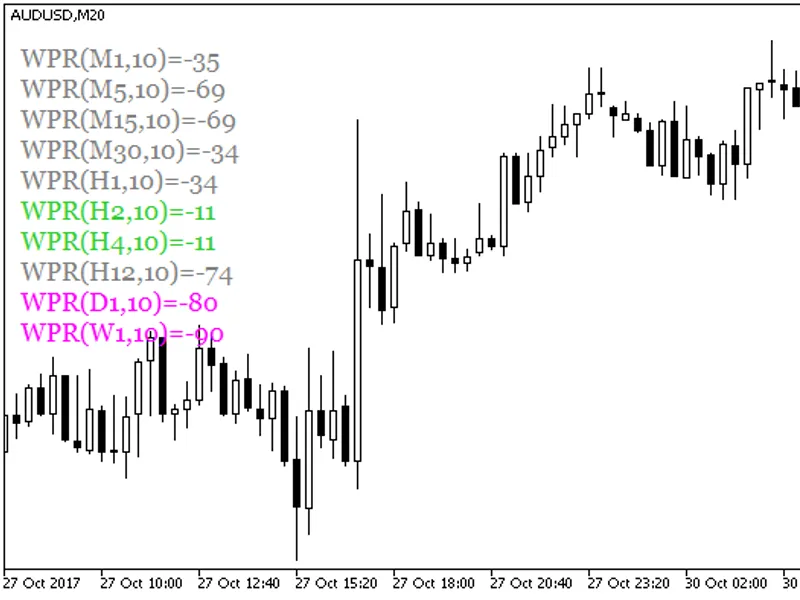
The indicator displays a customizable text block with the values of the user-defined oscillator period for various timeframes. You can adjust the text block size, font, and visibil...
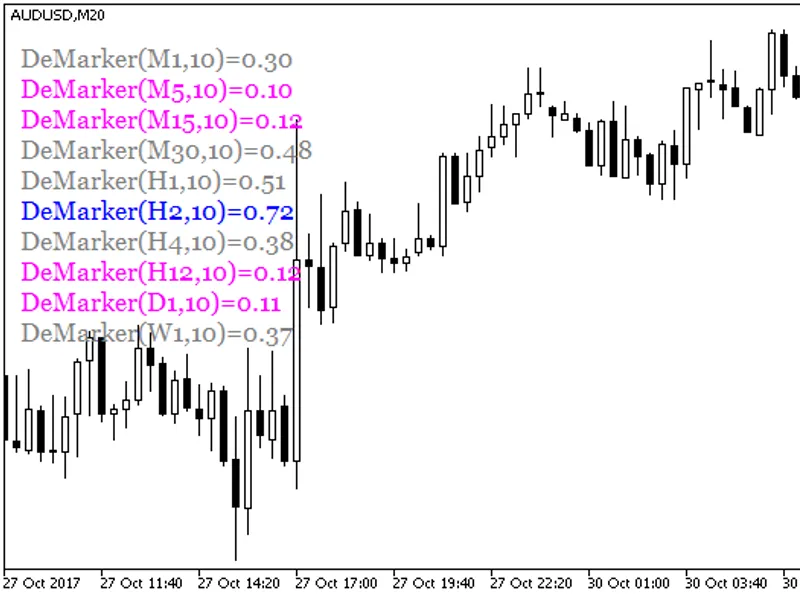
The DeMarker Values indicator displays a customizable text block with the values of a user-defined oscillator period for various timeframes.Features:- Adjust text block size and fo...
This indicator calculates the number of bullish and bearish bars within a specified period, starting from a chosen bar and ending at another defined bar.For instance, with the sett...
This indicator alerts when the price crosses the moving average on the Nth bar.Input Parameters:- Period of MA: Moving average indicator averaging period.- MA Shift: Shift of the m...
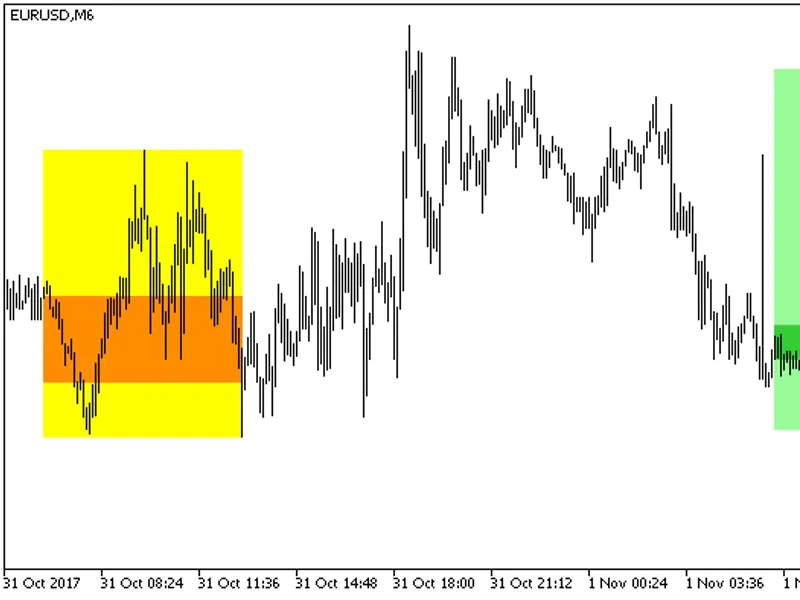
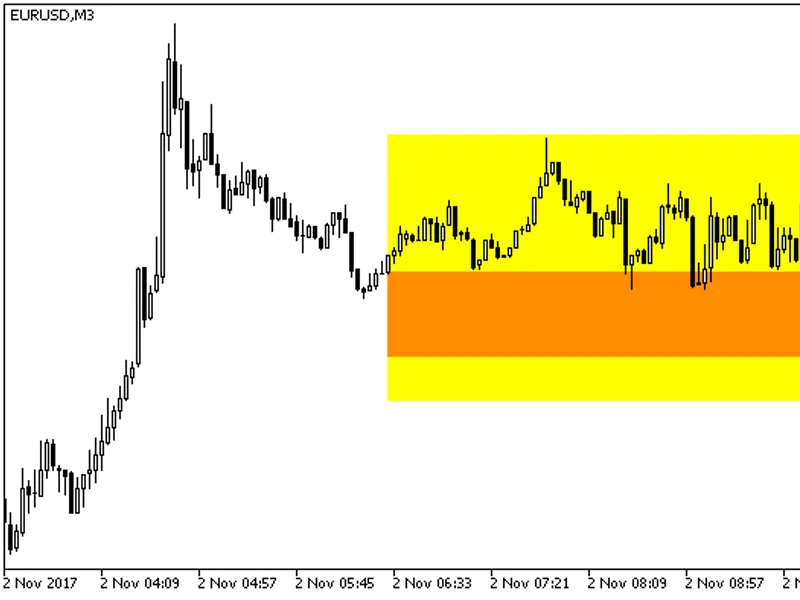
The indicator highlights the specified time period with colored rectangles, providing a visual representation of price movements.The central rectangle is based on the open and clos...
The indicator highlights the specified time period of the current day with colored rectangles. The central rectangle is based on the open and close prices of the trading period, fo...
The indicator displays the percentage of time elapsed since the start of the trading session, as specified in the input parameters. This functionality is achieved through the use o...
The CCI Values indicator displays a customizable text block with the values of a user-defined oscillator period for various timeframes.Features:- Adjust the size and font of the te...
The indicator allows you to change the indicator timeframe from the input parameters.For the indicator to work, you need the xma_divergence.mq5 indicator file. Add it to <termin...
A trend indicator that receives trade signals from the histogram.This indicator utilizes the smoothalgorithms.mqh library classes, which should be copied to <terminal_data_folde...
The Candle Row indicator is a powerful tool for tracking and visualizing consecutive candlestick patterns in a single direction.Features:- Tracks and highlights a continuous sequen...
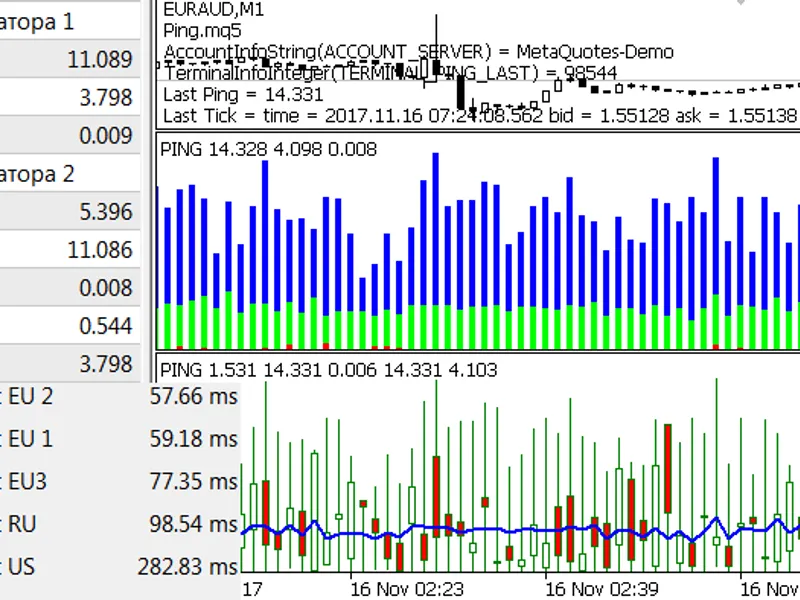
An essential aspect of trading is the relevance of the current price, influenced by various factors. One commonly considered factor is the network ping between the terminal and the...
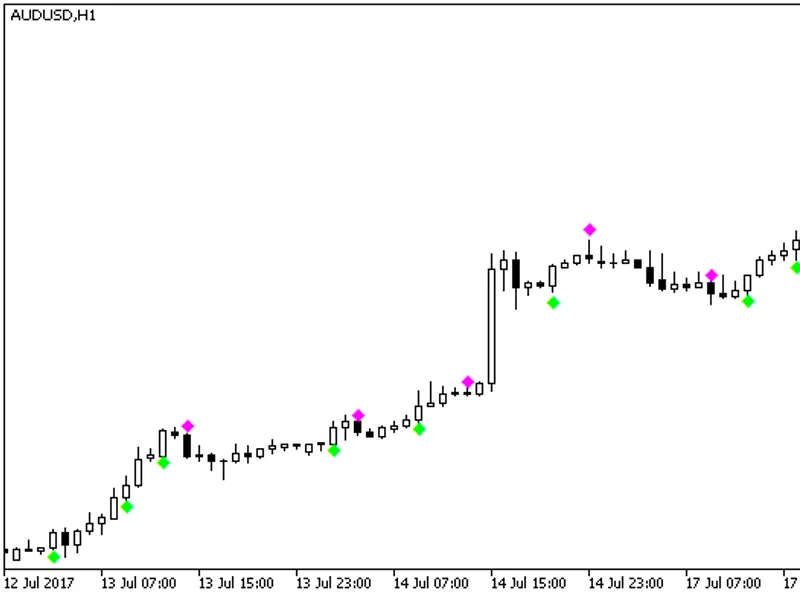
The Daniella indicator is a semaphore signal tool that utilizes the Average True Range (ATR) to generate trading signals. Signals are triggered when the ATR begins to rise after a ...
This indicator displays a customizable text block with the values of the user-defined period for each timeframe. You can adjust the text block size, font, and even disable unused t...
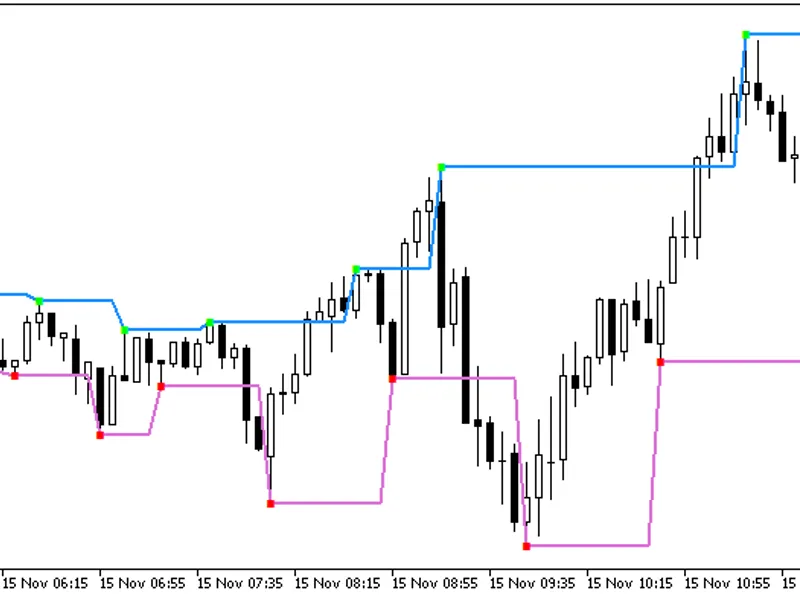
The Fractal Levels indicator is a powerful tool that utilizes fractal patterns to identify key price levels and trends in the market.This indicator is designed to draw a channel ba...