
Tick Scalper Pro: Enhanced Tick Chart and One-Click Trading Panel for MetaTrader 5
Info
The Tick Scalper Pro: Enhanced Tick Chart and One-Click Trading Panel for MetaTrader 5 is a Expert Advisor for MetaTrader 5 that tick scalper pro - tick chart and one-click trading panel for metatrader 5tick scalper pro is a manual trading utility designed for traders operating on very short time frames who need to monitor every price fluctuation. It replaces the standard time-based chart with a compact tick chart and incorporates a panel for rapid order execution.
Usage
This tool is typically used for scalping on lower timeframes (M1-M15).
Platform
This Expert Advisor works exclusively on MetaTrader 5 (both build 600+ and newer versions).
Setup
Place the downloaded file in MQL5/Experts folder via File ? Open Data Folder in MetaTrader 5.
How to Install and Use Tick Scalper Pro: Enhanced Tick Chart and One-Click Trading Panel for MetaTrader 5
1. Installation: Open the "File" menu, select "Open Data Folder," navigate to MQL/Experts, paste your file, and restart the terminal.
2. Activation: Drag the EA from the Navigator onto a chart, ensure "Allow live trading" is checked in the Common tab, and verify the AutoTrading button is green.
3. Optimization: Right-click your chart, choose "Expert List," click "Properties" to adjust inputs, and save your preferred setup as a set file for future use.
4. Maintenance: Regularly check the "Experts" tab in the terminal window to monitor trade logs and potential execution errors.
Frequently Asked Questions
Q: Why is my EA not opening trades? A: Check the "AutoTrading" button, ensure "Allow live trading" is enabled, and verify your broker allows automated trading on your account type.
Q: Can I run multiple EAs on one chart? A: No, each chart can only host one active EA; however, you can open multiple charts for different currency pairs to run several EAs.
Q: What does the "smiley face" icon mean? A: A smiley face in the top-right corner of the chart indicates the EA is successfully running; a frowny face means it is disabled.
What this tool does
Tick Scalper Pro - Tick Chart and One-Click Trading Panel for MetaTrader 5Tick Scalper Pro is a manual trading utility designed for traders operating on very short time frames who need to monitor every price fluctuation.
Typical Use Case
This Expert Advisor excels in automated trading and technical analysis on MetaTrader 5.
Compatible Platform & Setup
This Expert Advisor works on MetaTrader 5. Place the file in the MQL5/Experts folder and restart the terminal.
Description & Settings
Related: Supertrend Scalper with Breakeven Win Rate Panel - another powerful expert for MetaTrader 5 traders.
Tick Scalper Pro - Tick Chart and One-Click Trading Panel for MetaTrader 5Also recommended: Tick Scalper Helper: Tick Chart and One-Click Trading Panel for MT5 - similar expert with strong performance on MetaTrader 5.
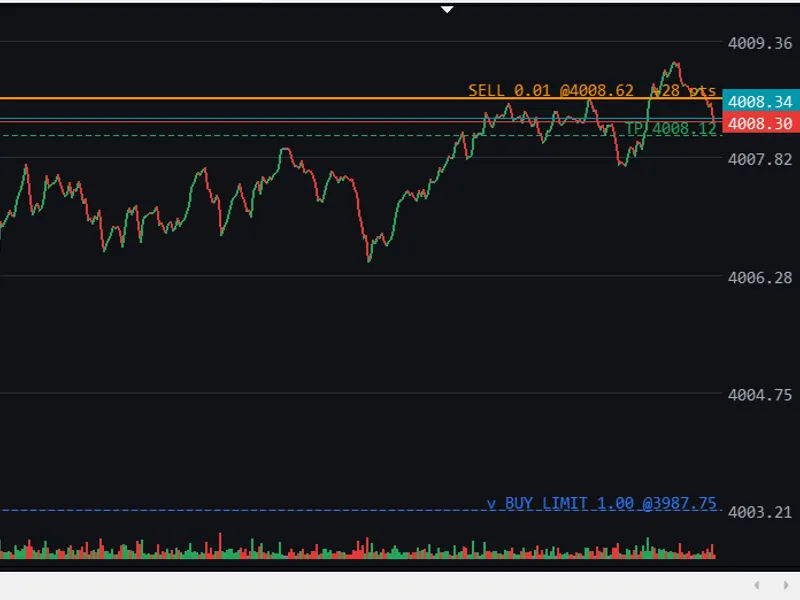
Tick Scalper Pro is a manual trading utility designed for traders operating on very short time frames who need to monitor every price fluctuation. It replaces the standard time-based chart with a compact tick chart and incorporates a panel for rapid order execution. Each tick is represented as a distinct bar, allowing for maximum ticks to be displayed on the screen. Up ticks are shown in green, down ticks in red, and unchanged ticks in grey.
A horizontal strip at the bottom of the chart displays each tick as a colored mark, with taller marks indicating larger price movements.
The Ticks/bar grouping feature allows users to consolidate ticks into bars, with options for 1, 2, 4, 8, and so on, ticks per bar.
An optional time scale is available, which sets a fixed number of pixels per second for a different visual layout compared to the compact tick-based approach.
The product supports both light and dark modes, with color customization available through input parameters.
Live BID and ASK lines, with a default thickness of 2 pixels and price tags, are updated with every incoming tick. The ASK line and its label are consistently red, while the BID line and its label are green, ensuring clear differentiation.
Vertical zoom is managed by dragging the price axis. Panning is done by dragging the chart itself. Double-clicking the axis or pressing 'Y Auto' resets the chart to automatically fit the visible ticks.
Trading Panel
The trading panel includes BUY and SELL buttons, along with a lot size field on a dedicated row.
Optional Take Profit and Stop Loss levels can be set in points. These are disabled by default. If a specified distance is smaller than the broker's minimum requirement (stop level plus spread), it will be adjusted to that minimum.
Functionality for closing positions includes Close Buy, Close Sell, Close Profit (only for profitable positions), and Close All orders for the current chart symbol.
Orders are submitted using pre-compiled requests to minimize processing time on the terminal side. Actual execution time is dependent on the broker, connection, and server.
Positions with Stop Loss or Take Profit levels within the broker's freeze level cannot be closed by the server at that moment. In such cases, the product will skip these orders and display a message instead of sending a rejected request.
Every order request is validated. If a request fails to send or is rejected by the server, the reason is displayed on the chart and recorded in the Experts log.
Open positions, pending orders, Stop Loss, and Take Profit levels are visually represented on the chart with details on side, volume, and current distance in points. The terminal's native trade history (deal arrows and lines) is suppressed while the product is active to maintain a clean tick chart view.
Compact, Movable Panel
The trading panel is designed to be compact and floats above all chart elements. Users can reposition it anywhere by dragging its title bar; the chosen position is saved for future sessions. The chart utilizes the full width of the window.
Depth of Market (DOM) Integrated with Chart
The DOM is displayed on the far right of the chart, occupying up to 20% of the chart's width by default. It utilizes depth-of-market data provided by the broker through MetaTrader 5 for the specific chart symbol.
Each displayed DOM level is rendered as an ask (red) or bid (green) line across the tick chart at its precise price. These lines have a default thickness of 2 pixels and adjust with the chart's price scale, including vertical zoom and panning. Brighter lines indicate larger volumes.
Each DOM line is connected by two diagonal lines to its corresponding thick DOM bar on the right, creating a prism-like visual connection between the chart and the DOM.
A small tick mark on the price axis adjacent to each DOM line allows for easy price reading. With the automatic vertical zoom ('Y Auto'), the chart scale encompasses the furthest displayed DOM ask and bid lines, ensuring all visible levels remain on screen at their true prices. After manual zoom or pan operations, the chart automatically resumes vertical zoom as soon as a displayed DOM line reaches the top or bottom edge of the chart (controlled by the 'InpDomAutoResume' input). Levels outside a manually zoomed view are shown as bars only, without connecting lines.
The DOM is enabled by default at startup ('InpDomShow' input); a dedicated DOM button allows users to hide it for the current session.
If the DOM cannot be loaded (e.g., broker does not provide depth of market data, or data is not arriving), it remains hidden, and a notification is displayed. It will automatically reappear when data becomes available or when the DOM button is pressed.
Note: Depth of market data is not available in the Strategy Tester.
DOM Control Functions
DOM Button: Quickly show or hide the DOM.
Level Button (Default): Displays volumes from 1 to 10 lots, up to 10 rows (5 asks and 5 bids).
Level Button (1st Click): Detailed view showing volumes from 10 to 100 lots, up to 20 rows (10 asks and 10 bids).
Level Button (2nd Click): Displays volumes from 1 to 100 lots, up to 20 rows.
Level Button (3rd Click): Shows volumes from 10 to 100 lots, up to 10 rows.
Level Button (4th Click): Returns to the default level view.
Drag DOM Left Edge: Adjusts the DOM width (adjustable via input, ranging from 8 to 50 percent).
The input parameters allow customization of band limits (1, 10, and 100 lots), the number of rows, and the volume unit. The volume divisor defaults to 100, as many feeds report 100 units per lot. This can be adjusted if the broker uses different units (setting to 0 uses the symbol's contract size). Volumes below the selected band's lower limit or above the upper limit are not displayed.
Placing Pending Orders at Clicked Price
Action: Ctrl + Left Click on the chart.
Result: Places a pending BUY order at the price under the cursor. The order type (limit or stop) is determined automatically.
Action: Shift + Left Click on the chart.
Result: Places a pending SELL order at the price under the cursor. The order type (limit or stop) is determined automatically.
Action: Holding a key while moving the mouse.
Result: A crosshair previews the price and the order type.
Action: Price within the broker's stops level.
Result: The order is not sent, and a message is displayed.
Strategy Tester and Backtesting Capabilities
The product can be tested in the MetaTrader 5 Strategy Tester using the following modes:
Tester Mode: Panel and Tick Chart.
Demonstration Rule: Typical Use.
Visual Mode: Available. The DOM area is not accessible in the tester. Buttons can be clicked during the test. This mode is enabled by default ('InpBtAuto') but can be disabled for manual trading only. It allows users to practice order handling on historical ticks at adjustable speeds.
Tester Mode: Non-visual.
Demonstration Rule: Available (faster testing).
Visual Mode: Enabled by default ('InpBtAuto').
This mode allows for unattended testing of order handling.
Tester Mode: Optimization.
Demonstration Rule: Not displayed. Enabled by default. Uses a custom criterion from OnTester() for analysis (net profit relative to equity drawdown). Compares input sets of the demonstration rule.
Live or Demo Chart Mode:
Panel and Tick Chart: Fully available.
Demonstration Rule: Never active.
Visual Mode: Manual trading only.
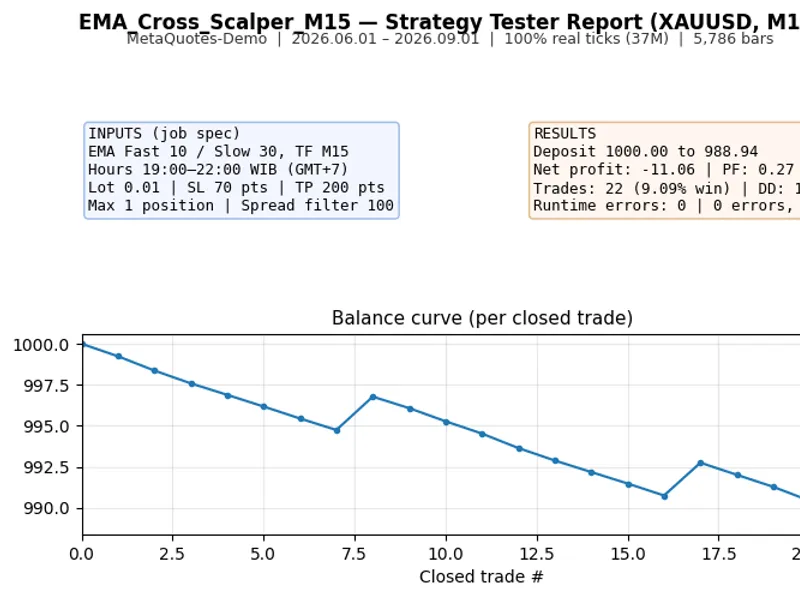
The demonstration rule simulates trading by waiting for a specific number of consecutive ticks in one direction, opening a position with predefined Stop Loss and Take Profit levels, and closing it based on SL, TP, or a maximum holding time. It performs checks for symbol trade mode, volume, and free margin before each order. This rule is solely for testing and demonstration purposes and does not constitute a trading recommendation. A session line on the chart displays closed trades, winning trade ratios, and the net result since the session began. For the most accurate results, use the "Every tick based on real ticks" model. Tester results are influenced by tick quality, spreads, commissions, execution delays, and broker conditions, and do not guarantee future performance.
Input Parameters
Group: Trading
Parameter: InpLots
Default: 0.01
Description: Default lot size.
Group: Trading
Parameter: InpDeviation
Default: 30
Description: Maximum slippage in points.
Group: Trading
Parameter: InpMagic
Default: 0
Description: Magic number (the demonstration rule uses this value + 1).
Group: Trading
Parameter: InpTPOn
Default: false
Description: Take Profit enabled at start.
Group: Trading
Parameter: InpTPPoints
Default: 50
Description: Take Profit distance in points.
Group: Trading
Parameter: InpSLOn
Default: false
Description: Stop Loss enabled at start.
Group: Trading
Parameter: InpSLPoints
Default: 50
Description: Stop Loss distance in points.
Group: Trading
Parameter: InpPendingClick
Default: true
Description: Ctrl/Shift + click places pending orders.
Group: Tick Chart
Parameter: InpTicksPerBar
Default: 1
Description: Ticks per bar at start.
Group: Tick Chart
Parameter: InpMaxTicksPerBar
Default: 4096
Description: Maximum ticks per bar for the '+' button.
Group: Tick Chart
Parameter: InpBarWidth
Default: 2
Description: Width of each tick/bar in pixels.
Group: Tick Chart
Parameter: InpLineWidth
Default: 2
Description: Line thickness in pixels.
Group: Tick Chart
Parameter: InpTimeMode
Default: false
Description: Time-scaled horizontal axis at start.
Group: Tick Chart
Parameter: InpPxPerSecond
Default: 10.0
Description: Time mode: pixels per second.
Group: Tick Chart
Parameter: InpPadPercent
Default: 5.0
Description: Vertical padding of the automatic zoom, in percent.
Group: Tick Chart
Parameter: InpSkipUnchanged
Default: true
Description: Ignore ticks where the BID did not change.
Group: Tick Chart
Parameter: InpPreloadTicks
Default: 10000
Description: Ticks loaded from history at start (live charts).
Group: DOM
Parameter: InpDomShow
Default: true
Description: Show the DOM at start.
Group: DOM
Parameter: InpDomWidthPct
Default: 20
Description: DOM width in percent of the chart width (8 to 50).
Group: DOM
Parameter: InpDomRowsDefault
Default: 10
Description: Rows (asks + bids) in the default and compact views.
Group: DOM
Parameter: InpDomRowsDetail
Default: 20
Description: Rows (asks + bids) in the detailed views.
Group: DOM
Parameter: InpDomLowLots
Default: 1.0
Description: Band lower limit in lots.
Group: DOM
Parameter: InpDomMidLots
Default: 10.0
Description: Band middle limit in lots.
Group: DOM
Parameter: InpDomHighLots
Default: 100.0
Description: Band upper limit in lots.
Group: DOM
Parameter: InpDomVolDivisor
Default: 100.0
Description: Feed volume units per lot (100 = 100 units is 1 lot; 0 = use contract size).
Group: DOM
Parameter: InpDomLineWidth
Default: 2
Description: Thickness of the DOM level lines and diagonals in pixels.
Group: DOM
Parameter: InpDomAutoResume
Default: true
Description: After a manual vertical zoom or pan, return to automatic zoom when a DOM line reaches the chart edge.
Group: DOM
Parameter: InpDomFitScale
Default: true
Description: Automatic zoom covers the furthest displayed DOM lines.
Group: Display
Parameter: InpDarkMode
Default: true
Description: Dark mode at start.
Group: Display
Parameter: InpShowBidAsk
Default: true
Description: Show BID and ASK lines.
Group: Display
Parameter: InpBidAskWidth
Default: 2
Description: BID and ASK line thickness in pixels.
Group: Display
Parameter: InpShowLevels
Default: true
Description: Show positions, pending orders, SL and TP.
Group: Display
Parameter: InpColUp / InpColDown
Default: green / red
Description: Up and down colours (also DOM bids and asks).
Group: Display
Parameter: InpColBid
Default: green
Description: BID line and label colour (fixed).
Group: Display
Parameter: InpColAsk
Default: red
Description: ASK line and label colour.
Group: Display
Parameter: InpColBuyLevel / InpColSellLevel
Default: blue / orange
Description: Buy and sell level colours.
Group: Display
Parameter: InpRenderMs
Default: 15
Description: Chart refresh interval in milliseconds.
Group: Backtest
Parameter: InpBtAuto
Default: true
Description: Run the demonstration rule in the Strategy Tester (never on live charts).
Group: Backtest
Parameter: InpBtTicks
Default: 4
Description: Entry: consecutive ticks in one direction.
Group: Backtest
Parameter: InpBtTP
Default: 40
Description: Take Profit in points.
Group: Backtest
Parameter: InpBtSL
Default: 60
Description: Stop Loss in points.
Group: Backtest
Parameter: InpBtMaxSpread
Default: 0
Description: Maximum spread to enter, in points (0 = off).
Group: Backtest
Parameter: InpBtMaxHoldSec
Default: 60
Description: Close the position after N seconds (0 = off).
Group: Backtest
Parameter: InpBtCooldownSec
Default: 10
Description: Pause after each entry in seconds.
How to Start
Attach the product to the chart of the symbol you wish to trade.
Enable Algo Trading in the terminal and on the product's Common tab.
Set the desired lot size in the panel and utilize the trading buttons.
Hover over the "Info" text in the panel for a list of available mouse actions.
Requirements and Notes
Requires MetaTrader 5. Compatible with hedging or netting accounts.
The Depth of Market (DOM) feature requires a depth-of-market feed from your broker for the selected symbol. Note that many brokers provide this data only for specific instruments.
The product operates on the symbol of the chart to which it is attached. Position and order management are exclusive to that symbol.
The product utilizes the chart area for its own graphical elements. Your original chart settings (chart type, grid, scales, colors, trade history display) are automatically restored when the product is detached from the chart.
Risk Warning
Trading leveraged products carries a high risk of loss. This product serves as a tool for order execution and chart visualization. It does not make trading decisions on live or demo accounts and does not guarantee or imply any profits. It is strongly recommended to test this product on a demo account before using it with real funds.
Support
For support, please use the comments section on the product page or send a direct message via MQL5. Kindly include the product version (displayed at the top of the chart), your terminal build number, and your broker's symbol name in your communication.
You may also like: EMA Cross Scalper for XAUUSD (M15) with WIB Session Filter - excellent alternative for expert users on MetaTrader 5.
Source Code
#property copyright "RobotFX"
#property version   "2.60"
#property description "This code is educational. Feel free to use, modify and upgrade as you wish. Visit ROBOTFX.ORG for professional trading tools"
#include <Canvas\Canvas.mqh>
input group "=== Trading ==="
input double InpLots          = 0.01;
input int    InpDeviation     = 30;
input ulong  InpMagic         = 0;
input bool   InpTPOn          = false;
input int    InpTPPoints      = 50;
.......
⚠ Limitations & Risk Warning
- This tool is provided for educational and testing purposes only.
- Past performance does not guarantee future results.
- Trading involves substantial risk of loss. Use on a demo account first.
- Results may vary depending on market conditions, broker, and settings.
- We recommend thorough backtesting and forward testing before using with real funds.