


Turtle Trading Channel Indicator
Info
The Turtle Trading Channel Indicator is a Indicator for MetaTrader 4 that this trend following system is based on the strategy designed by dennis gartman and bill eckhart, which focuses on breakouts of historical highs and lows for trade entry and exit. The system was taught to a group of individuals, demonstrating its effectiveness in transforming average traders into profitable ones.
Usage
This tool is typically used for enhancing chart analysis and decision making.
Platform
This Indicator works exclusively on MetaTrader 4 (both build 600+ and newer versions).
Setup
Place the downloaded file in MQL4/Indicators folder via File ? Open Data Folder in MetaTrader 4.
How to Install and Use Turtle Trading Channel Indicator
1. Installation: Place your file in the MQL/Indicators folder via "Open Data Folder" and restart your terminal.
2. Loading: Find the indicator in the Navigator, drag it onto your chart, and configure the input parameters in the popup window.
3. Customization: Press Ctrl+I to open the indicator list, select your tool, and click "Properties" to change colors, levels, or visual styles.
4. Updating: Replace the old file in the Indicators folder with the new version and restart the platform to apply changes.
Frequently Asked Questions
Q: Why is my indicator not showing? A: Verify the file is in the MQL/Indicators folder, or try right-clicking the "Indicators" tree in the Navigator and clicking "Refresh."
Q: Do custom indicators slow down the platform? A: Too many complex indicators can impact performance; remove unused ones via the "Indicator List" (Ctrl+I).
Q: Can I use MT4 indicators on MT5? A: No, MQL4 and MQL5 are distinct languages; ensure the indicator is compiled specifically for your platform version.
What this tool does
This trend following system is based on the strategy designed by Dennis Gartman and Bill Eckhart, which focuses on breakouts of historical highs and lows for trade entry and exit.
Typical Use Case
This Indicator excels in automated trading and technical analysis on MetaTrader 4.
Compatible Platform & Setup
This Indicator works on MetaTrader 4. Place the file in the MQL4/Indicators folder and restart the terminal.
Description & Settings
Related: bars alligator trading advisor - another powerful indicator for MetaTrader 4 traders.
This trend following system is based on the strategy designed by Dennis Gartman and Bill Eckhart, which focuses on breakouts of historical highs and lows for trade entry and exit.Also recommended: spread indicator for pair trading - similar indicator with strong performance on MetaTrader 4.
The system was taught to a group of individuals, demonstrating its effectiveness in transforming average traders into profitable ones.
The core principle is to 'trade an n-day breakout and take profits when an m-day high or low is breached, where n is greater than m'.
Examples:
- Buy on a 10-day breakout and close the trade when price action reaches a 5-day low.
- Short on a 20-day breakout and close when price action reaches a 10-day high.
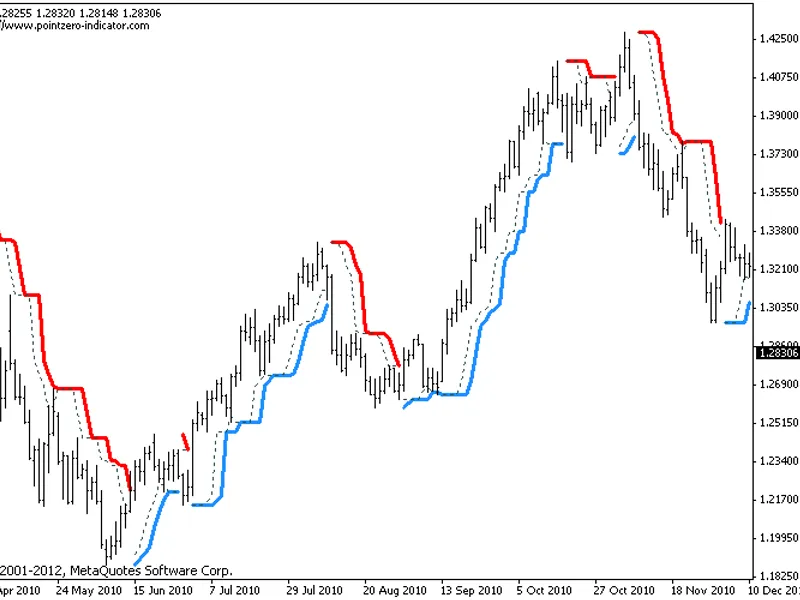
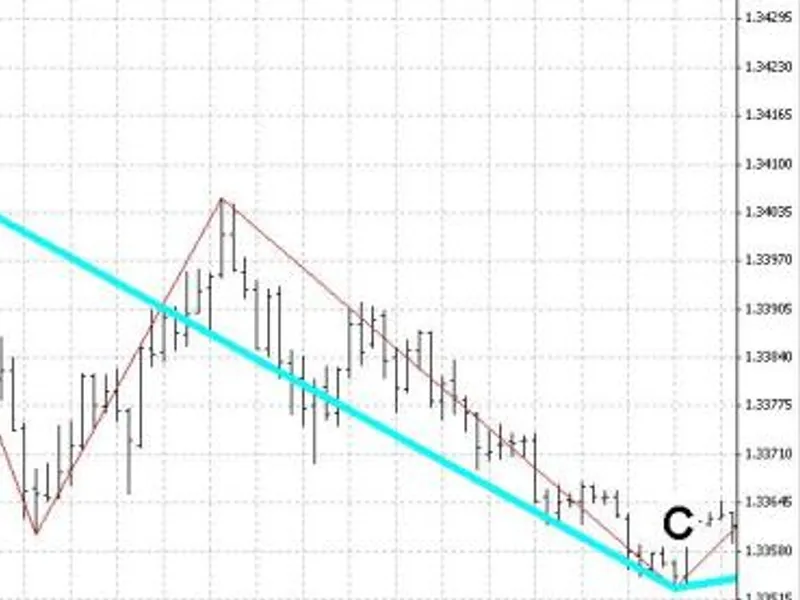
In the indicator, the red and blue lines represent the trading signals, while the dotted line indicates the exit signal.
Original system rules:
- Go long when the trading line turns blue.
- Go short when the trading line turns red.
- Exit long positions when the price touches the exit line.
- Exit short positions when the price touches the exit line.
The recommended initial stop-loss is ATR * 2 from the opening price. The default system parameters were 20,10 and 55,20.
This indicator is designed to be used in conjunction with another indicator to represent the same period or the failsafe trading system, providing additional signals in case of stop-outs. Both indicators include trading alerts, which can be enabled or disabled as needed.
To replicate the original turtle rules, set up two indicators:
Main indicator (S1):
- TradePeriod = 20
- StopPeriod = 10
Failsafe indicator (S2):
- TradePeriod = 55
- StopPeriod = 20, using a different color
Entry strategy using S1:
- Buy 20-day breakouts using S1 only if the last signaled trade was a loss.
- Sell 20-day breakouts using S1 only if the last signaled trade was a loss.
- If the last signaled trade by S1 was a win, do not trade, regardless of direction or whether the last signal was traded.
Entry strategy using S2:
- Buy 55-day breakouts only if you ignored the last S1 signal and the market is rallying.
- Sell 55-day breakouts only if you ignored the last S1 signal and the market is falling.
Position sizing strategy:
Once a trading decision is made:
- Enter the market with 2% risk and place a stop-loss 2ATR from the opening price.
- If the position moves in your favor by 1/2ATR, enter again with 2% risk and trail all stop-losses 2ATR from the current price, up to 4 positions.
Exit strategy:
- Exit longs taken using S1 when price action closes below a 10-day low.
- Exit shorts taken using S1 when price action closes above a 10-day high.
- Exit longs taken using S2 when price action closes below a 20-day low.
- Exit shorts taken using S2 when price action closes above a 20-day high.
Money management:
Initial position risk is 2%, adjusted based on account drawdown:
- 10% drawdown: reduce risk by 20% for each trade.
- 20% drawdown: reduce risk by 40% for each trade.
- 30% drawdown: reduce risk by 60% for each trade.
For an n% drawdown, decrease risk by n*2% for each trade.
Additional considerations:
- The TradePeriod must always be higher than the StopPeriod.
- 2026-06-12: Indicator update included enabling the strict mode from the same file.
You may also like: the little whore trading strategy - excellent alternative for indicator users on MetaTrader 4.
Source Code
#property copyright "robotfx"
#property link "https://robotfx.org"
#property indicator_chart_window
#property indicator_buffers 6
#property indicator_color1 dodgerblue
#property indicator_color2 red
#property indicator_color3 darkslategray
#property indicator_color4 darkslategray
#property indicator_color5 dodgerblue
#property indicator_color6 red
.......
⚠ Limitations & Risk Warning
- This tool is provided for educational and testing purposes only.
- Past performance does not guarantee future results.
- Trading involves substantial risk of loss. Use on a demo account first.
- Results may vary depending on market conditions, broker, and settings.
- We recommend thorough backtesting and forward testing before using with real funds.