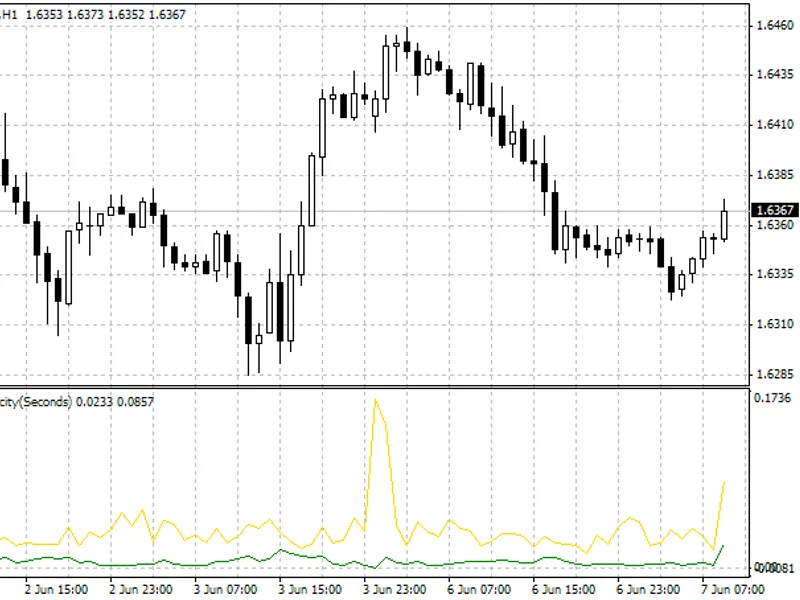
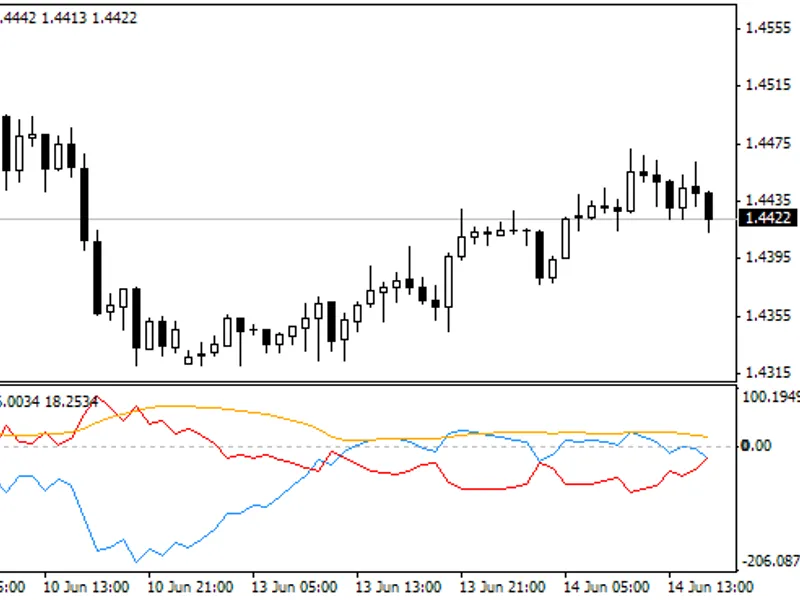
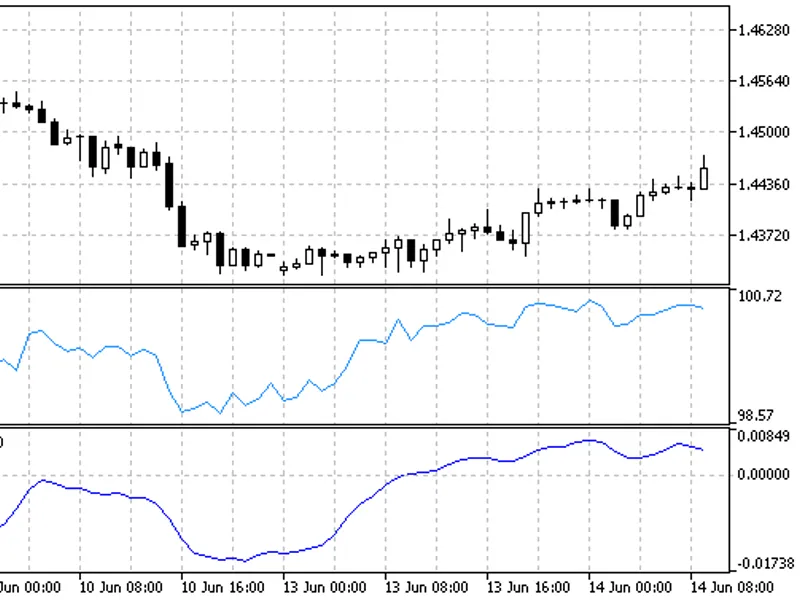
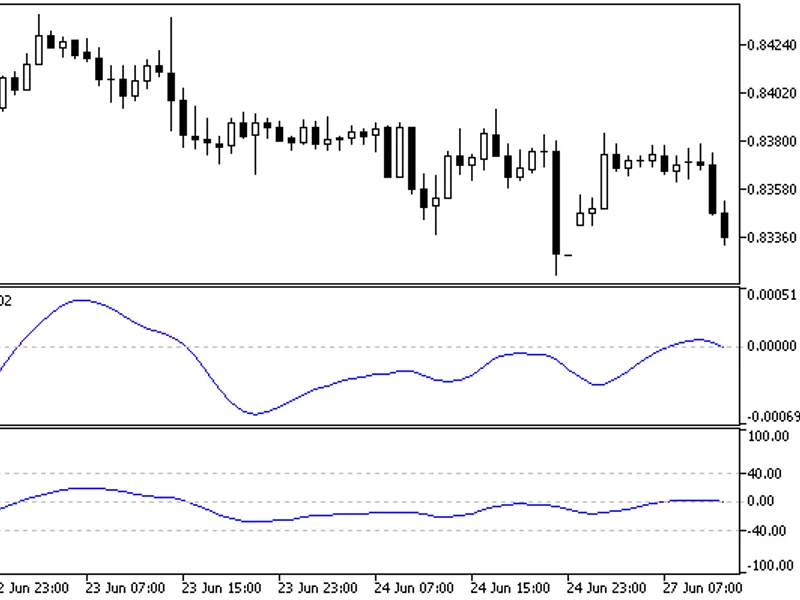
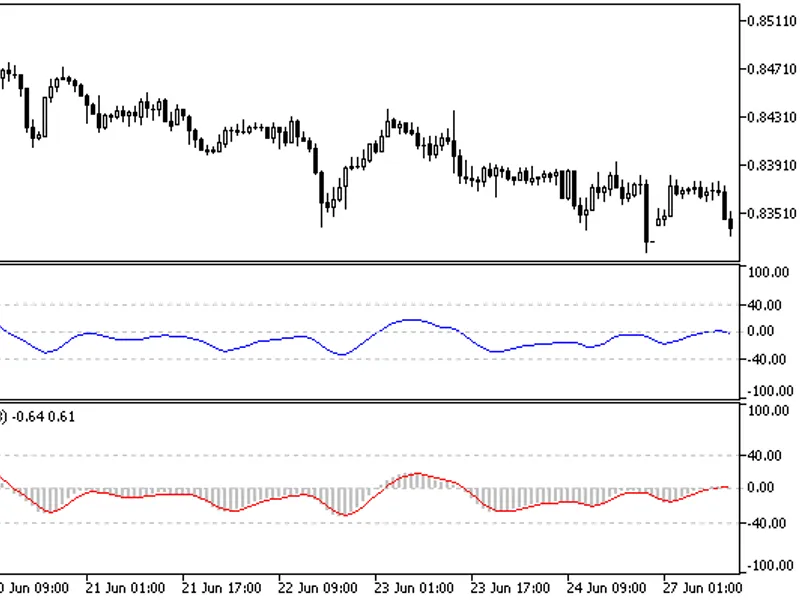
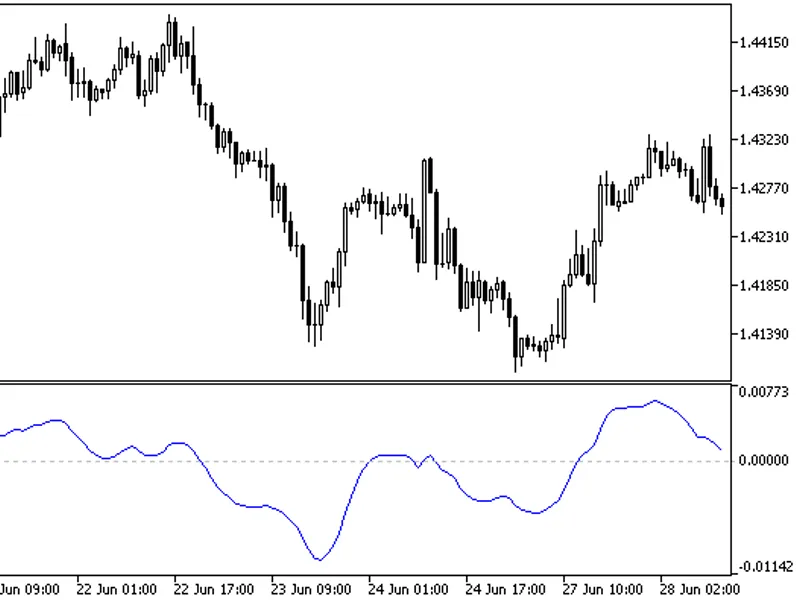
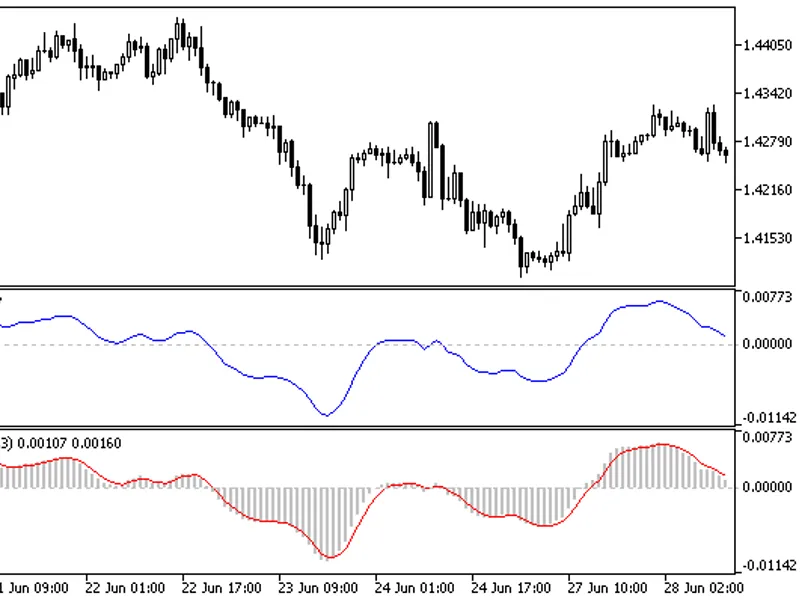
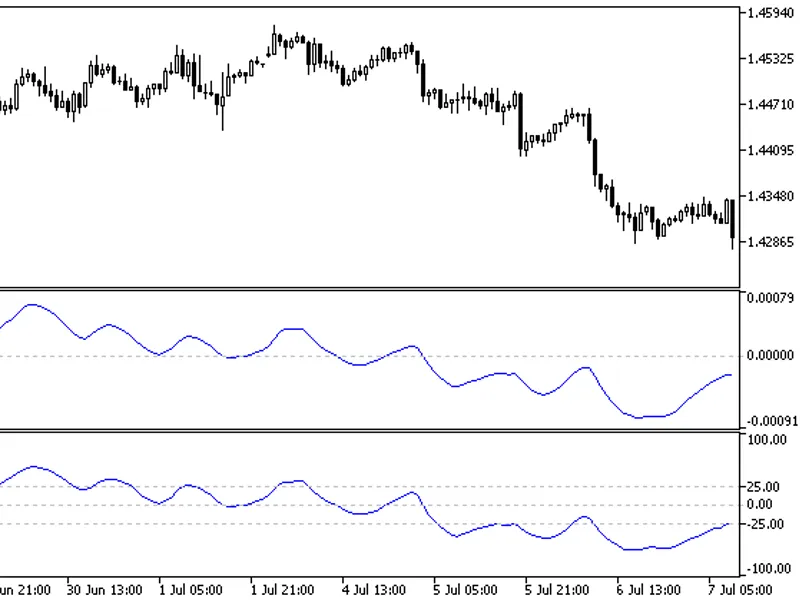
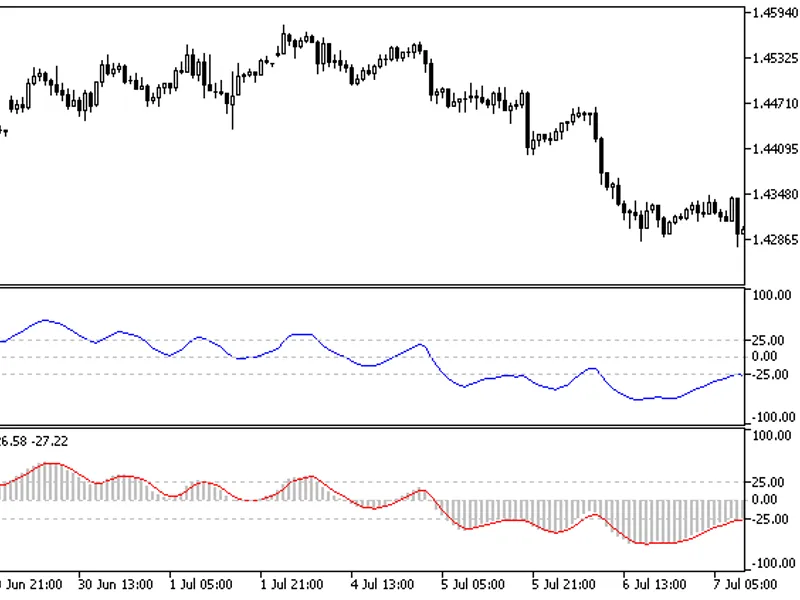
Velocity is calculated as the difference between the high and low price of a bar, divided by time. The time period can be set to minutes, hours, or days, with seconds as the defaul...
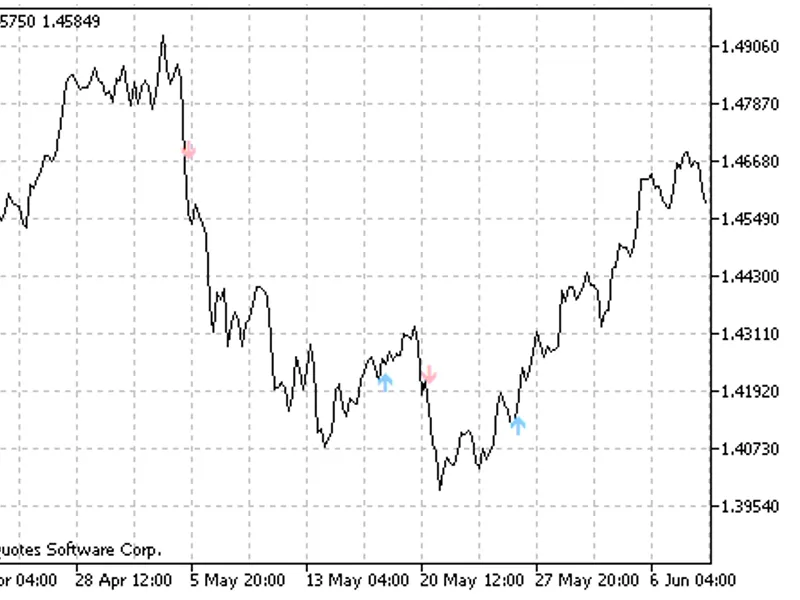
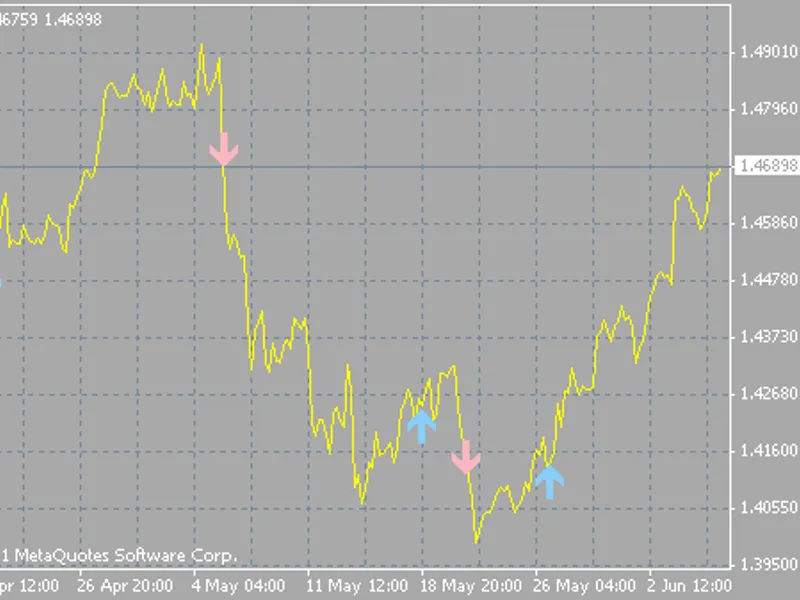
The buy/sell signals of the indicator are based on the crossover of two moving averages with different periods.The indicator includes the following features:- A filter based on the...
The buy/sell signals of the indicator are based on the crossover of two moving averages (MA) with different periods.Indicator Features- Filter based on RSI (Relative Strength Index...
Channel Scalper M1-M15
An indicator designed for scalping strategies on M1 and M15 timeframes.This indicator facilitates an easy channel trading strategy. The recommended approach...
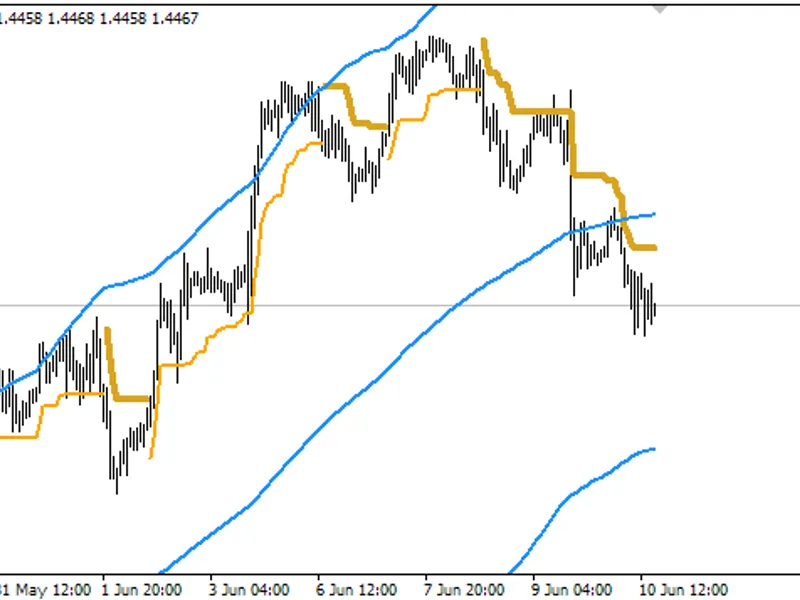
Bollinger Bands Breakout Indicator and Band Width AnalysisThis indicator visualizes Bollinger Bands breakouts and calculates the width of the bands.Version 1 Features:- An orange l...
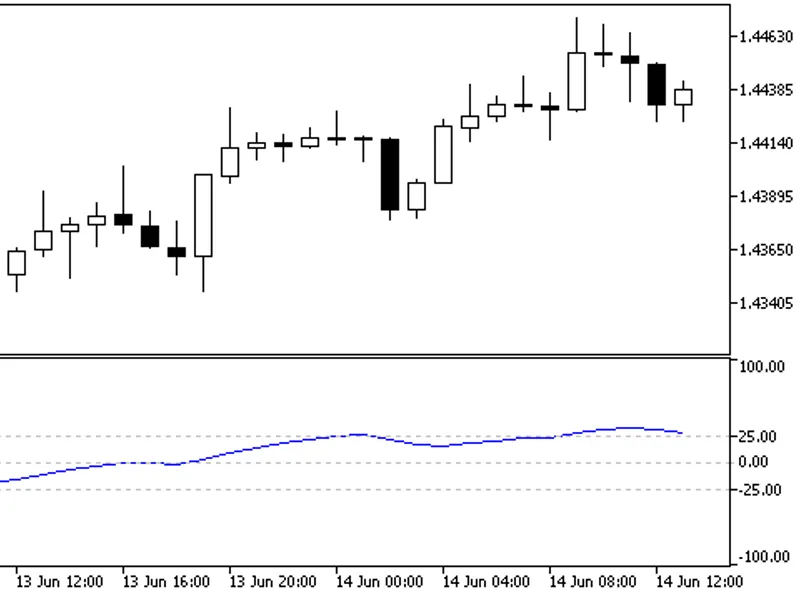
Blau Momentum Indicator (MTM) by William Blau.
This indicator calculates the absolute price change and applies smoothing, offering a different approach compared to the standard bui...
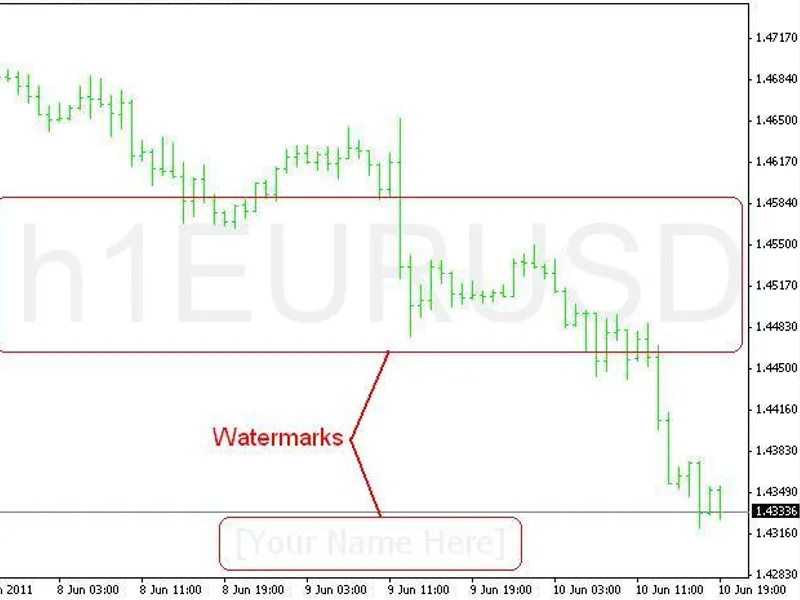
Displays the current timeframe and symbol name in a large font on the chart background.This is useful when frequently switching between charts with different symbols.InstructionsSe...
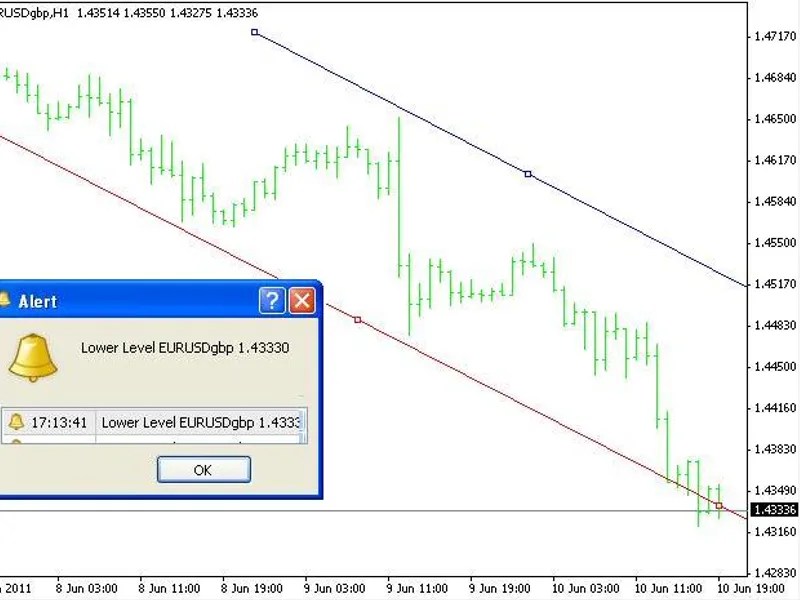
This indicator draws two trendlines on the chart.The trendlines, which can be repositioned, serve as upper and lower alert levels.An alert is triggered when the mid-price crosses e...
True Strength Index Indicator by William Blau.True Strength Index(TSI, Q-Period Smoothed Momentum) is a normalized momentum indicator developed by William Blau. The indicator value...
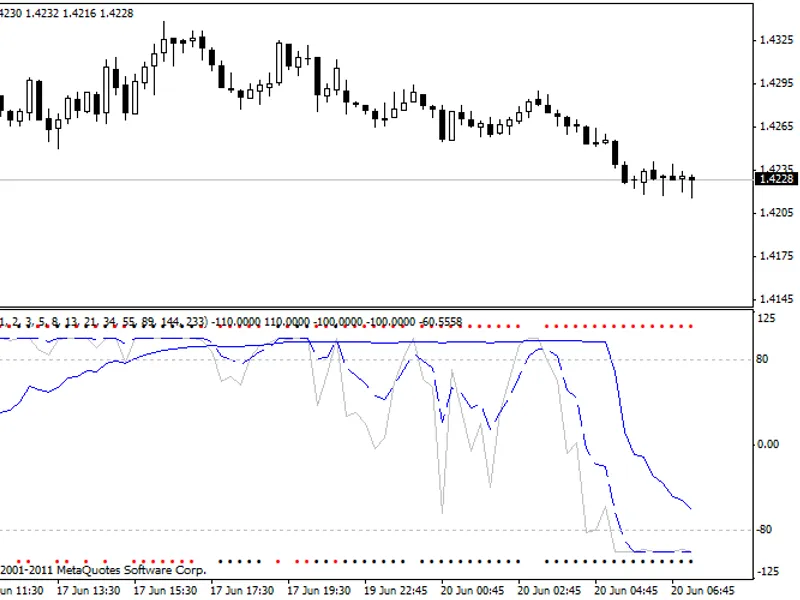
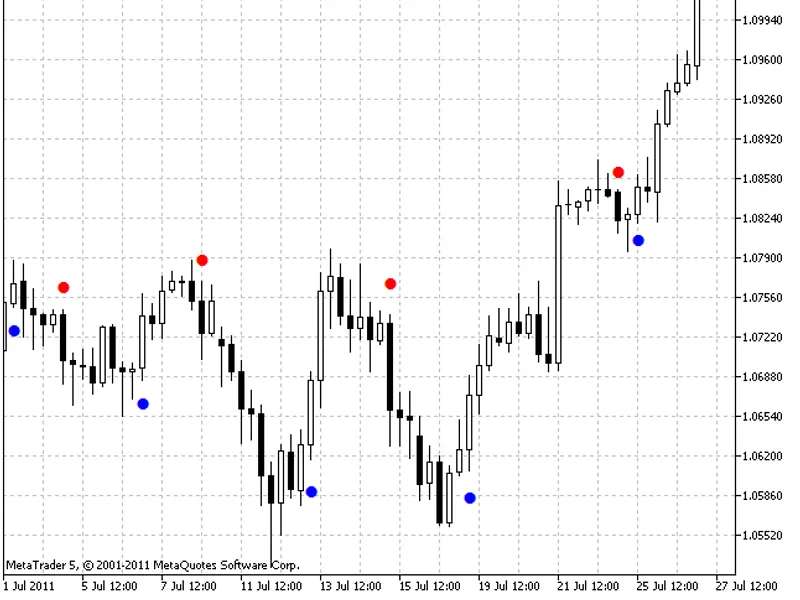
This indicator calculates the correlation between Moving Averages (MAs) of different periods.Indicator Lines:- Black/Red Dots: Display buy (above chart) or sell (below chart) signa...
This indicator was originally presented in the October 2010 issue of Stocks & Commodities magazine and received the Reader's Choice Award in 2011.The indicator starts by smoothing ...
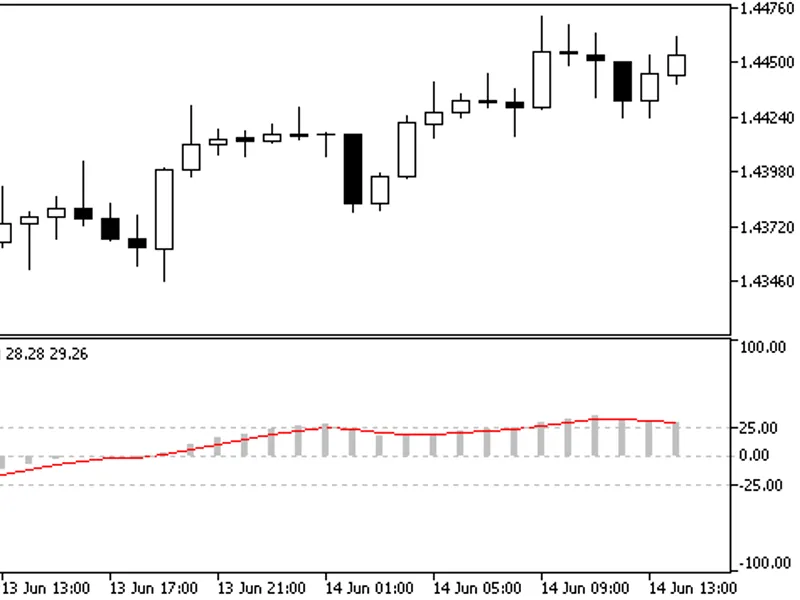
The Ergodic Oscillator, developed by William Blau, is an indicator designed to signal trend reversals.It utilizes a signal line for identifying potential changes in trend direction...
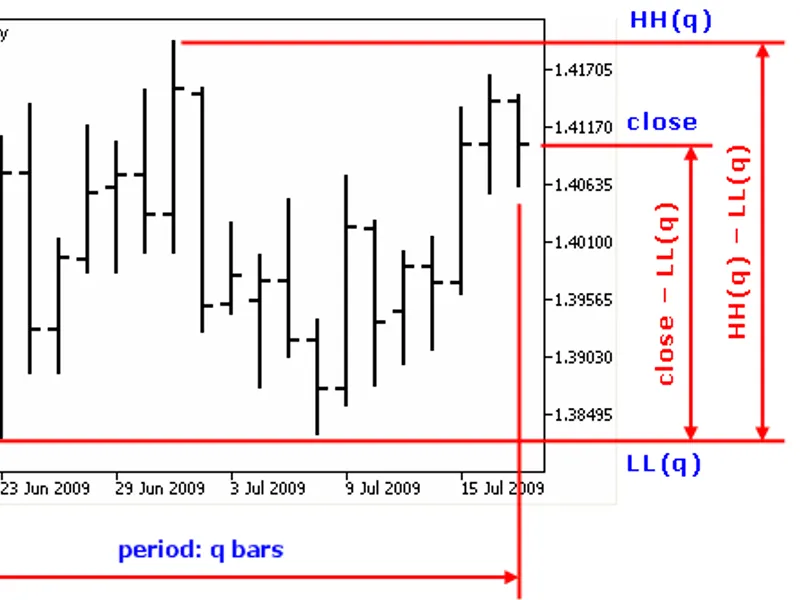
Smoothed Q-Period Stochastic Indicator by William Blau
This indicator is based on the standard stochastic indicator and calculates the distance between the current closing price a...
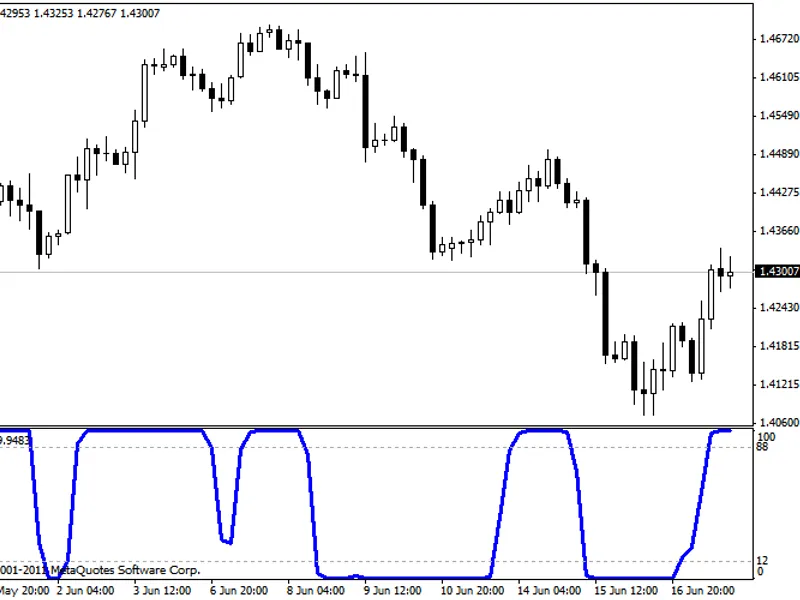
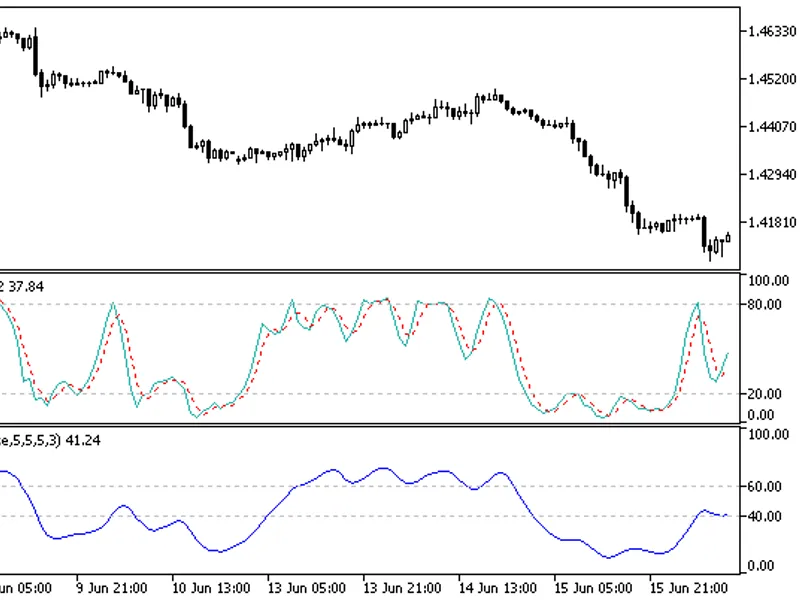
Stochastic Index (Normalized Smoothed Q-Period Stochastic) by William Blau.
This indicator normalizes and maps the values of a Q-period smoothed stochastic into the [0, 100] interv...
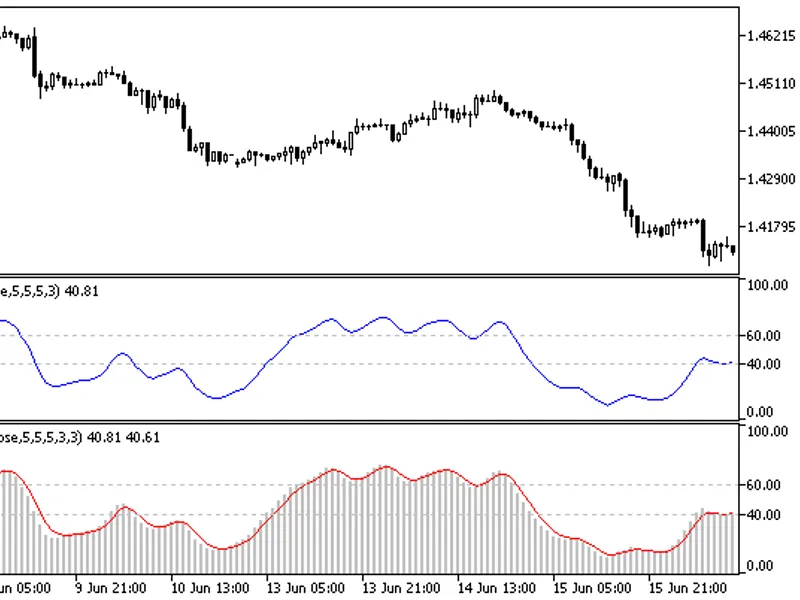
Stochastic Oscillator Blau TS is based on the work of William Blau.
Installation:
Place the file willamblau.mqh in the following directory:
terminal_data_folder\mql5\include\
Pla...
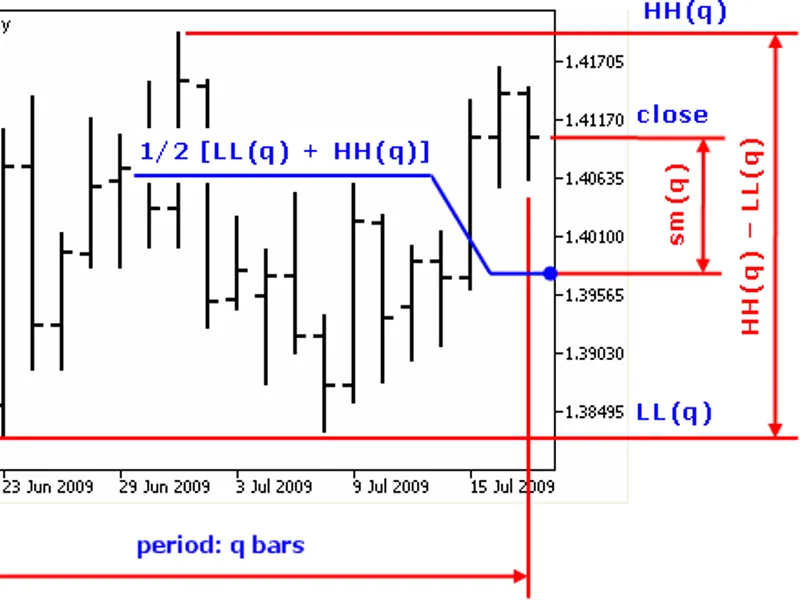
Stochastic Momentum (SM) Indicator by William BlauThe Q-period Stochastic Momentum is defined as the distance of the current close price from the midpoint of the Q bars.The value o...
Stochastic Momentum Index (SMI) by William Blau is based on the indicator. The Stochastic Momentum Index is normalized to half of a Q-period price range and mapped into the [–100,+...
Stochastic Momentum Oscillator by William Blau
This indicator is based on the Stochastic Oscillator.
To use this indicator, you need to place the following files in the specified...
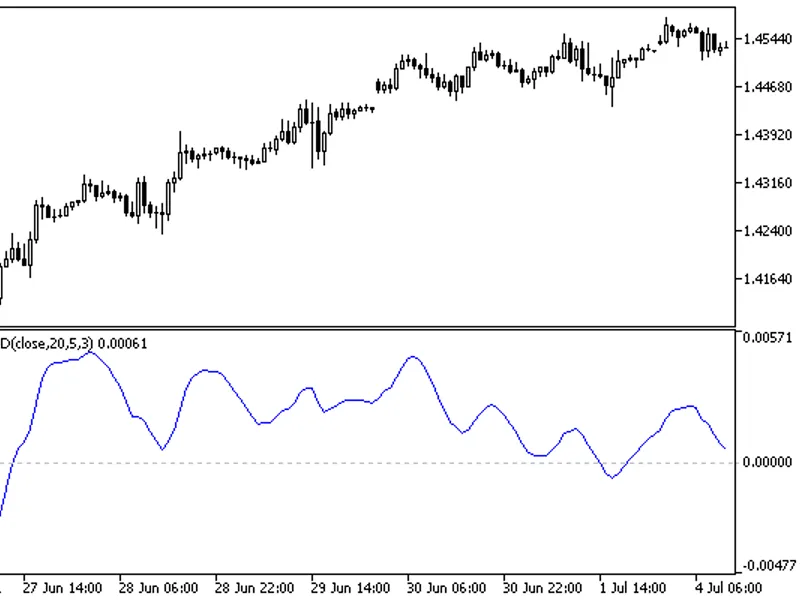
Ergodic MDI (Mean Deviation Index) is a double-smoothed version of the Mean Deviation Index. The mean deviation is defined as the distance between the closing price and an exponent...
Ergodic MDI Oscillator by William Blau is based on.Usage:williamblau.mqh must be placed in terminal_data_folder\mql5\include\blau_ergodic_mdi.mq5 must be placed in terminal_data_fo...
The Moving Averages Convergence/Divergence indicator is a technical indicator that calculates the difference between two moving averages.
It is the difference between two exponent...
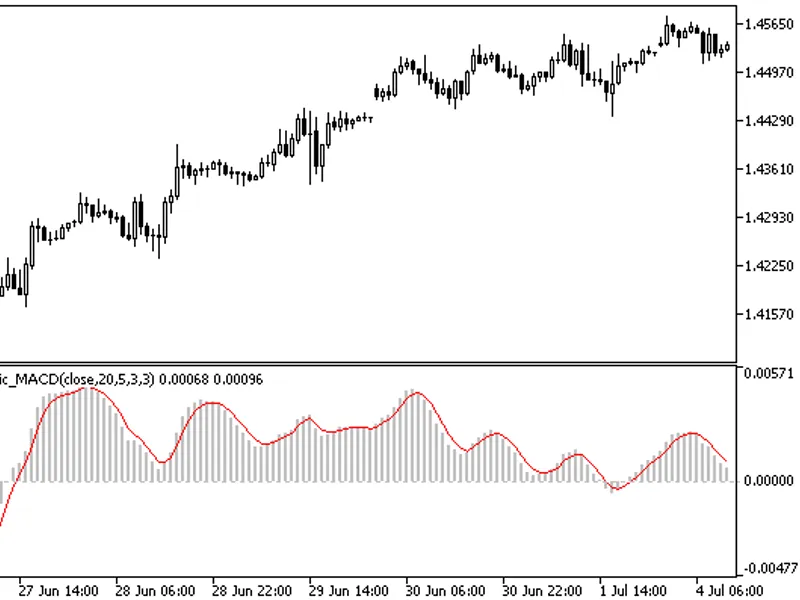
The Ergodic MA C D Oscillator is described in a book by William Blau. To use this oscillator, the williamblau.mqh file must be placed in the terminal_data_folder\mql5\include\ dire...
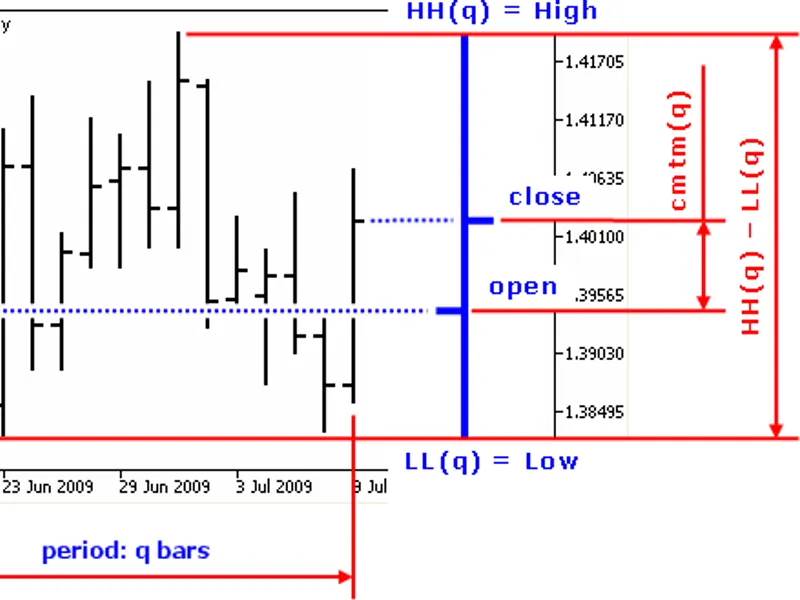
Candlestick Momentum Indicator (Q-Period Candlestick Momentum) by William Blau.To use this indicator, place the williamblau.mqh file in your terminal_data_folder/mql5/include/ dire...
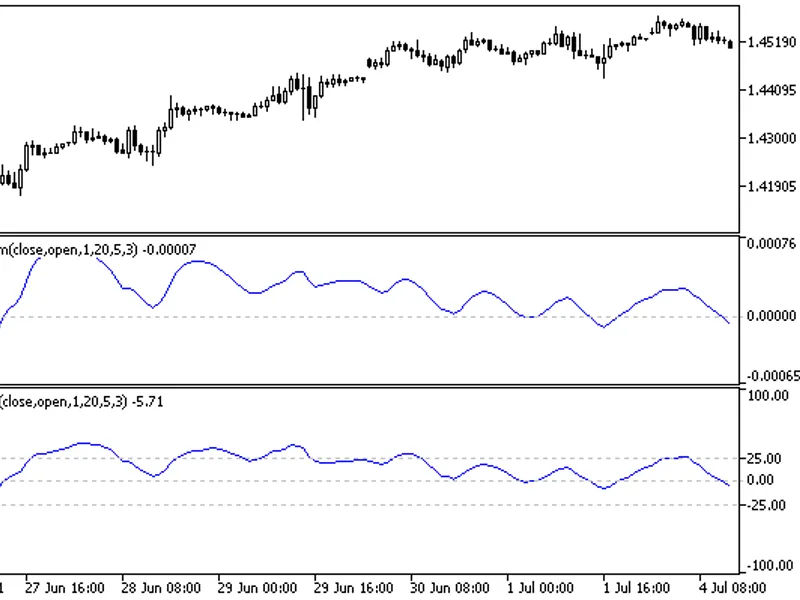
Candlestick Momentum Index (CMI) IndicatorThe Candlestick Momentum Index (CMI) is an indicator described by William Blau. This indicator is normalized and mapped to the [-100, +100...
Candlestick Index (CSI) is a technical indicator that is based on the concept of candlestick momentum and is used to identify overbought and oversold states of the market.The value...
Ergodic CM Oscillator by William Blau
Installation:
Place williamblau.mqh in the terminal_data_folder/mql5/include/ directory.Place blau_cmi.mq5 in the terminal_data_folder/mql5/i...
The Ergodic CSI Oscillator is described in a book by Blau.
To use this oscillator, certain files must be placed in specific folders:
- williamblau.mqh must be placed in the termi...
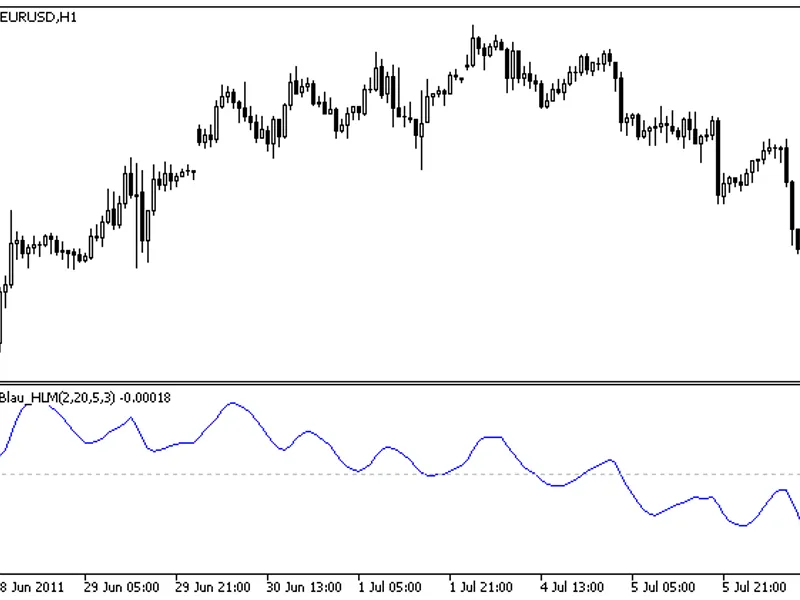
Composite High/Low Momentum Indicator
The Composite High/Low Momentum indicator is based on the work of William Blau.
Installation:
Place williamblau.mqh in the following directo...
The Directional Trend Index (DTI) indicator is based on a calculation described by William Blau.To use this indicator:Place the williamblau.mqh file in your MetaTrader terminal's M...
Ergodic DTI-Oscillator is described in a book by William Blau in 2026.To use this indicator, williamblau.mqh must be placed in the terminal_data_folder\mql5\include\ directory and ...
This is a moving average indicator based on the Fibonacci sequence.Indicator ParametersThe following parameters can be adjusted:- nappliedprice: the price type to use for calculati...
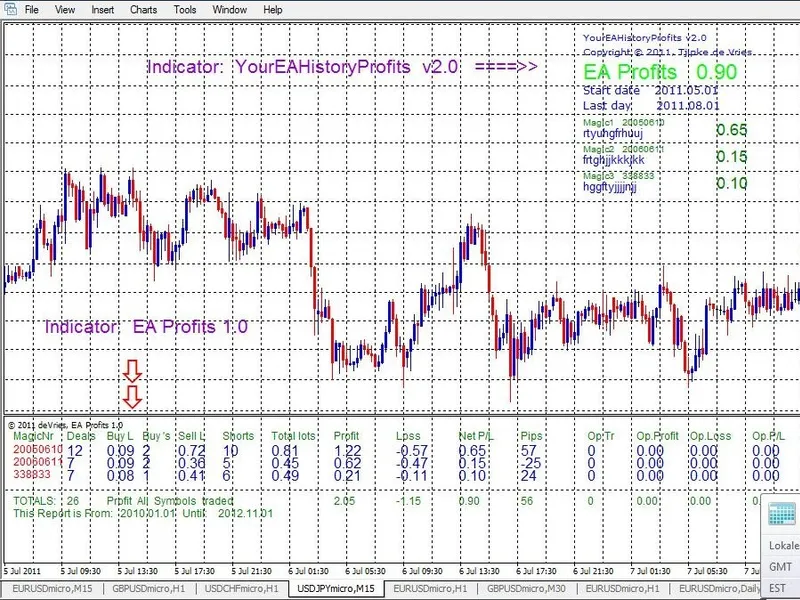
EA Profit History VisualizationThis indicator displays the profits generated by your Expert Advisors (EAs) on a specific account within a chosen period. It combines two indicators ...
This indicator calculates and displays the highest and lowest values of a data series over a specified number of bars (N).The development was motivated by the need for a clear solu...
Price Alert MetaTrader IndicatorThis indicator plays sound alerts when the price reaches levels specified by the trader.There are three types of alerts:- Alert when the price rises...
Standard Heiken Ashi indicator with the added functionality to spot and highlight Doji candles.This indicator identifies Doji candles by checking if the candle's body is less than ...
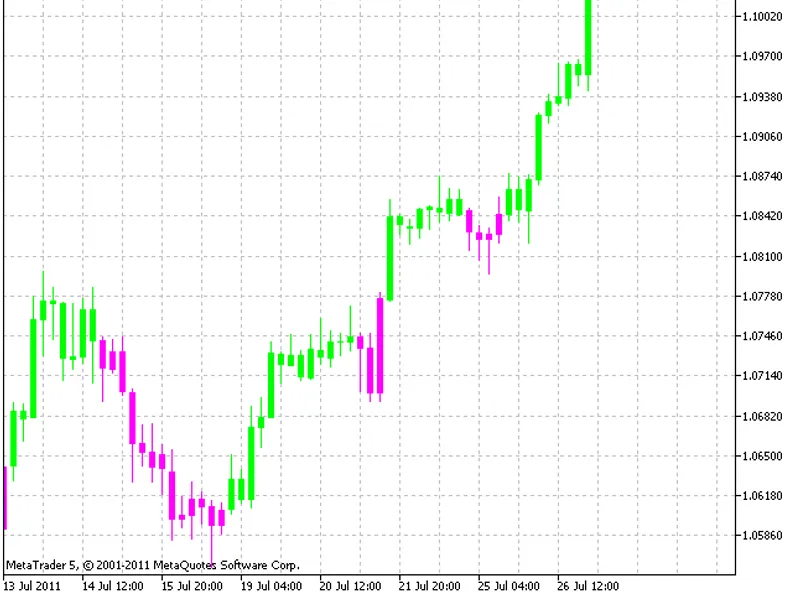
BrainTrend2 is a market trend indicator that colors candlesticks based on trend direction.During a downward trend, all candlesticks are colored magenta.As soon as the trend becomes...
BrainTrend2 Signal is a market trend indicator that assigns colors to candlesticks based on the trend direction.During a downward trend, all candlesticks are colored red.As soon as...
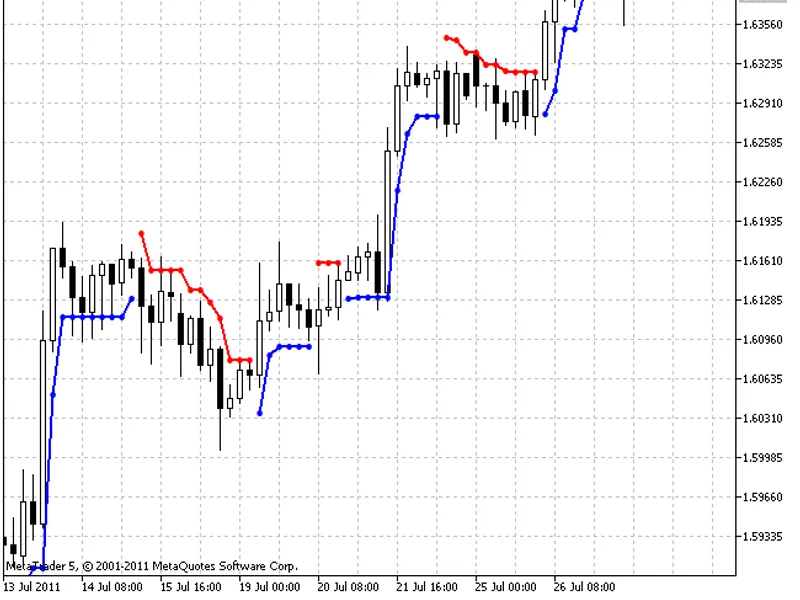
BrainTrend2Stop is a trend reversal detection indicator visualized as a stop line.The intersection of this line signals a trend reversal and indicates the optimal time to close exi...
This strategy combines a Moving Average (MA) crossover with Relative Strength Index (RSI) and Moving Average Convergence Divergence (MACD) confirmation for trade signals.The entry ...
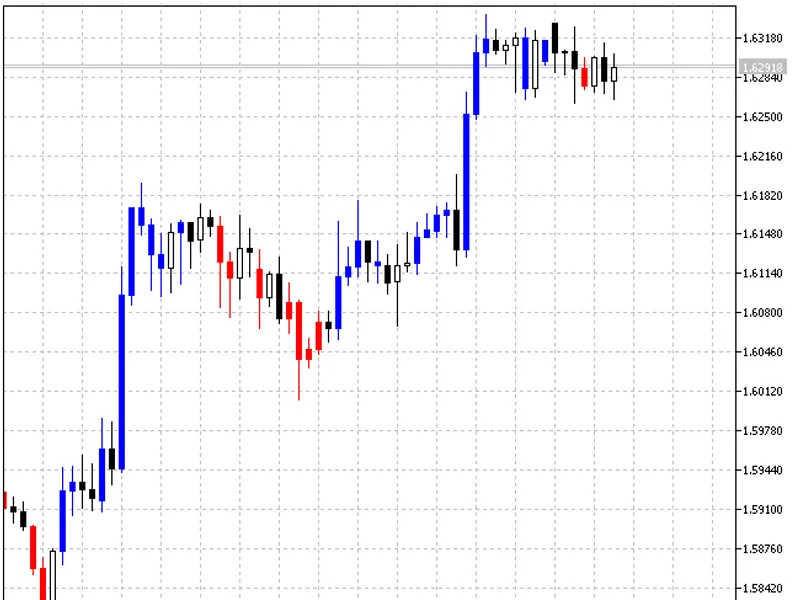
BrainTrend1 is a market direction indicator.It indicates trend directions using colors.When the price changes or stays in an up-trend, the candlesticks are colored blue.When the pr...
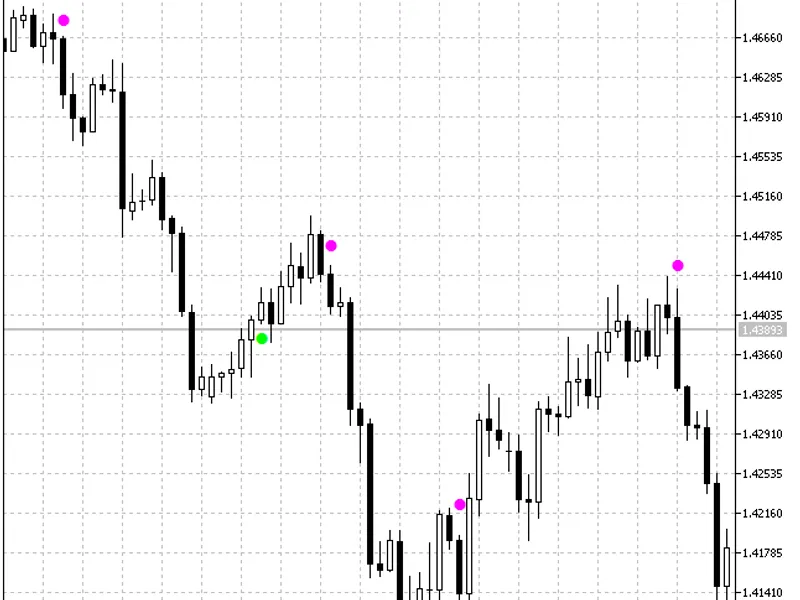
Brain Trend 1 Sig is a market indicator designed to signal positions opening and closing.It identifies potential trend reversal points when the price reaches extreme values, indica...
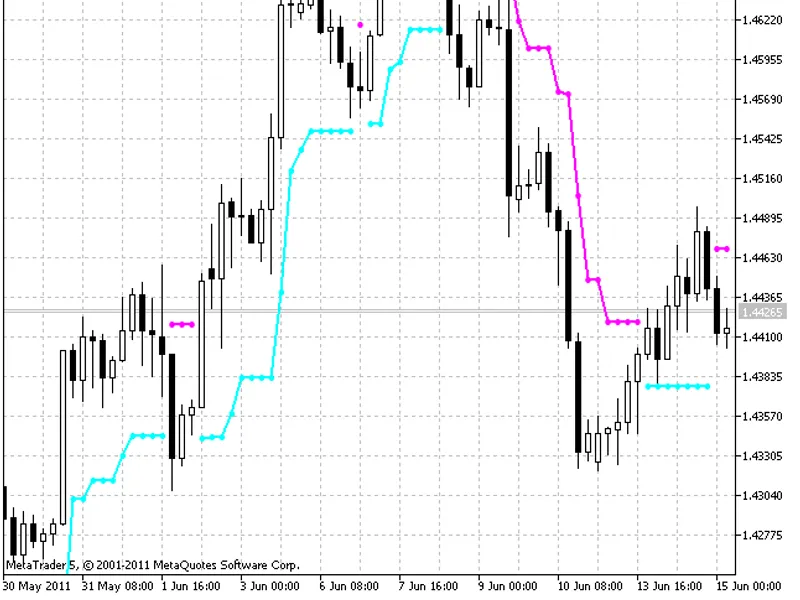
BrainTrend1Stop is a trend reversal indicator. The intersection of the stops line by a price indicates a trend reversal and the time to close previously opened positions.The cyan l...
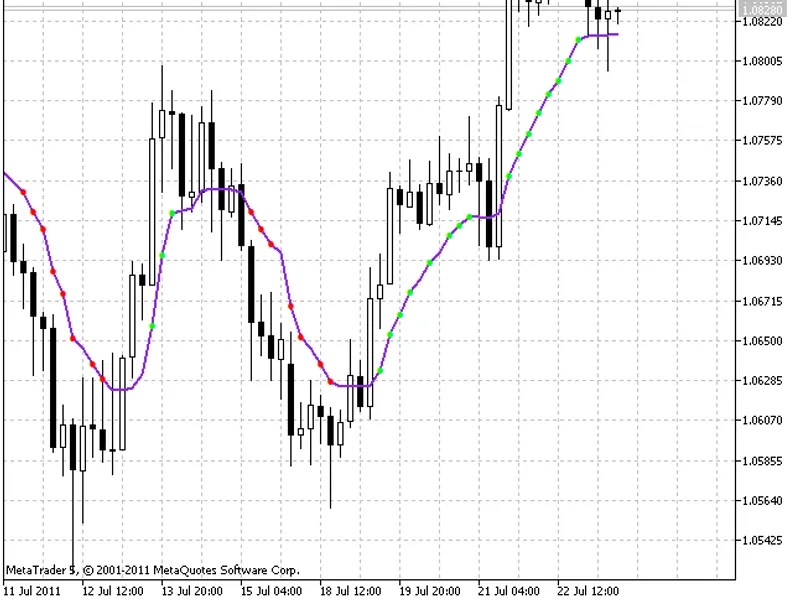
Perry Kaufman's Adaptive Indicator with signal points based on standard mean-square deviation.Signal points interpretation:If the market is flat, the AMA indicator is horizontal wi...
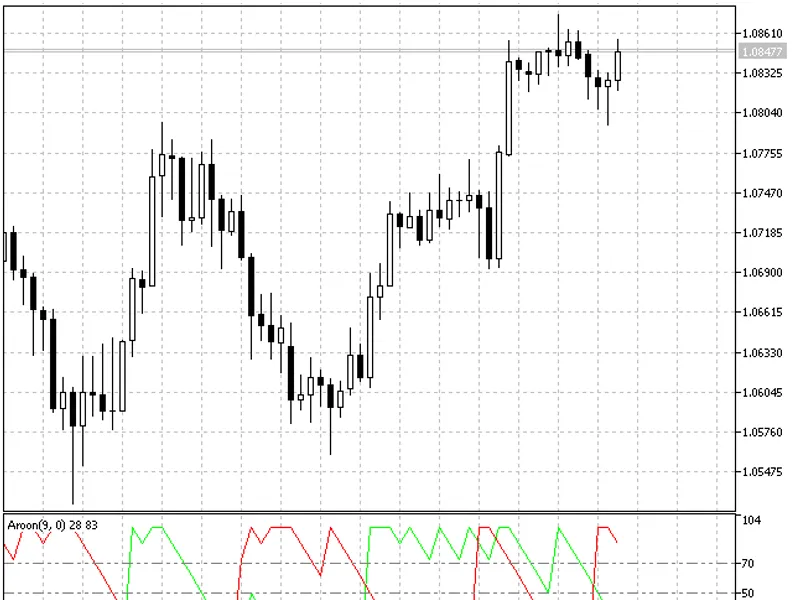
The Aroon indicator is a technical analysis tool used to determine the beginning of a new trend or the end of an existing trend.Key Features- The Aroon indicator can be calculated ...
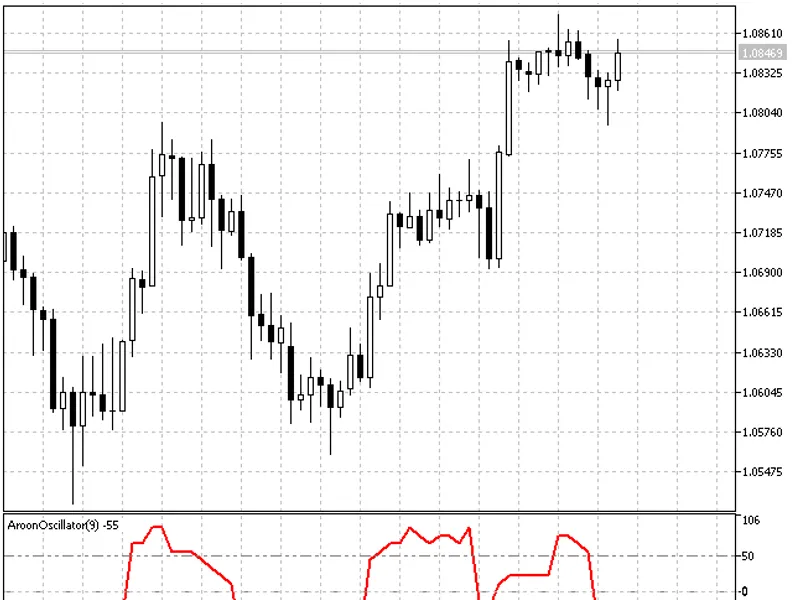
The Aroon Oscillator predicts price changes from trend to flat market conditions.Aroon OscillatorThe Aroon Oscillator calculation includes three main signals.Reaching critical valu...
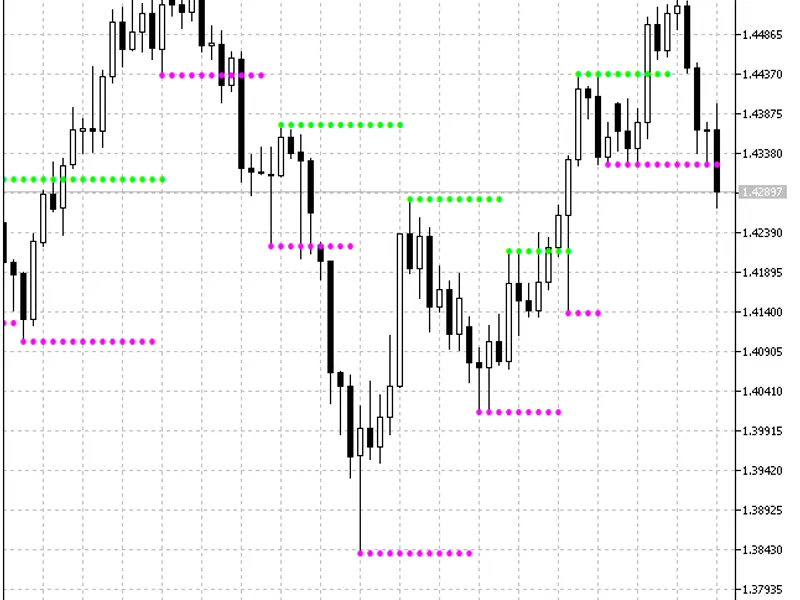
The Support and Resistance indicator shows the support and resistance levels using the indicator.
The calculation of support levels is based on the fractals down, the calculation o...
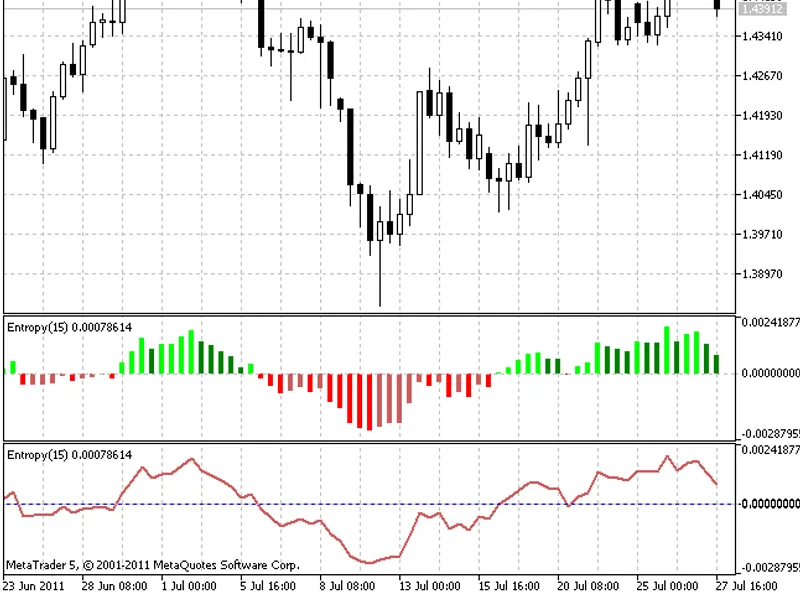
The entropy is the measure of the disorder of the system. It is calculated using the formula.Indicator OverviewThe entropy indicator can be evaluated according to its indicative at...
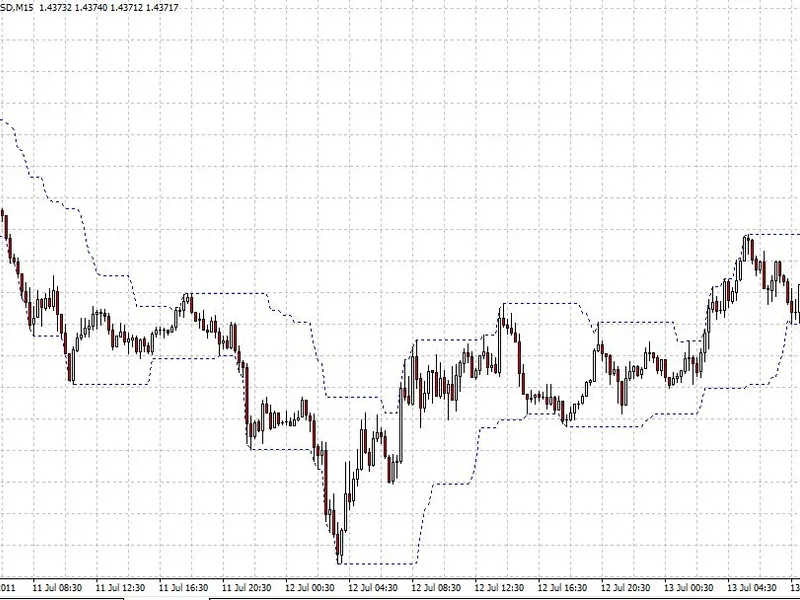
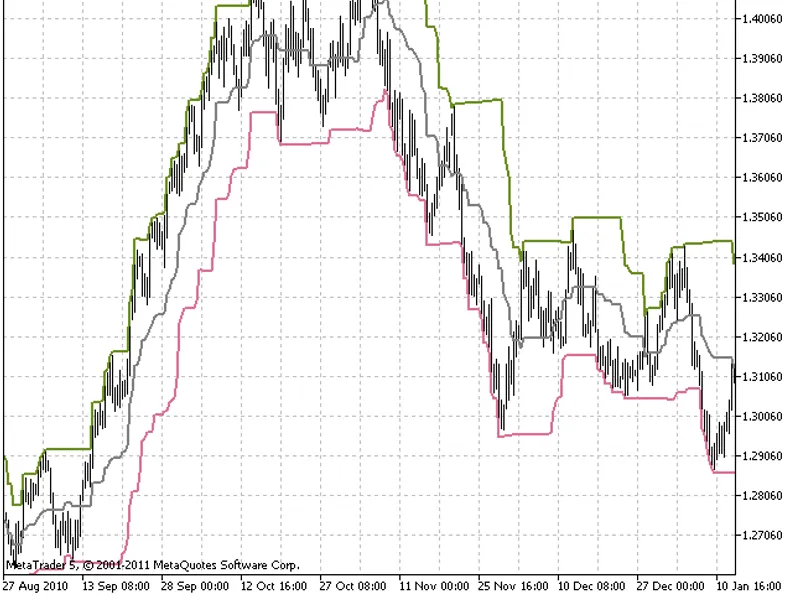
Donchian Channels is a volatility indicator that calculates the current price range using the highest highs and lowest lows over a defined period.To calculate the channel, the indi...