Candlestick Index Blau CS I
This professional-grade solution for MetaTrader 5 helps traders achieve greater efficiency in their daily workflow. This technical indicator acts as a specialized analysis tool designed to visualize market data. It helps traders identify emerging trends, momentum shifts, and key support or resistance levels by plotting statistical calculations directly onto price charts.
How to Setup and Use Candlestick Index Blau CS I
1. Installation: Place your file in the MQL/Indicators folder via "Open Data Folder" and restart your terminal.
2. Loading: Find the indicator in the Navigator, drag it onto your chart, and configure the input parameters in the popup window.
3. Customization: Press Ctrl+I to open the indicator list, select your tool, and click "Properties" to change colors, levels, or visual styles.
4. Updating: Replace the old file in the Indicators folder with the new version and restart the platform to apply changes.
Frequently Asked Questions
Q: Why is my indicator not showing? A: Verify the file is in the MQL/Indicators folder, or try right-clicking the "Indicators" tree in the Navigator and clicking "Refresh."
Q: Do custom indicators slow down the platform? A: Too many complex indicators can impact performance; remove unused ones via the "Indicator List" (Ctrl+I).
Q: Can I use MT4 indicators on MT5? A: No, MQL4 and MQL5 are distinct languages; ensure the indicator is compiled specifically for your platform version.
Description & Settings
Candlestick Index (CSI, based on ) is described by William Blau in the book .
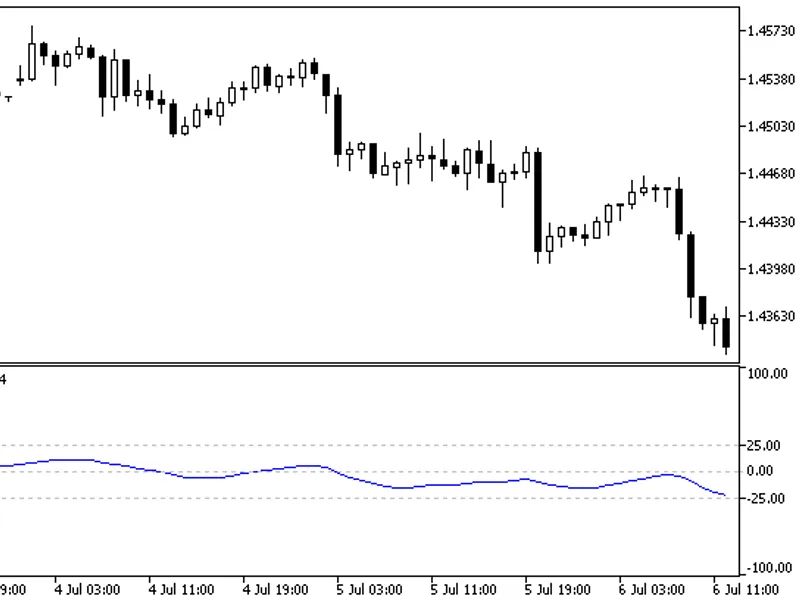
The values of Candlestick Index are normalized (price range) and mapped into the [–100,+100] interval. The positive values of CSI correspond to overbought states of the market, the negative values correspond to the oversold states of the market.
WilliamBlau.mqh must be placed in
terminal_data_folder
\MQL5\Include\
Blau_CSI.mq5 must be placed in
terminal_data_folder
\MQL5\Indicators\
Candlestick Index by Wiliam Blau
Calculation:
Candlestick Index is calculated by formula:
when:
q - number of bars, used in calculation of q-period Candlestick Momentum;
price1 - close price;
price2 - open price q bars ago;
cmtm(price1,pric2,q)=price1-price2[q-1] - q-period Candlestick Momentum;
LL(q) - lowest price (q bars);
HH(q) - highest price (q bars);
HH(q) - LL(q) - Price Range (q-bars);
CMtm(price1,pric2,q,r,s,u) - triple smoothed Candlestick Momentum;
EMA(...,r) - 1st smoothing - EMA(r), applied to:
Candlestick Momentum (q bars);
Price Range (q bars);
EMA(EMA(...,r),s) - 2nd smoothing - EMA(s), applied to result of the 1st smoothing;
EMA(EMA(EMA(...,r),s),u) - 3rd smoothing - EMA(u), applied to result of the 2nd smoothing.
Input parameters:
q - number of bars, used in calculation of Candlestick Momentum (by default q=1);
r - period of the 1st EMA(r), applied to Candlestick Momentum(by default r=20);
s - period of the 2nd EMA(s), applied to result of the 1st smoothing (by default s=5);
u - period of the 3rd EMA(u), applied to result of the 2nd smoothing (by default u=3);
AppliedPrice1 - (by default AppliedPrice1=PRICE_CLOSE);
AppliedPrice2 - (by default AppliedPrice2=PRICE_OPEN).
Note:
q>0;
r>0, s>0, u>0. If r, s or u are equal to 1, smoothing is not used;
Min. rates = (q-1+r+s+u-3+1).