Download ALL MT5 indicators (5742)

Similar MetaTrader Tools









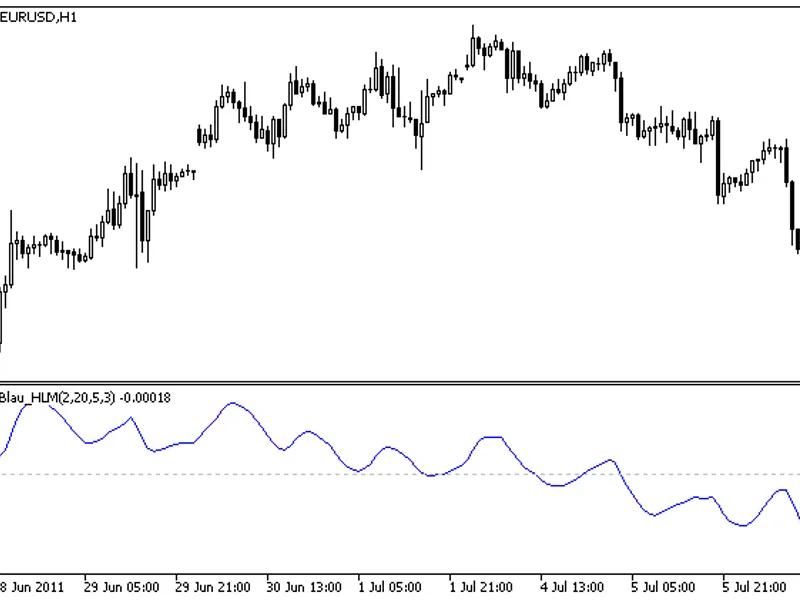
Composite High/Low Momentum Indicator (HLM)
Info
The Composite High/Low Momentum Indicator (HLM) is a Indicator for MetaTrader 5 that composite high/low momentum indicator the composite high/low momentum indicator is based on the work of william blau. Installation: Place williamblau.
Usage
This tool is typically used for enhancing chart analysis and decision making.
Platform
This Indicator works exclusively on MetaTrader 5 (both build 600+ and newer versions).
Setup
Place the downloaded file in MQL5/Indicators folder via File ? Open Data Folder in MetaTrader 5.
How to Install and Use Composite High/Low Momentum Indicator (HLM)
1. Installation: Place your file in the MQL/Indicators folder via "Open Data Folder" and restart your terminal.
2. Loading: Find the indicator in the Navigator, drag it onto your chart, and configure the input parameters in the popup window.
3. Customization: Press Ctrl+I to open the indicator list, select your tool, and click "Properties" to change colors, levels, or visual styles.
4. Updating: Replace the old file in the Indicators folder with the new version and restart the platform to apply changes.
Frequently Asked Questions
Q: Why is my indicator not showing? A: Verify the file is in the MQL/Indicators folder, or try right-clicking the "Indicators" tree in the Navigator and clicking "Refresh."
Q: Do custom indicators slow down the platform? A: Too many complex indicators can impact performance; remove unused ones via the "Indicator List" (Ctrl+I).
Q: Can I use MT4 indicators on MT5? A: No, MQL4 and MQL5 are distinct languages; ensure the indicator is compiled specifically for your platform version.
What this tool does
Composite High/Low Momentum Indicator The Composite High/Low Momentum indicator is based on the work of William Blau.
Typical Use Case
This Indicator excels in automated trading and technical analysis on MetaTrader 5.
Compatible Platform & Setup
This Indicator works on MetaTrader 5. Place the file in the MQL5/Indicators folder and restart the terminal.
Description & Settings
Related: Composite Binary Wave Indicator - another powerful indicator for MetaTrader 5 traders.
Composite High/Low Momentum Indicator The Composite High/Low Momentum indicator is based on the work of William Blau.Also recommended: composite rs i - similar indicator with strong performance on MetaTrader 5.
Installation:Place williamblau.mqh in the following directory:
terminal_data_folder\mql5\include\
Place blau_hlm.mq5 in the following directory:
terminal_data_folder\mql5\indicators\
Calculation:
The indicator calculates the composite high/low momentum using the following formulas:
hlm(q) = hmu(q) - lmd(q)
Where:
q = Number of bars used in the calculation of up trend momentum and down trend momentum.
hmu(q) = Up trend momentum over q bars.
lmd(q) = Down trend momentum over q bars.
The smoothed version of the indicator is calculated as:
Smoothed HLM = ema(ema(ema(hlm(q), r), s), u)
Where:
ema(hlm(q), r) = First smoothing using an Exponential Moving Average (EMA) with period r, applied to hlm(q).
ema(ema(..., r), s) = Second smoothing using an EMA with period s, applied to the result of the first smoothing.
ema(ema(ema(..., r), s), u) = Third smoothing using an EMA with period u, applied to the result of the second smoothing.
Input Parameters:
q: The number of bars for HLM calculation. Default is 2.
r: The period for the first EMA smoothing applied to HLM. Default is 20.
s: The period for the second EMA smoothing. Default is 5.
u: The period for the third EMA smoothing. Default is 3.
Notes:
- q must be greater than 0.
- r, s, and u must be greater than 0. If r, s, or u is equal to 1, that specific smoothing step is not applied.
- Minimum required bars for calculation = (q - 1 + r + s + u - 3 + 1).
You may also like: composite rs i - excellent alternative for indicator users on MetaTrader 5.
Source Code
#property copyright "robotfx"
#property link "https://robotfx.org"
#property description "this code is educational. feel free to use, modify and upgrade as you wish. visit robotfx.org for professional trading tools"
#include <williamblau.mqh>              // include file (terminal_data_folder\mql5\include)
#property indicator_separate_window     // indicator in a separate window
#property indicator_buffers 6           // number of buffers used
#property indicator_plots   1           // number of graphic plots
#property indicator_label1  "hlm"       // label of graphic plot #0
#property indicator_type1   draw_line   // draw as a line
#property indicator_color1  blue        // line color
.......
⚠ Limitations & Risk Warning
- This tool is provided for educational and testing purposes only.
- Past performance does not guarantee future results.
- Trading involves substantial risk of loss. Use on a demo account first.
- Results may vary depending on market conditions, broker, and settings.
- We recommend thorough backtesting and forward testing before using with real funds.