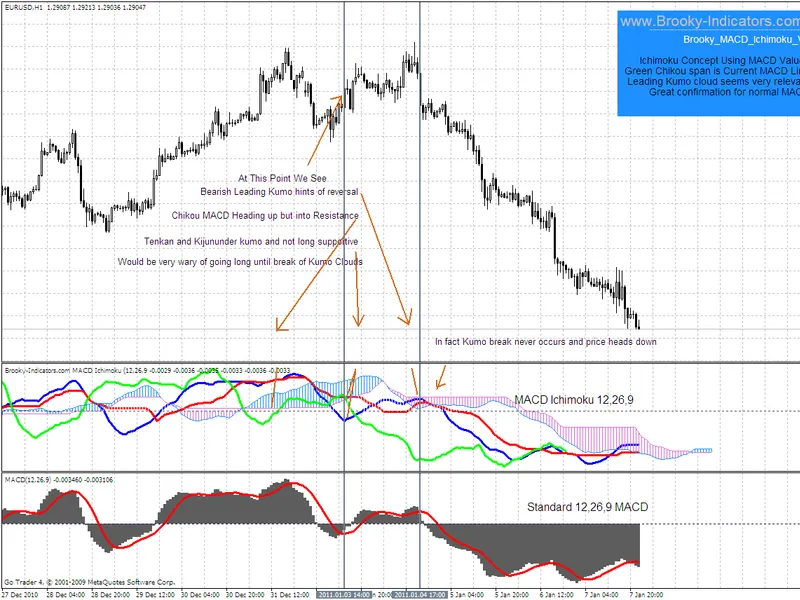
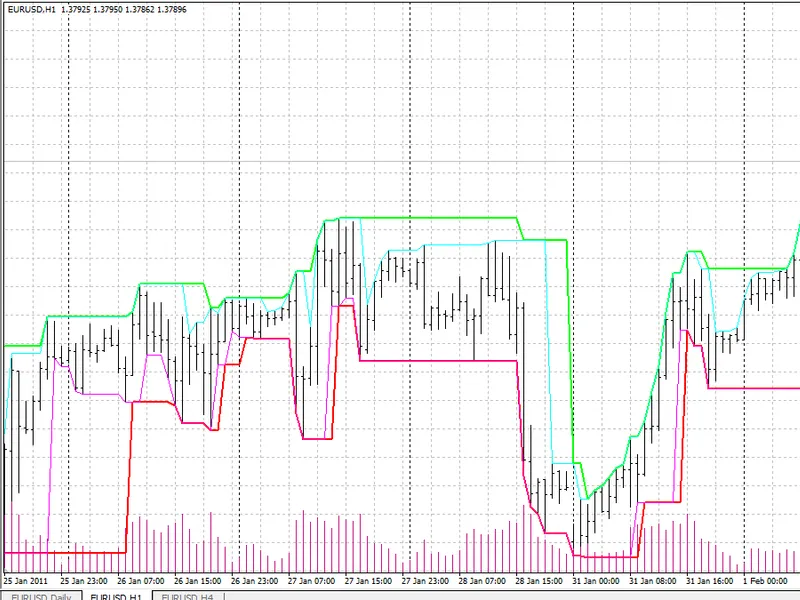
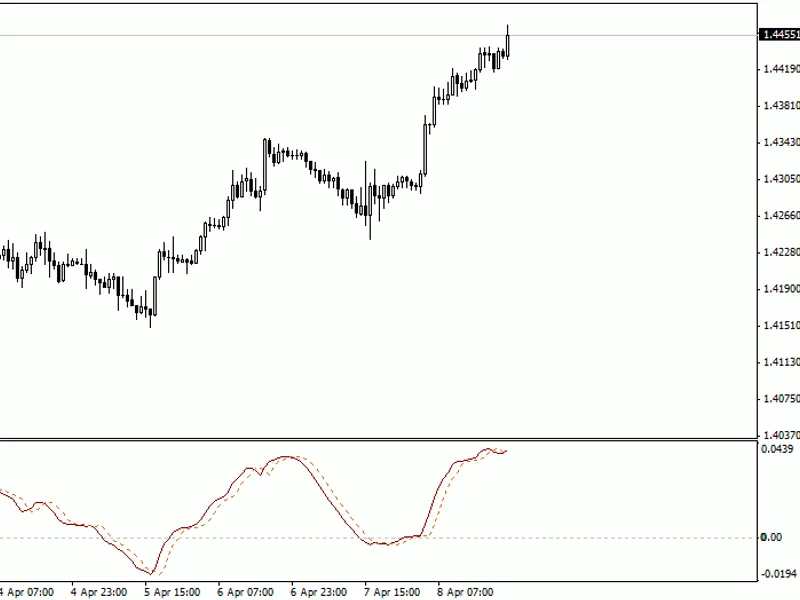
the macd is a stable indicator around which many strategies have been developed. in an attempt to apply some market sentiment indications to it, the ichimoku concepts were applied ...
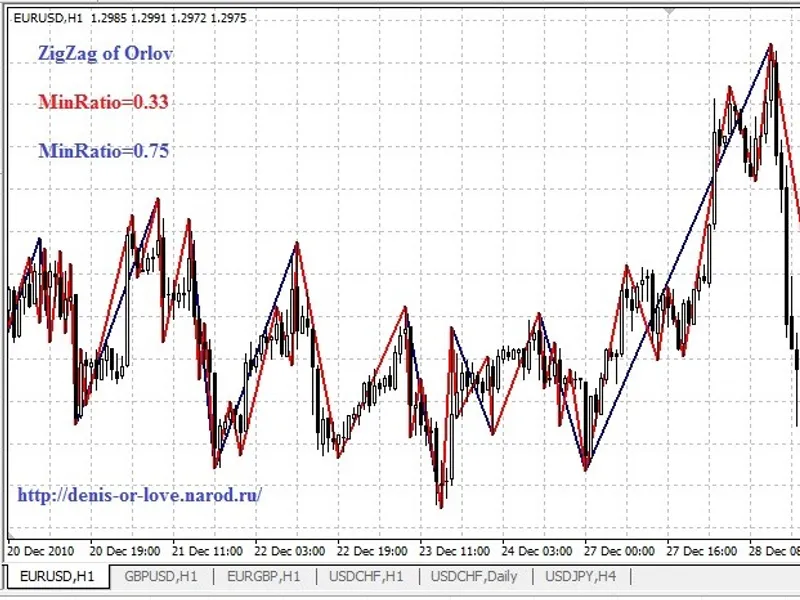
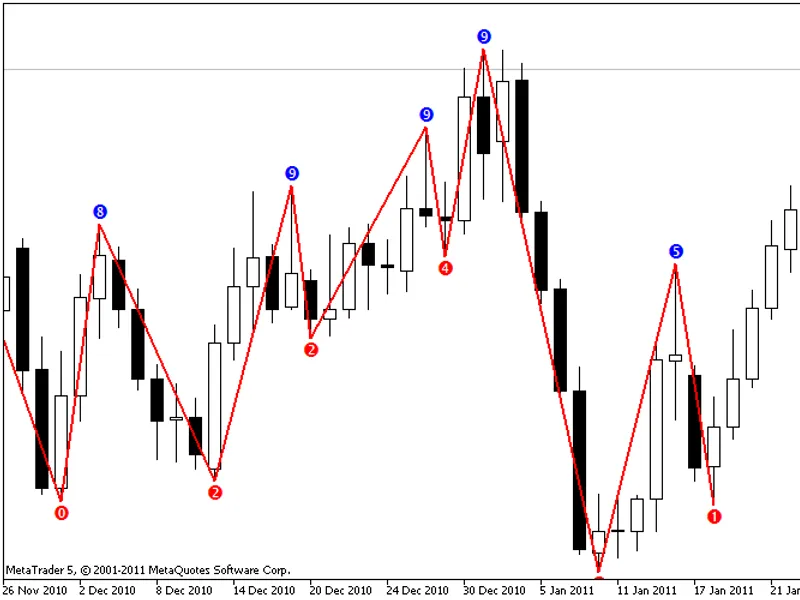
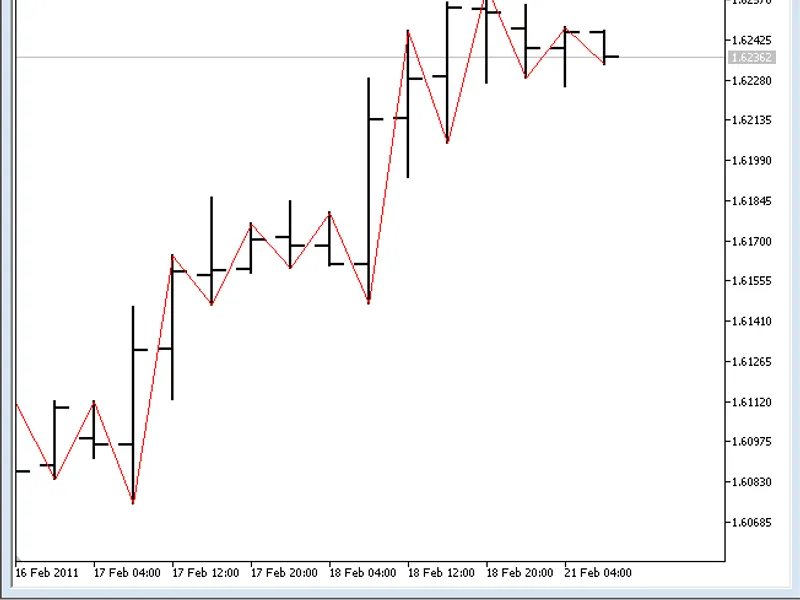
the zig zag of orlov is a technical indicator designed to provide a clear and natural principle of work. it shows impulses and corrections, which are important for analysis. the zi...
this indicator allows users to choose any timeframe in seconds and generates histogram bars that resemble candlesticks.key features- choose any timeframe in seconds- generates hist...
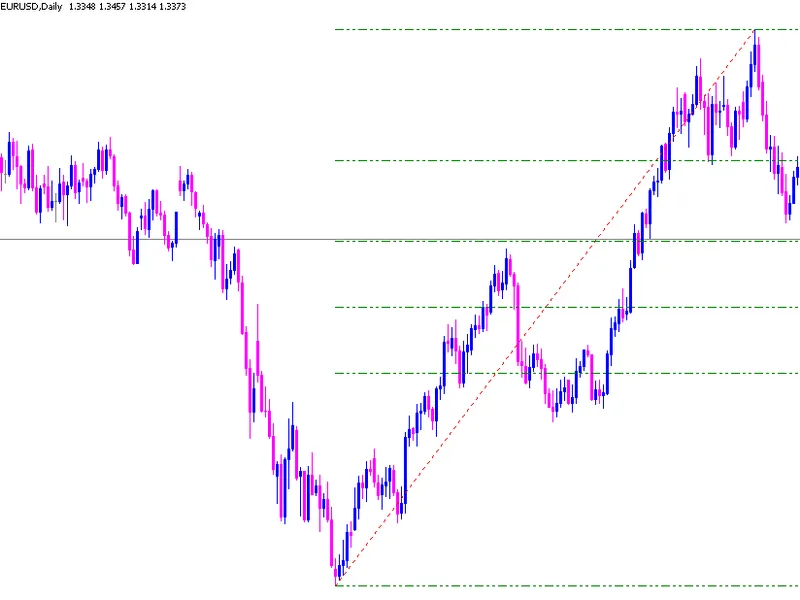
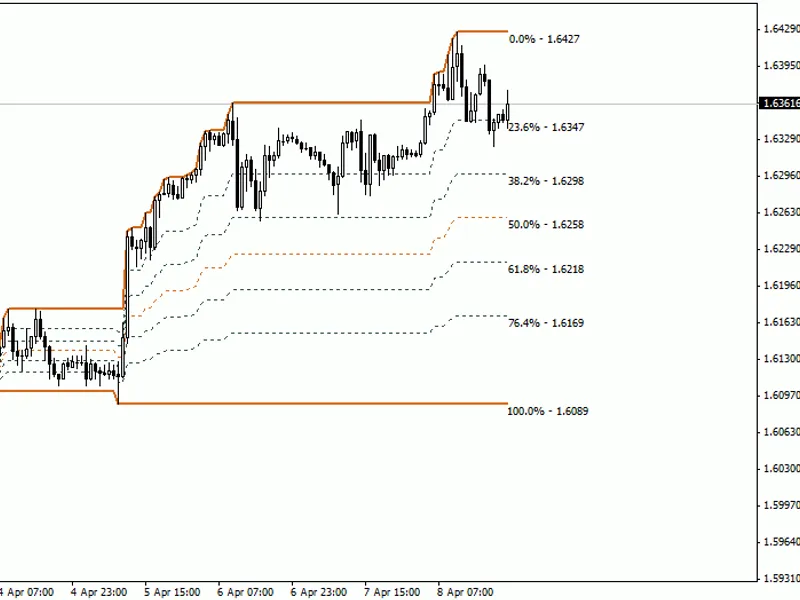
xi t fi b s indicator automatically plots fibonacci lines on the current chart. the lines have retracement values and price.key features- automatically places fibonacci retracement...
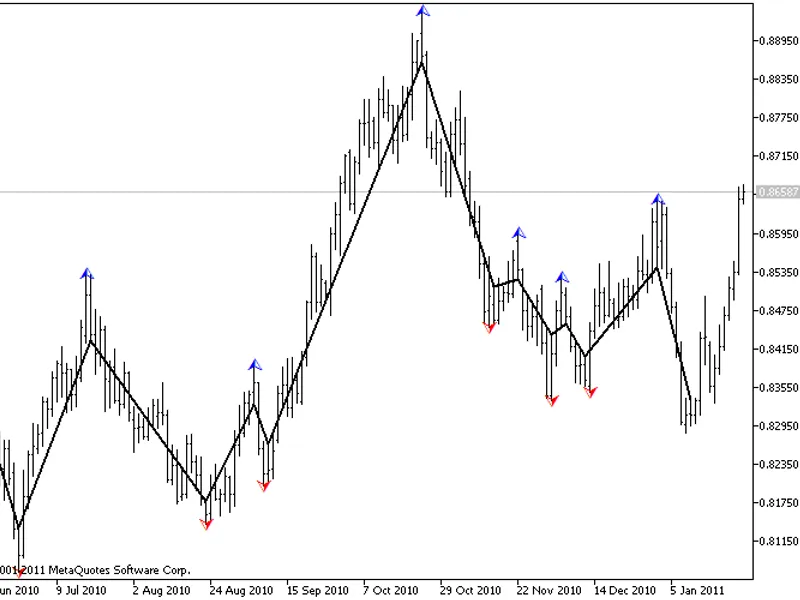
the professional zig zag is an indicator that compresses the price chart by connecting the highest highs and lowest lows. it calculates the zigzag using the price of the bar, such ...
the idea of this approach is described in the new bar event handler article. the example of its use in the expert advisors is presented in the article. here you will find the solut...
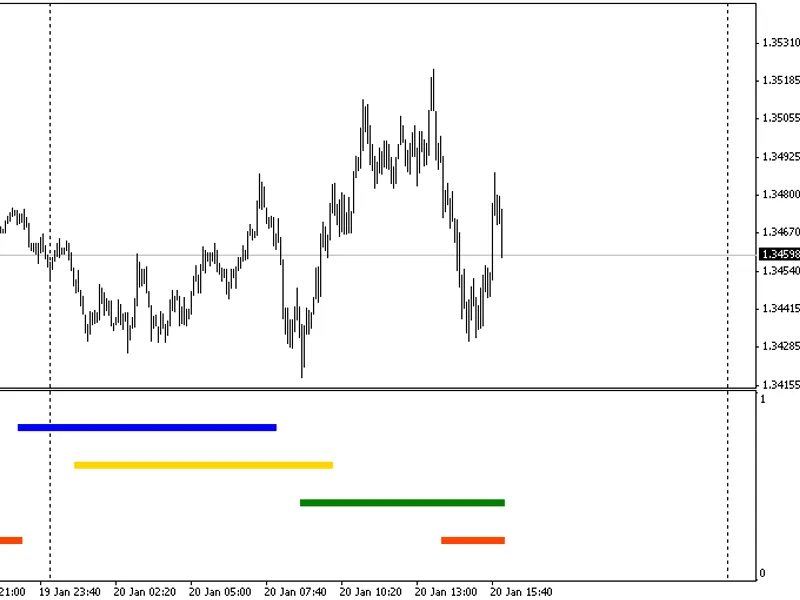
forex market session indicatorthis indicator visually represents the four major forex trading sessions: sydney, tokyo, london, and new york.understanding market behavior during dif...
this is a mirror indicator that can be used in the chart.indicator strategythe strategy for using this indicator is as follows: entry buy signal is generated when the red line is a...
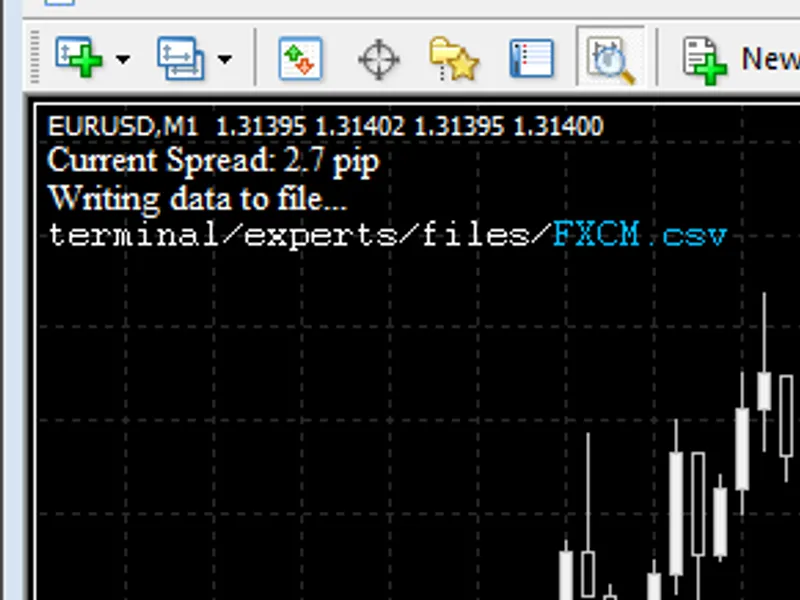
are you getting the spread you've been quoted by your broker?ever wanted to verify spread data stats from another source or create your own data?spread data logger consists of two ...
this indicator is designed to help traders identify momentum trades based on divergences in the commodity channel index (cci) indicator and the accelerated moving average (ma).key ...
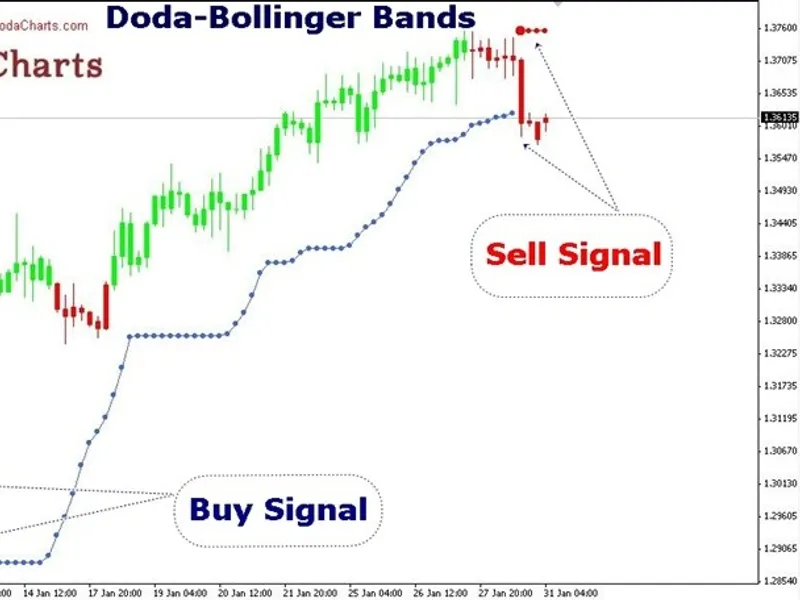
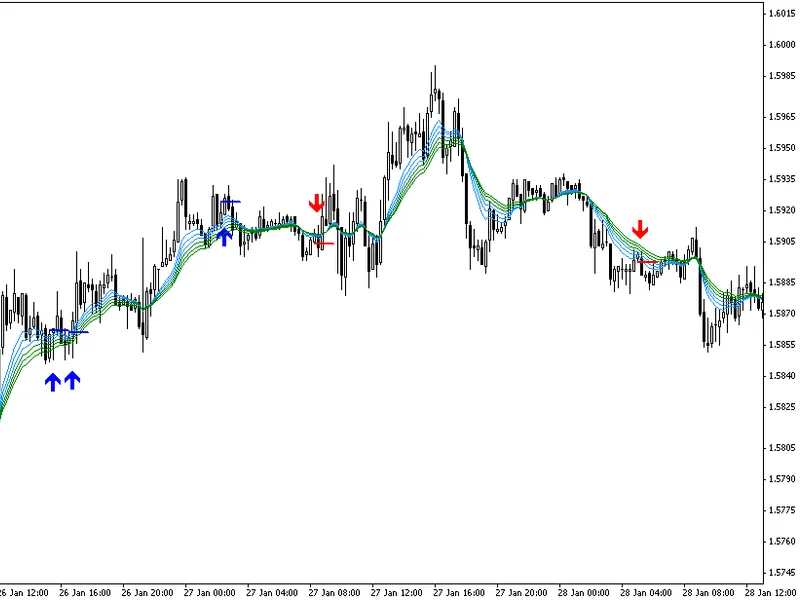
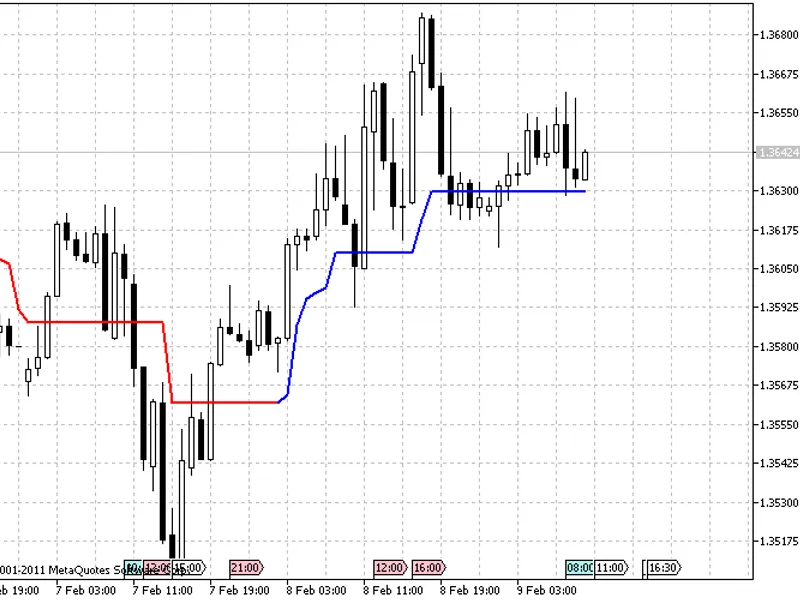
usage is simple. buy when price closes above the red line and you see the blue line. sell when price closes below the blue line and you see the red line. the sample image below is ...
the nonparametric zig zag indicator is designed to identify and plot zigzag segments on a chart based on specific patterns.indicator descriptionthe upward zigzag segment begins whe...
nonparametric zigzag is a unique approach to identifying trends in the market.key features- the monotonicity condition for the ascending segment of the zigzag requires that the hig...
the market flow analysis method indicator is based on the concept of tracking highest highs and lowest lows to identify potential trend changes.indicator descriptionthe program mon...
the urban towers indicator is a tool designed to provide entry points for positions. it displays arrows to signal the point of entry into a position according to the strategy it is...
the trend magic indicator is a tool used for calculating trends. it utilizes two indicators with periods of 50 and 5 for its calculations.key features- uses indicators with periods...
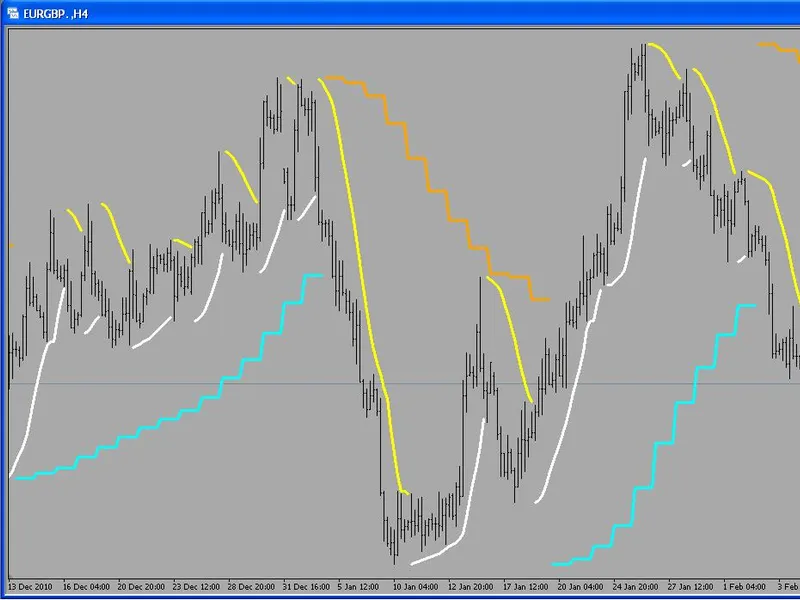
this indicator displays the parabolic sar for the current time frame, represented by a white line and a yellow line, as well as the next available time frame, represented by an aqu...
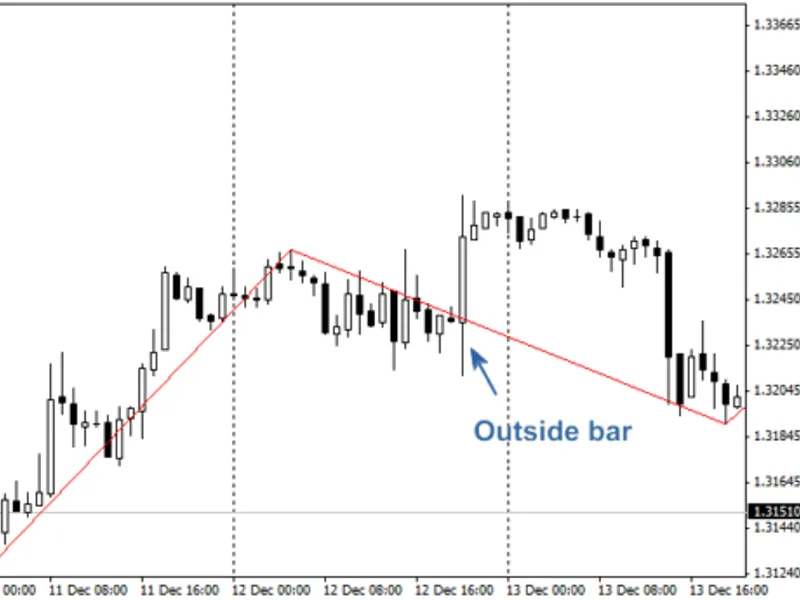
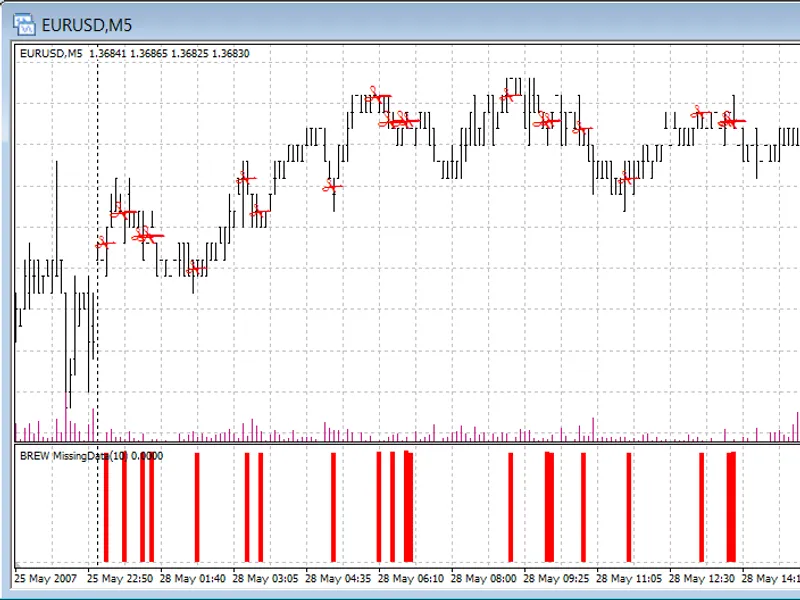
this is a tool to help identify missing bars in your chart.introductionthe indicators were created to visually identify patchy data in charts. they are available for personal or co...
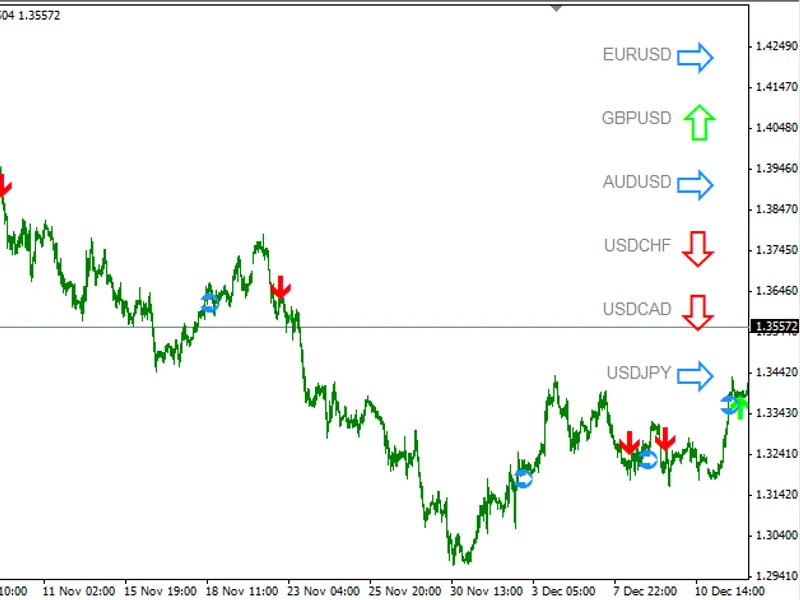
this is a daily trend indicator that can display the trend of up to 6 currency pairs on your charts.indicator settingsthe indicator is designed to be used on the 1 hour timeframe, ...
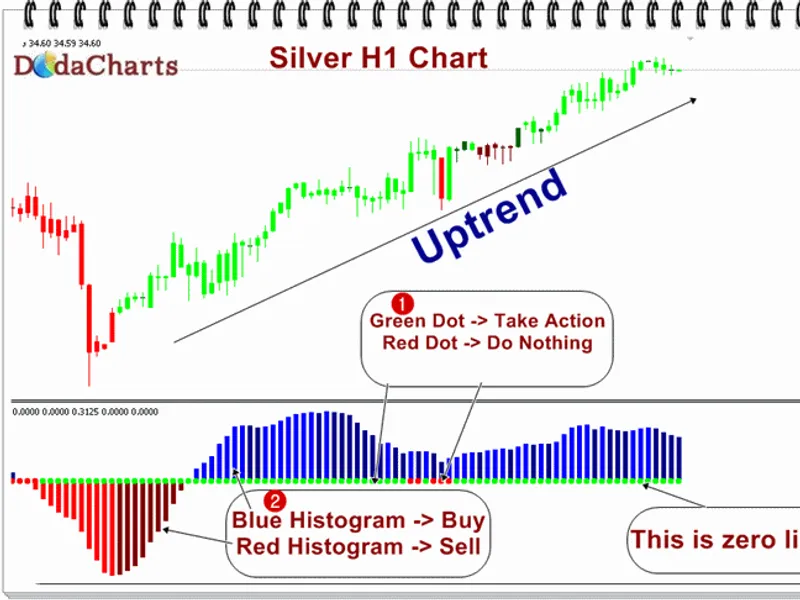
the indicator is displayed below the main chart window and is designed for straightforward use.there are two steps to interpret signals from this indicator.step 1:observe the zero ...
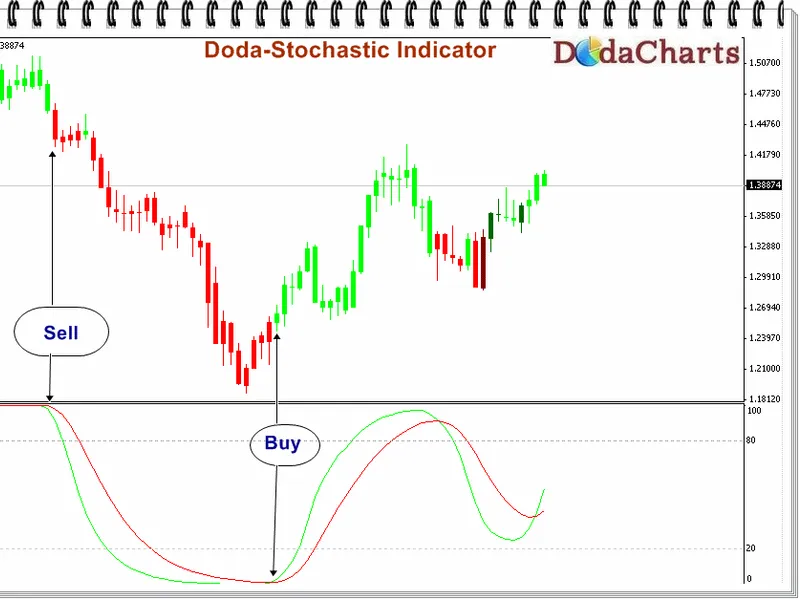
this is another variant of the stochastic indicator. the normal stochastic indicator gives buy and sell signals many times even if the price is trading in a single direction. this ...
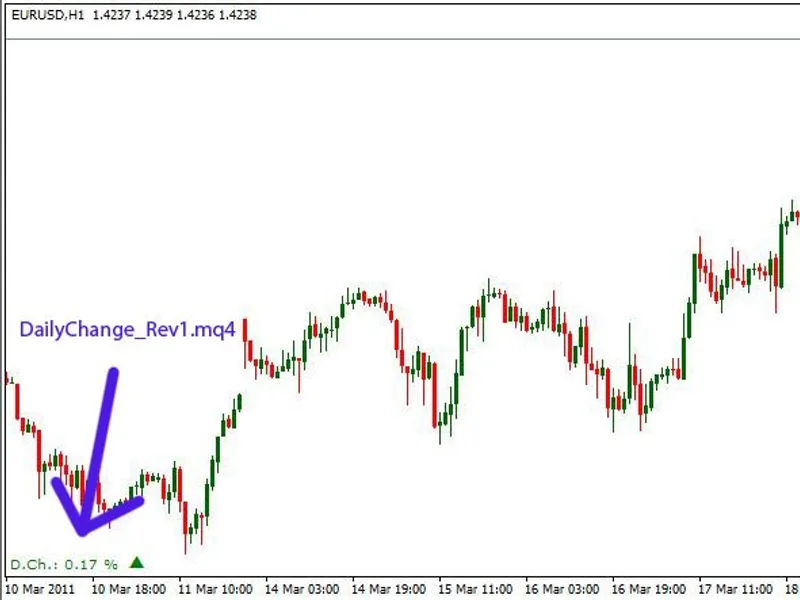
this indicator displays the percentage change from yesterday's closing price to the current bid price.it calculates the difference as a percentage and works on any chart timeframe....
this is an indicator that draws daily, weekly and monthly pivots, support and resistance levels.indicator features- draws daily, weekly and monthly pivots, support and resistance l...
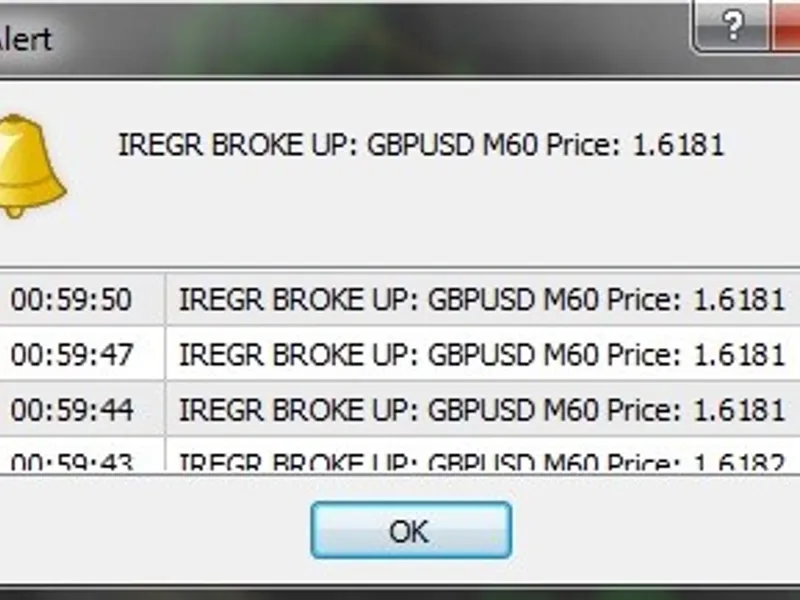
indicator regression alert notifier.this tool sends alerts when the price breaks above or below the indicator regression lines.recommendations:changelog:v3(3/20/2026):removed custo...
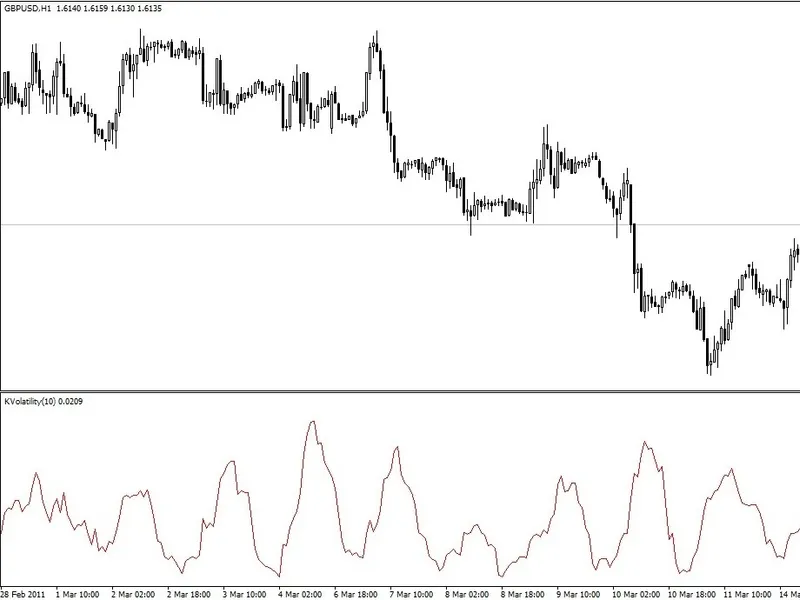
The Kaufman Volatility Indicator, based on the principles outlined in Perry Kaufman's book "Smarter Trading".This indicator is designed to measure and analyze market volatility.Fur...
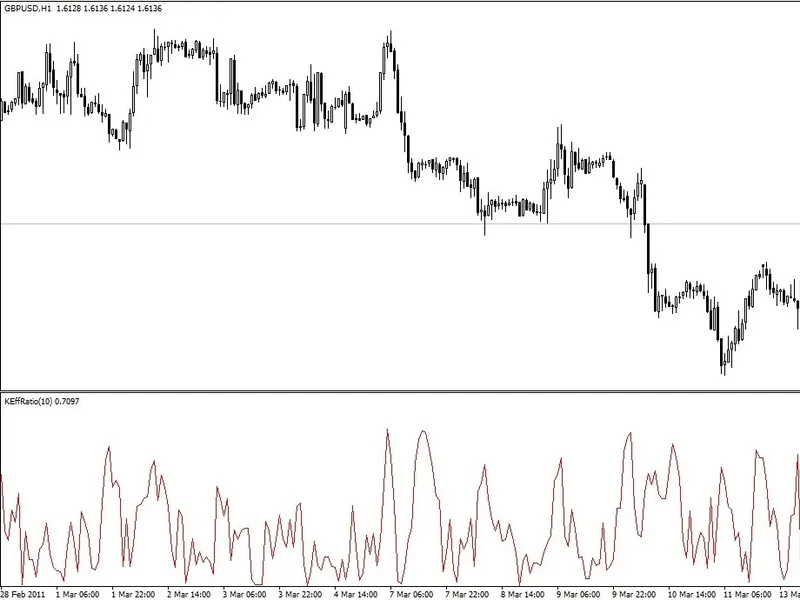
The Kaufman Efficiency Ratio, also known as the Generalized Fractal Efficiency, is a technical indicator introduced by Perry Kaufman in his books "Smarter Trading" and "Trading Sys...
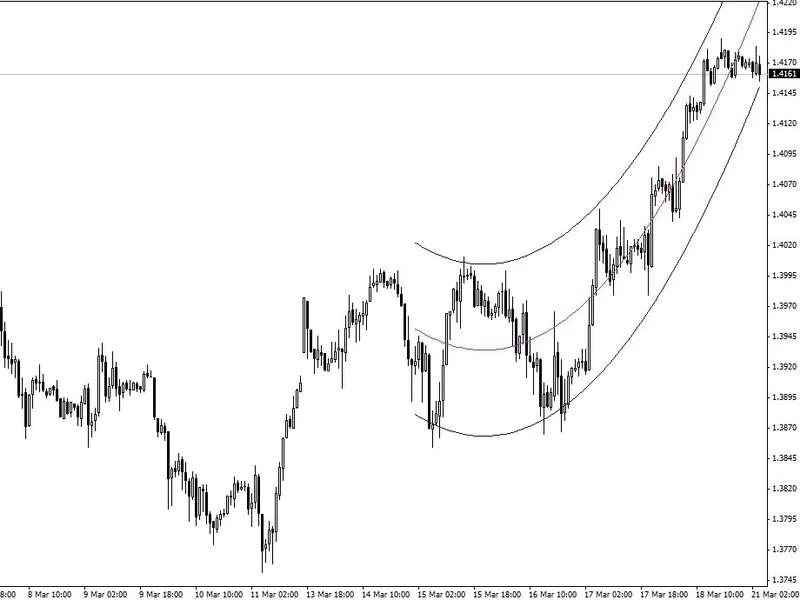
This indicator performs a comparative regression analysis, evaluating four distinct regression types: linear, quadratic, logarithmic, and exponential. It automatically selects the ...
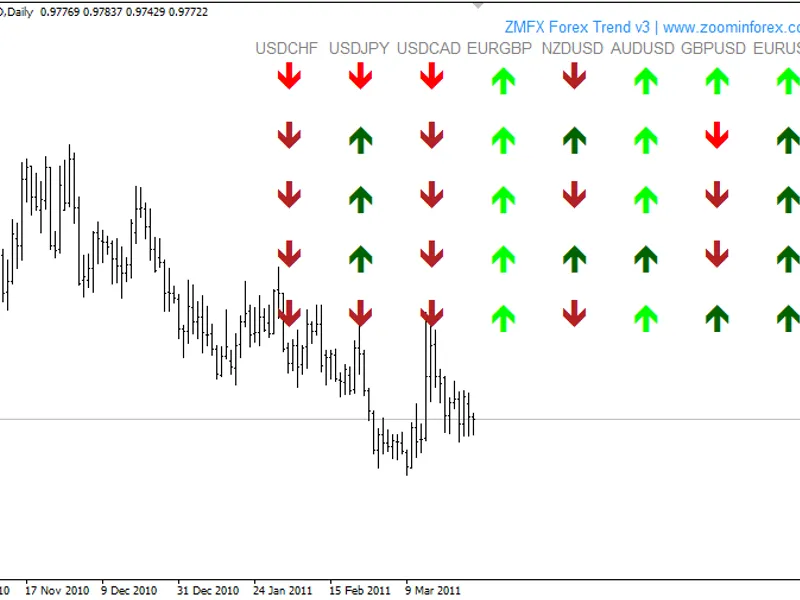
This indicator allows you to view 8 currency pairs and their 5 indicators with one indicator. It is recommended to use it on higher time frames, such as 4h, daily, weekly. For exam...
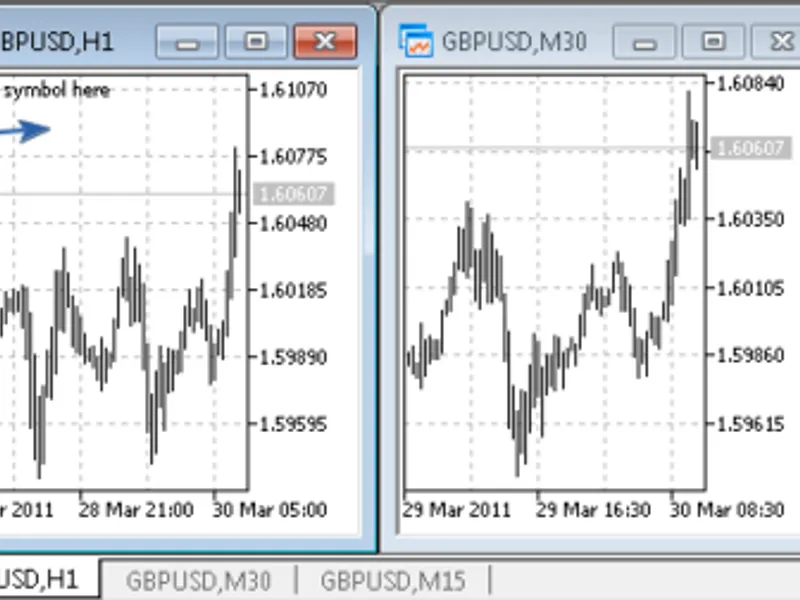
After attaching the indicator to the chart, you will see a 'drag symbol here' message. If you drag a symbol from the 'Market Watch' window, it will change the symbols on all other ...
This code is a valuable trading tool that was discovered in 2026.
It is considered to be highly effective and its potential should not be overlooked.
Many traders are not aware of ...
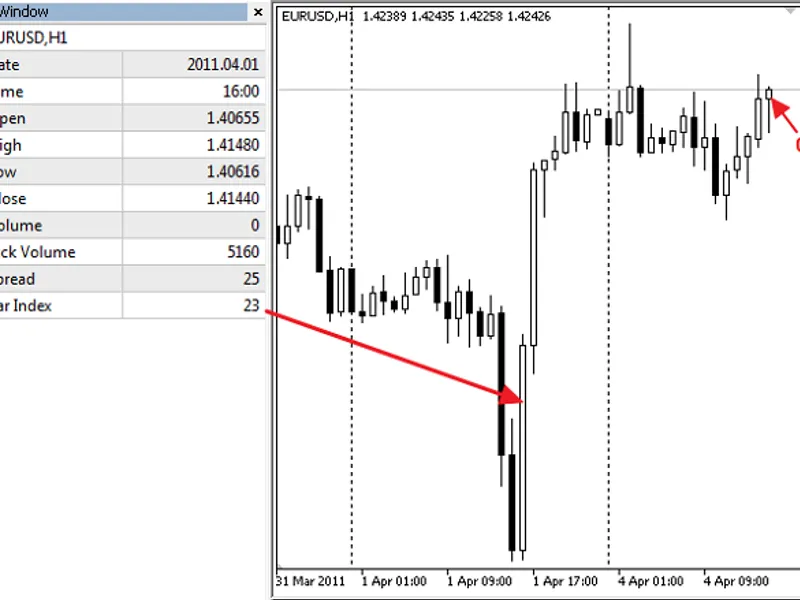
This is an example of the indicator, that shows bars index in the data window.The bar indexing is set such that the current uncompleted bar has index=0, and the oldest bar has the ...
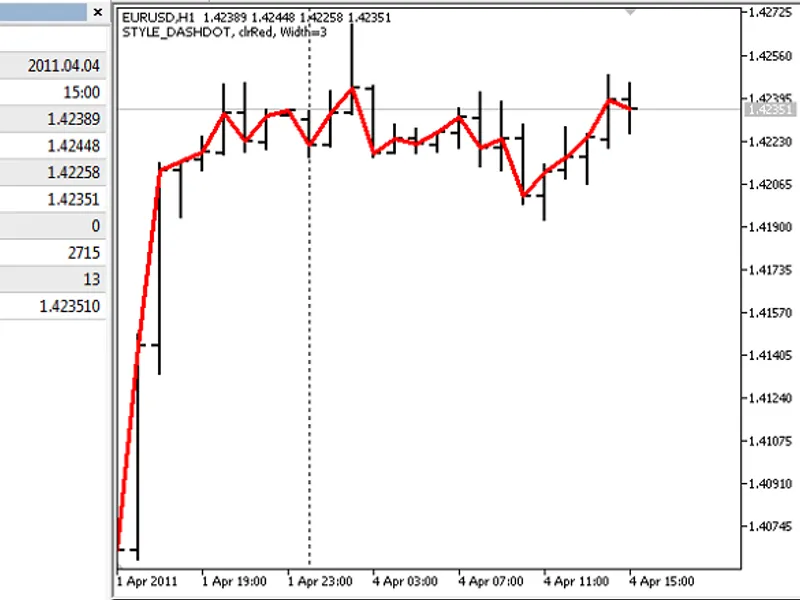
This indicator plots the open prices of bars as a line.The line's color, width, and style change randomly every 5 ticks.The width, color, and style can be defined using preprocesso...
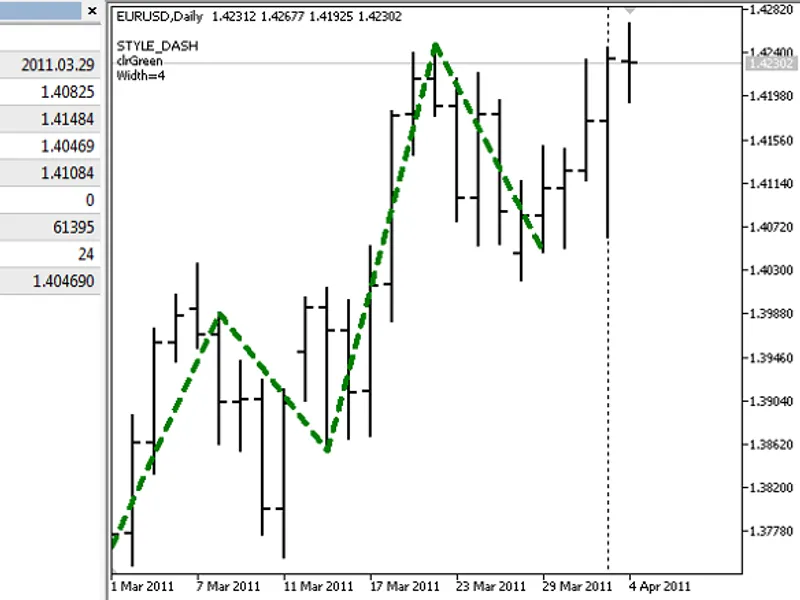
This indicator plots sections between the high and low prices of bars.The color, width, and style of the sections change randomly every N ticks.Initial properties of the plot are d...
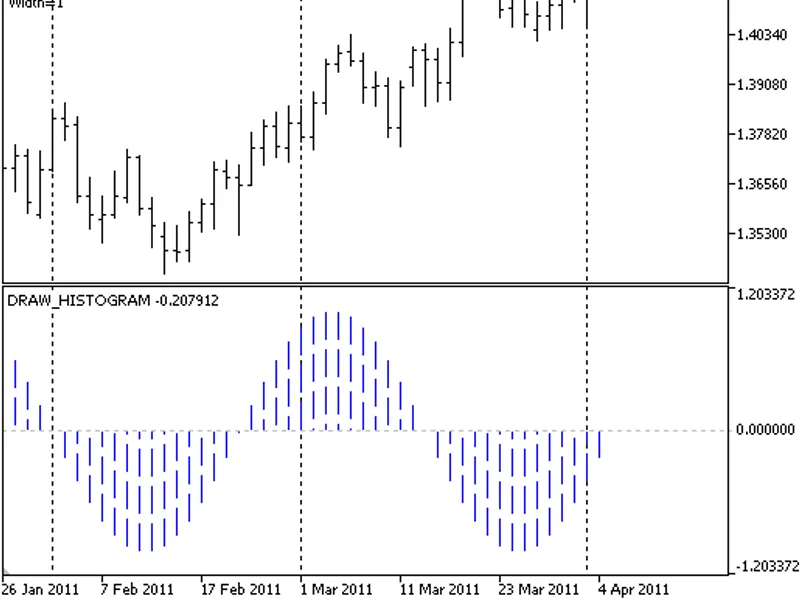
This indicator plots a graph of a function in a separate window.Indicator DescriptionThe histogram color, width, and line style are changed randomly every n ticks. The period of th...
This indicator plots a vertical section for each bar between the open and close prices.The indicator can be displayed in a separate window or the main chart window.It does not plot...
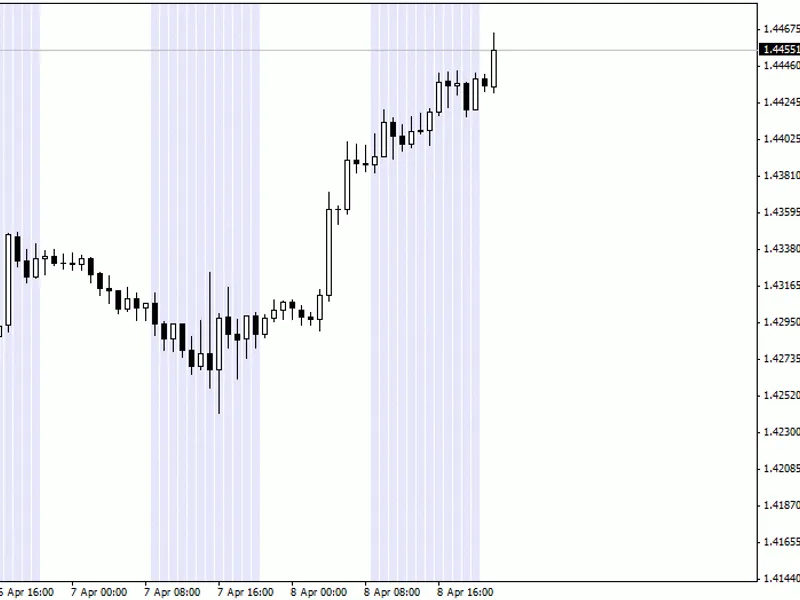
This indicator simply displays active hours as defined by the user, which is useful for visual backtesting.Key Features- Displays active hours defined by the user- Useful tool for ...
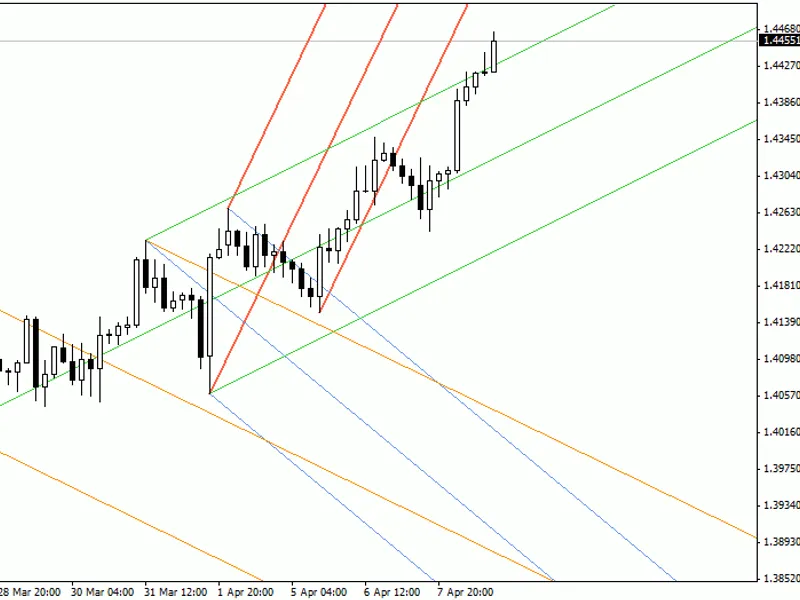
Automatic Andrews, Schiff, or Modified Schiff Pitchforks.Analysis suggests the Modified Schiff Pitchfork is the most effective.This tool automatically draws Andrew's Pitchfork, Sch...
Intra-period Fibonacci is a useful tool for traders, providing insights into market trends and patterns within different time frames, such as month, week, day, and various hour int...
The indicator calculates your risk as a percentage and gives you the lot size that is acceptable for your risk. You only need to specify the risk in percent and the stop size in pi...
The JJ N-Promise indicator is designed to visualize market trends and identify divergences.This tool aims to provide traders with clear insights into potential shifts in momentum a...
This indicator displays profits and losses in both pips and money.Indicator SettingsThe indicator uses PosX and PosY for positioning, as these settings are preferred over corner pl...
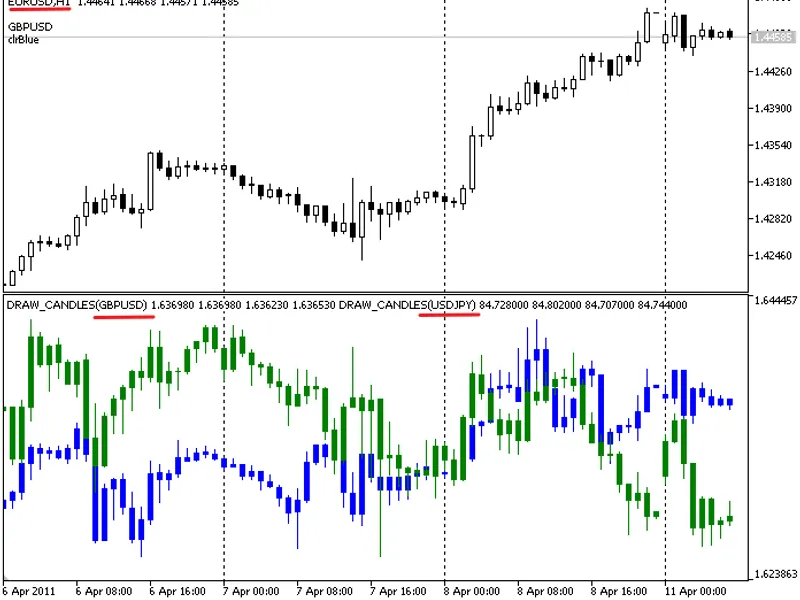
This indicator displays candlesticks for two symbols in a separate chart window.The indicator plots candles using the values from four indicator buffers representing open, high, lo...
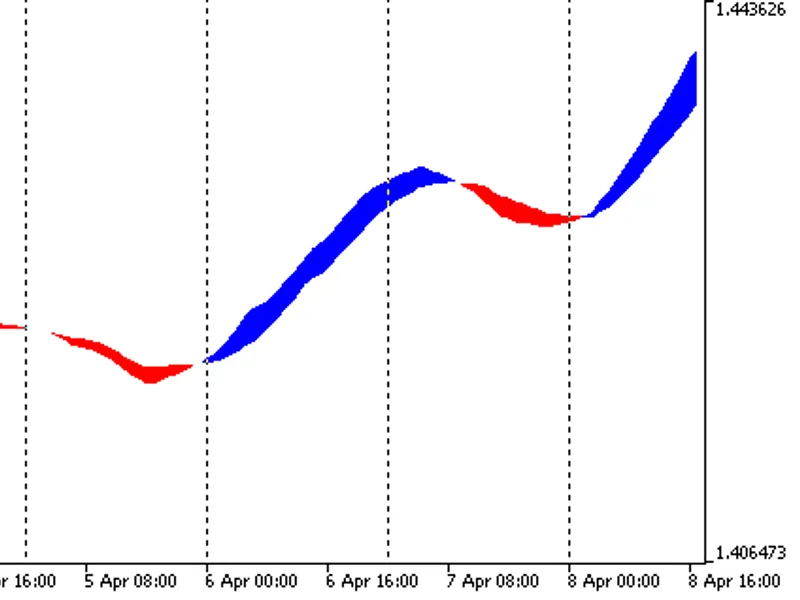
This indicator plots a channel based on two moving averages with different periods in a separate window.The change in the channel color indicates a trend change.The drawing style p...
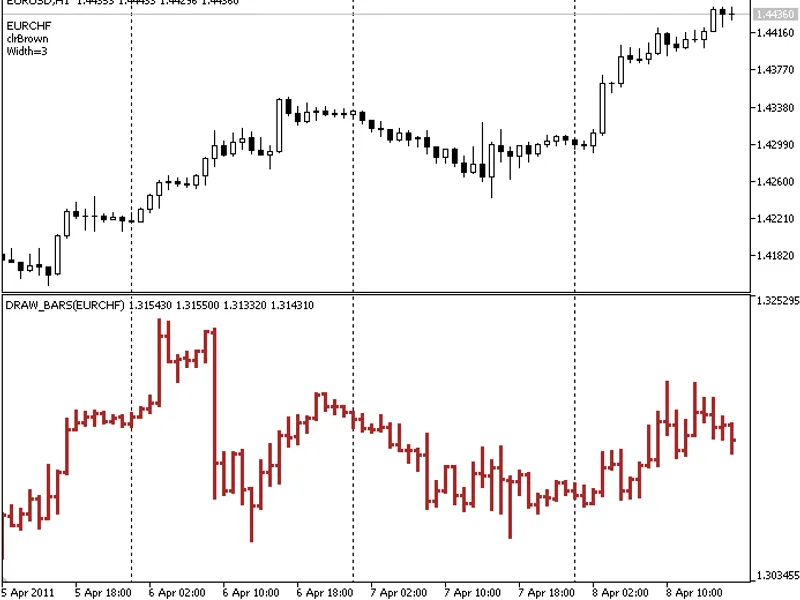
This indicator plots the bars of a specified symbol in a separate chart window.The indicator draws bars using the values from four indicator buffers representing the open, high, lo...
This indicator plots the ZigZag indicator using high and low prices.The drawing style allows for the creation of sections based on the values of two indicator buffers. This feature...