



Risk of Ruin Calculator: Understand Your Trading Account's Vulnerability
Info
The Risk of Ruin Calculator: Understand Your Trading Account's Vulnerability is a Script for MetaTrader 5 that risk of ruin analyzes your closed trades to determine the probability of losing your entire account before your trading edge becomes effective. A positive expectancy doesn't prevent a sufficiently large losing streak from depleting your capital.
Usage
This tool is typically used for enhancing chart analysis and decision making.
Platform
This Script works exclusively on MetaTrader 5 (both build 600+ and newer versions).
Setup
Place the downloaded file in MQL5/Scripts folder via File ? Open Data Folder in MetaTrader 5.
How to Install and Use Risk of Ruin Calculator: Understand Your Trading Account's Vulnerability
1. Installation: Move your script file into the MQL/Scripts directory and restart the platform.
2. Execution: Drag the script onto a chart; it will perform a one-time action, such as closing all open orders or clearing chart objects.
3. Editing: Use MetaEditor (F4) to modify code, click "Compile," and verify no errors appear in the terminal before running.
4. Removing: Scripts stop automatically, but you can remove them manually by right-clicking the chart and choosing "Remove Script."
Frequently Asked Questions
Q: How are scripts different from EAs? A: Scripts execute a single action and then stop; EAs monitor the market and trade continuously.
Q: Can I assign a hotkey to a script? A: Yes, right-click the script in the Navigator, select "Set Hotkey," and define your preferred keyboard shortcut.
Q: Why did my script stop? A: Scripts are designed to stop immediately after finishing their programmed command; this is normal behavior.
What this tool does
Risk of Ruin analyzes your closed trades to determine the probability of losing your entire account before your trading edge becomes effective.
Typical Use Case
This Script excels in automated trading and technical analysis on MetaTrader 5.
Compatible Platform & Setup
This Script works on MetaTrader 5. Place the file in the MQL5/Scripts folder and restart the terminal.
Description & Settings
Related: Weekend Gap Risk Assessment for Prop Firm Trading - another powerful script for MetaTrader 5 traders.
Risk of Ruin analyzes your closed trades to determine the probability of losing your entire account before your trading edge becomes effective. A positive expectancy doesn't prevent a sufficiently large losing streak from depleting your capital. This tool quantifies that likelihood based on your own trading history.Also recommended: Risk-Based Lot Size Calculator Script with On-Chart Panel - similar script with strong performance on MetaTrader 5.
The script normalizes each historical trade into an R-multiple (its net result divided by your average loss). It then simulates numerous hypothetical future trading sequences using a risk-per-trade percentage you specify. Each simulation randomly selects R-multiples from your history with replacement, compounds equity trade by trade, and flags a run as 'ruined' if equity drops below a defined floor. This method is independent of historical trade sizes; only the distribution of wins and losses is preserved. The specified risk percentage dictates the sizing of all future simulated trades.
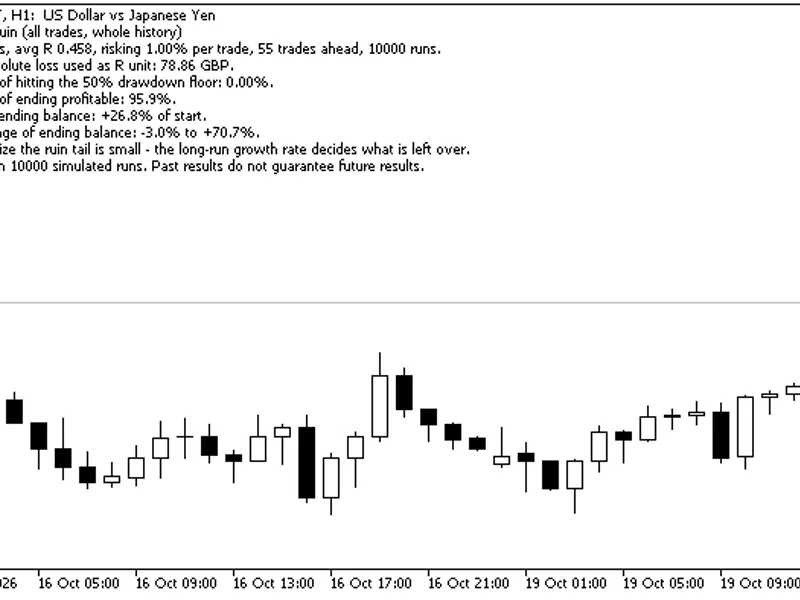
For instance, running the script on a USD/JPY chart with a demo account, 55 closed trades, and 1% risk per trade shows a 0% chance of hitting a 50% drawdown floor over the next 55 trades, with a median ending balance of +26.8% of the starting equity.
Interpreting the Results
Chance of hitting the drawdown floor: This represents the proportion of simulated runs that concluded at or below your specified floor. A lower percentage is ideal. However, a zero probability with limited historical data is not a guarantee; the simulation can only reshuffle existing trade outcomes.
Chance of ending profitable: This is the share of runs that finished with a positive balance relative to the start. A high figure here, coupled with a non-trivial chance of ruin, indicates that while the strategy is often profitable, its ruin potential is significant.
Median ending balance: This shows the typical final account balance as a percentage change from the starting equity. The median is a more reliable indicator than the mean for bootstrapped equity curves, as it is less influenced by extreme positive outcomes.
95% range of ending balances: This illustrates the middle 95% of simulated final account balances. The width of this range is crucial for understanding position sizing. The same strategy, when employing double the risk, typically exhibits a similar median growth rate but a substantially wider range, with the increased range primarily attributed to greater potential downside.
Consider the same account but with 3% risk per trade instead of 1%: the median ending balance increases to +91.8%. However, the 95% range expands from -3.0% to +70.7% to -13.5% to +357.3%. This widened range is predominantly due to increased potential losses.
The results are displayed in the Experts tab of the Terminal and visually in the top-left corner of the chart. The chart symbol is irrelevant as the script processes the entire account history. You can rerun the script with different parameters, such as varying the risk per trade or drawdown floor, to update the displayed information.
Trade Counting Methodology
A trade is defined as a single closed position. Its net result includes profit, commission, fees, and swaps as recorded in your broker's deal history, ensuring alignment with your actual costs. Each trade is converted into an R-multiple by dividing its net result by the average of your absolute trade losses. For example, a trade that lost an amount equal to one average loss is -1R, and a trade that gained twice the average loss is +2R. Deposits, withdrawals, and broker charges not associated with specific trades are excluded, as are open positions. In netting accounts, reversing a position counts as a single trade.
Parameters
Magic number: Use -1 for all trades, 0 for manual trades only, or specify the magic number of an Expert Advisor.
Symbol: Leave blank to include all symbols.
Only trades closed in the last N days: Set to 0 to use the entire account history.
Risk per trade, % of equity: Range from 0.01 to 25.0, with a default of 1.0. The simulation applies this risk to all future trades; it does not need to match historical risk as the simulation scales from R-multiples.
Ruin floor, % of starting equity: Range from 10.0 to 95.0, with a default of 50.0. A 50% floor is standard in risk-of-ruin literature; increase this value for stricter drawdown limits (e.g., a 10% cap for prop firms).
Future trades per run: 0 uses the same number of trades as your historical data. Increasing this value extends the simulation's lookahead period.
Simulated runs: Range from 1,000 to 100,000, with a default of 10,000.
Fewest history trades for a verdict: Default is 30.
Important Notes
This script only reads historical data and does not execute trades, allowing it to run alongside live Expert Advisors.
The random number generation starts from a fixed seed, ensuring consistent results when rerunning the script with the same history and inputs.
With fewer than 30 historical trades, the R-multiple distribution used by the simulation may be unstable. Interpret the results as approximate guidance rather than definitive conclusions.
A zero probability of ruin at a specific risk level does not guarantee that ruin is impossible. It signifies that ruin did not occur within the simulated runs based on your past trading data. Trades with extreme outcomes that have not occurred in your history will not be represented in the simulation.
YuRaLytics Trade Analyzer, available free on the Market, performs this test along with edge-or-luck analysis, cost accounting, and losing-streak checks for all Expert Advisors and symbols simultaneously within a chart panel.
Edge or Luck, available free in the Code Base, offers a complementary test to determine if your average trade outcome is statistically significant beyond random chance.
A web-based version of this test, a losing-streak probability calculator, and comprehensive backtest analyses that formed the basis for this script are available at
yuratrading.com/tools/risk-of-ruin-calculator
.
This analysis is based on data and methodologies up to 2026.
You may also like: Contract Sizer: A Risk Management Tool with Ladder, Floor, and Breaker Protections - excellent alternative for script users on MetaTrader 5.
Source Code
#property copyright "RobotFX"
#property link "https://robotfx.org"
#property version     "1.00"
#property description "This code is educational. Feel free to use, modify and upgrade as you wish. Visit ROBOTFX.ORG for professional trading tools"
#property script_show_inputs
#include <Generic\HashMap.mqh>
input long   InpMagic        = -1;
input string InpSymbol       = "";
input int    InpDays         = 0;
input double InpRiskPct      = 1.0;
.......
⚠ Limitations & Risk Warning
- This tool is provided for educational and testing purposes only.
- Past performance does not guarantee future results.
- Trading involves substantial risk of loss. Use on a demo account first.
- Results may vary depending on market conditions, broker, and settings.
- We recommend thorough backtesting and forward testing before using with real funds.