



VQ Bars Trend Indicator
Info
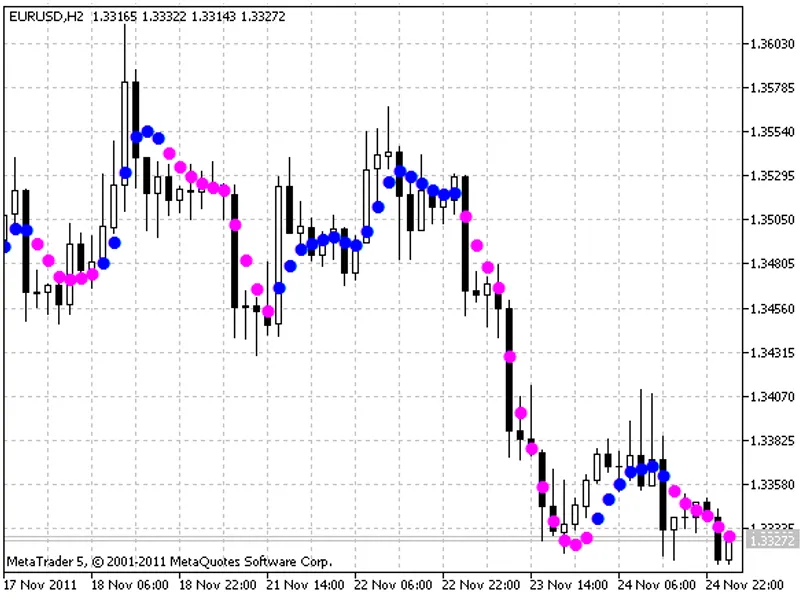
The VQ Bars Trend Indicator is a Indicator for MetaTrader 5 that vq bars indicatorthe vq bars indicator displays colored dots on the price chart to indicate the trend direction. It supports various smoothing methods, including:- Simple Moving Average- Exponential Moving Average- Smoothed Moving Average- Linear Weighted Moving Average- JMA Adaptive Average- Ultralinear Smoothing- Parabolic Smoothing- Tillson's Multiple Exponential Smoothing- Smoothing using Tushar Chande's algorithm- Smoothing using Perry Kaufman's algorithmIt is important to understand that phase parameters differ in meaning across various smoothing algorithms.
Usage
This tool is typically used for trend following strategies across multiple currency pairs.
Platform
This Indicator works exclusively on MetaTrader 5 (both build 600+ and newer versions).
Setup
Place the downloaded file in MQL5/Indicators folder via File ? Open Data Folder in MetaTrader 5.
How to Install and Use VQ Bars Trend Indicator
1. Installation: Place your file in the MQL/Indicators folder via "Open Data Folder" and restart your terminal.
2. Loading: Find the indicator in the Navigator, drag it onto your chart, and configure the input parameters in the popup window.
3. Customization: Press Ctrl+I to open the indicator list, select your tool, and click "Properties" to change colors, levels, or visual styles.
4. Updating: Replace the old file in the Indicators folder with the new version and restart the platform to apply changes.
Frequently Asked Questions
Q: Why is my indicator not showing? A: Verify the file is in the MQL/Indicators folder, or try right-clicking the "Indicators" tree in the Navigator and clicking "Refresh."
Q: Do custom indicators slow down the platform? A: Too many complex indicators can impact performance; remove unused ones via the "Indicator List" (Ctrl+I).
Q: Can I use MT4 indicators on MT5? A: No, MQL4 and MQL5 are distinct languages; ensure the indicator is compiled specifically for your platform version.
What this tool does
VQ Bars IndicatorThe VQ Bars indicator displays colored dots on the price chart to indicate the trend direction.
Typical Use Case
This Indicator excels in trend following on MetaTrader 5.
Compatible Platform & Setup
This Indicator works on MetaTrader 5. Place the file in the MQL5/Indicators folder and restart the terminal.
Description & Settings
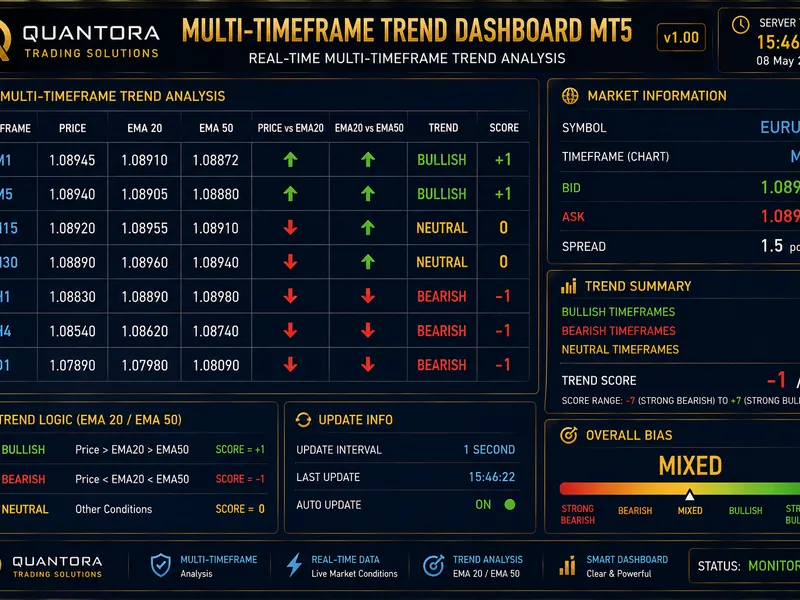
Related: Quantora Multi-Timeframe Trend Dashboard MT5 - Professional EMA Trend Analysis - another powerful indicator for MetaTrader 5 traders.
VQ Bars IndicatorAlso recommended: Quantora Multi-Timeframe MACD Dashboard MT5 - Professional Momentum and Trend Analysis - similar indicator with strong performance on MetaTrader 5.
The VQ Bars indicator displays colored dots on the price chart to indicate the trend direction.
It supports various smoothing methods, including:
- Simple Moving Average
- Exponential Moving Average
- Smoothed Moving Average
- Linear Weighted Moving Average
- JMA Adaptive Average
- Ultralinear Smoothing
- Parabolic Smoothing
- Tillson's Multiple Exponential Smoothing
- Smoothing using Tushar Chande's algorithm
- Smoothing using Perry Kaufman's algorithm
It is important to understand that phase parameters differ in meaning across various smoothing algorithms. For JMA, it's an external phase variable ranging from -100 to +100. For T3, it's a smoothing ratio multiplied by 100 for improved visualization. For Vidya, it represents the CMO oscillator period, and for AMA, it's the slow EMA period. For other algorithms, these parameters do not influence smoothing.
For AMA, the fast EMA period is a fixed value of 2 by default. The ratio for raising to the power is also set to 2 for AMA.
This indicator utilizes classes from the smoothalgorithms.mqh library, which must be copied to the terminal_data_folder\mql5\include directory.
This indicator was initially developed for MQL4 and released on July 17, 2026.
You may also like: Quantora Moving Average Dashboard MT5 - Professional EMA SMA Trend Analysis - excellent alternative for indicator users on MetaTrader 5.
Source Code
#property copyright "robotfx"
#property link "https://robotfx.org"
#property description "this code is educational. feel free to use, modify and upgrade as you wish. visit robotfx.org for professional trading tools"
#property version   "1.00"
#property indicator_chart_window
#property indicator_buffers 2
#property indicator_plots   1
#property indicator_type1   draw_color_arrow
#property indicator_color1  gray,magenta,blue
#property indicator_width1  4
.......
⚠ Limitations & Risk Warning
- This tool is provided for educational and testing purposes only.
- Past performance does not guarantee future results.
- Trading involves substantial risk of loss. Use on a demo account first.
- Results may vary depending on market conditions, broker, and settings.
- We recommend thorough backtesting and forward testing before using with real funds.