
volume profile
Info
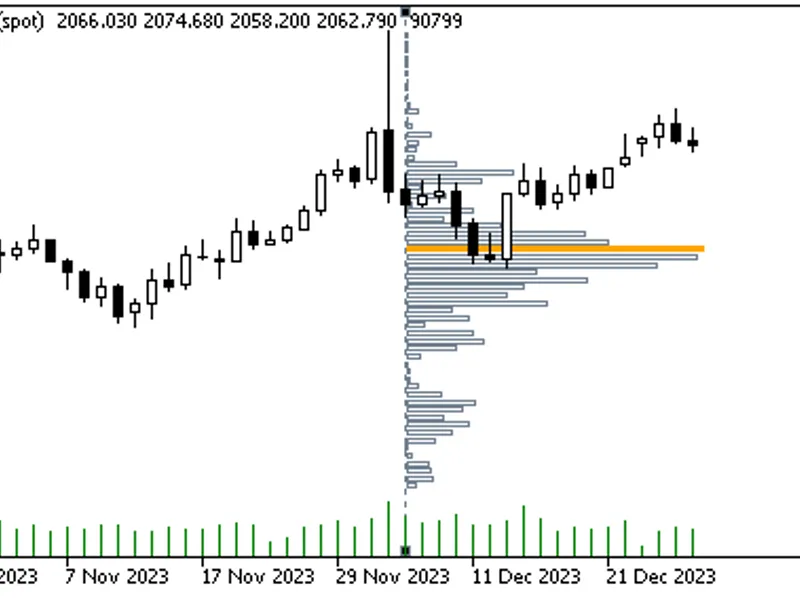
The volume profile is a Indicator for MetaTrader 5 that what is volume profile. the volume profile tool, also known as horizontal volume, illustrates transaction volume at each price within a specific time range using a horizontal histogram chart.
Usage
This tool is typically used for enhancing chart analysis and decision making.
Platform
This Indicator works exclusively on MetaTrader 5 (both build 600+ and newer versions).
Setup
Place the downloaded file in MQL5/Indicators folder via File ? Open Data Folder in MetaTrader 5.
How to Install and Use volume profile
1. Installation: Place your file in the MQL/Indicators folder via "Open Data Folder" and restart your terminal.
2. Loading: Find the indicator in the Navigator, drag it onto your chart, and configure the input parameters in the popup window.
3. Customization: Press Ctrl+I to open the indicator list, select your tool, and click "Properties" to change colors, levels, or visual styles.
4. Updating: Replace the old file in the Indicators folder with the new version and restart the platform to apply changes.
Frequently Asked Questions
Q: Why is my indicator not showing? A: Verify the file is in the MQL/Indicators folder, or try right-clicking the "Indicators" tree in the Navigator and clicking "Refresh."
Q: Do custom indicators slow down the platform? A: Too many complex indicators can impact performance; remove unused ones via the "Indicator List" (Ctrl+I).
Q: Can I use MT4 indicators on MT5? A: No, MQL4 and MQL5 are distinct languages; ensure the indicator is compiled specifically for your platform version.
What this tool does
what is volume profile.
Typical Use Case
This Indicator excels in automated trading and technical analysis on MetaTrader 5.
Compatible Platform & Setup
This Indicator works on MetaTrader 5. Place the file in the MQL5/Indicators folder and restart the terminal.
Description & Settings
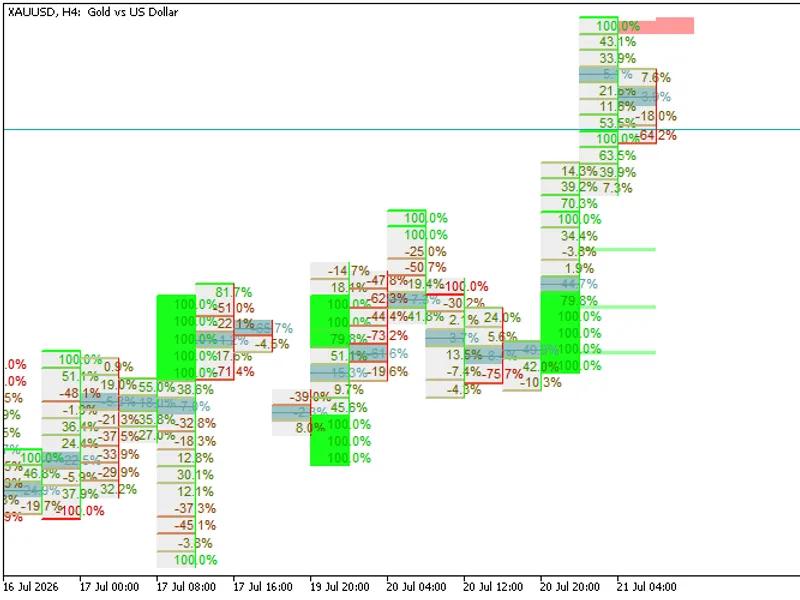
Related: Footprint X Ray: Advanced Order Flow and Volume Delta Analysis - another powerful indicator for MetaTrader 5 traders.
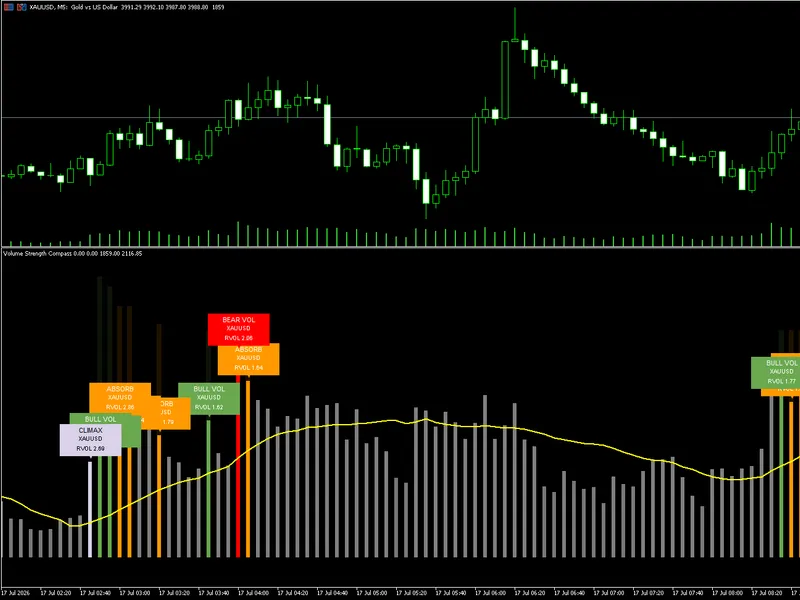
what is volume profile?Also recommended: Volume Strength Compass by Bhanu Code Lab - similar indicator with strong performance on MetaTrader 5.
the volume profile tool, also known as horizontal volume, illustrates transaction volume at each price within a specific time range using a horizontal histogram chart. longer bars indicate higher transaction volume at that price, while shorter bars represent lower transaction activity. the calculations in this indicator are executed in a simple way, allowing for high-speed, lightweight execution.how to use
to display the volume profile within a specific time interval, place two vertical lines that appear after executing the indicator at the start and end of that interval. adjusting these lines will change the volume profile based on the selected interval.
sample screenshot input settings
calculation timeframe
: the assumption behind the calculations of this indicator is that volume is distributed evenly throughout the candle length (from its low to high), which may lead to less accurate results, especially when using small time ranges (see figure 1). by changing this option in the input section, calculations can be based on lower timeframes (e.g., 1 minute), resulting in accurate results almost comparable to using tick data for calculation (see figure 2).
number of vp bars
: the number of histogram bars, where smaller numbers show the
range of price
where most transactions have taken place, and larger numbers show the
exact prices
where most transactions have occurred. when changing this input, the position of the point of control (poc) may shift, but it is not due to a mistake in the calculations or errors in the code, it is because you are looking for something different.
applied volume
: the default applied volume is real volume. however, selecting 'tick_volume' in the input, or in the absence of real volume data on the server, the indicator will use tick volume data.
maximum vp bar length to chart width ratio
: you can adjust the length of the vp bars relative to the width of your chart.
figure 1: calculation based on current timeframe
figure 2: calculation based on 1-minute timeframe caution
when using lower timeframes for calculation, the indicator requires the price data of that timeframe, which may not have been downloaded already. it may take some time to download, so please be patient and drag and drop the vertical lines until the downloading is complete!
i hope it will help you in making successful trades and make me happy by commenting the mistakes and errors in the code!
You may also like: institutional harmonic volumetric gravity center indicator - excellent alternative for indicator users on MetaTrader 5.
Source Code
#property copyright "robotfx"
#property link "https://robotfx.org"
#property version   "1.00"
#property indicator_chart_window
#property indicator_buffers 0
#property indicator_plots   0
input enum_timeframes      tf0=period_current; // calcualtion timeframe
input int                  precision = 100; // number of vp bars
input enum_applied_volume  av = volume_real; // applied volume
input double               ratio=0.25; // ratio of maximum vp bar length to chart width
.......
⚠ Limitations & Risk Warning
- This tool is provided for educational and testing purposes only.
- Past performance does not guarantee future results.
- Trading involves substantial risk of loss. Use on a demo account first.
- Results may vary depending on market conditions, broker, and settings.
- We recommend thorough backtesting and forward testing before using with real funds.