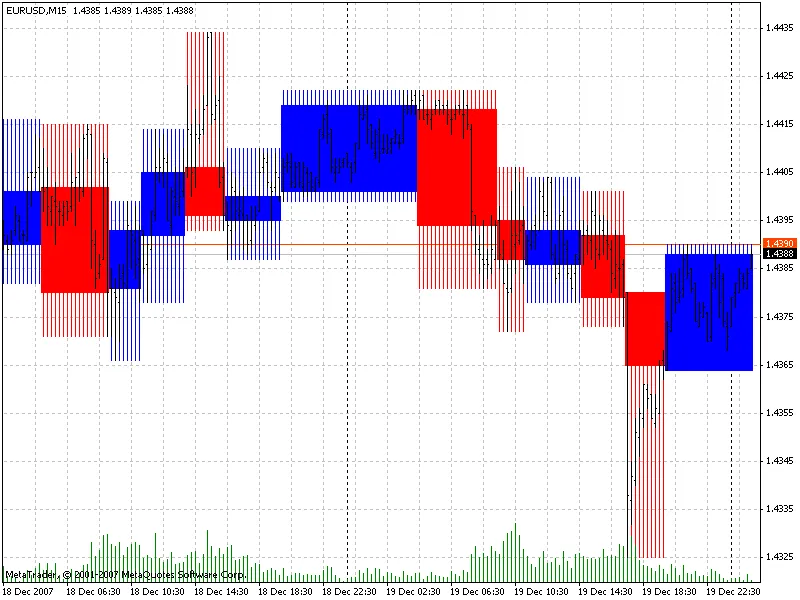
Trend Range
This is a powerful addition to your MetaTrader 5 toolkit designed to optimize market analysis and performance. This technical indicator acts as a specialized analysis tool designed to visualize market data. It helps traders identify emerging trends, momentum shifts, and key support or resistance levels by plotting statistical calculations directly onto price charts.
How to Setup and Use Trend Range
1. Installation: Place your file in the MQL/Indicators folder via "Open Data Folder" and restart your terminal.
2. Loading: Find the indicator in the Navigator, drag it onto your chart, and configure the input parameters in the popup window.
3. Customization: Press Ctrl+I to open the indicator list, select your tool, and click "Properties" to change colors, levels, or visual styles.
4. Updating: Replace the old file in the Indicators folder with the new version and restart the platform to apply changes.
Frequently Asked Questions
Q: Why is my indicator not showing? A: Verify the file is in the MQL/Indicators folder, or try right-clicking the "Indicators" tree in the Navigator and clicking "Refresh."
Q: Do custom indicators slow down the platform? A: Too many complex indicators can impact performance; remove unused ones via the "Indicator List" (Ctrl+I).
Q: Can I use MT4 indicators on MT5? A: No, MQL4 and MQL5 are distinct languages; ensure the indicator is compiled specifically for your platform version.
Description & Settings
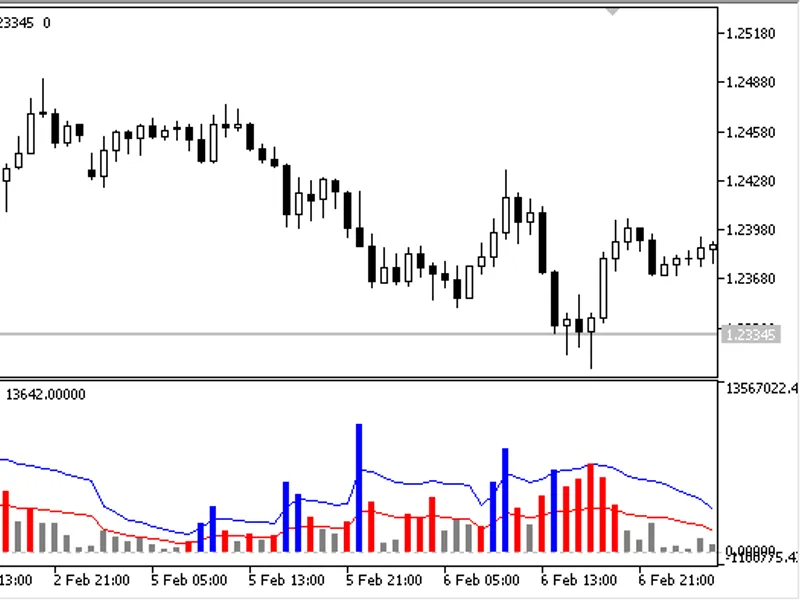
The oscillator indicator draws a histogram (with border levels at two moving averages on the indicator histogram) showing three market states: a trend, a moderate or fading trend and a flat.
If the histogram bar (blue) is above the upper level (blue line), then there is a strong movement in the market;
If the histogram bar (red) is between the upper and lower levels (between the blue and red lines), then there is either a moderate or fading trend;
If the histogram bar (gray) is below the lower level (below the red line), then the market movement is weak and flat.
The indicator has three input parameters:
Period
- calculation period;
Method
- smoothing method;
Deviation
- deviation for the calculation of threshold levels.