
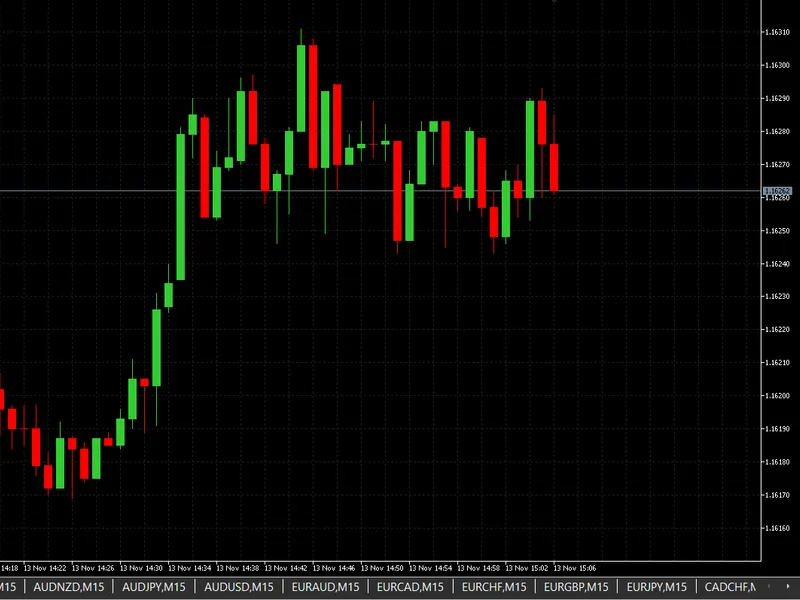
atr normalize and range rider
Info
The atr normalize and range rider is a Indicator for MetaTrader 4 that this is a variant of my translation of larry williams' key points on using indicators in trading. see lessons 11 and 14 in the archive for the full details.
Usage
This tool is typically used for enhancing chart analysis and decision making.
Platform
This Indicator works exclusively on MetaTrader 4 (both build 600+ and newer versions).
Setup
Place the downloaded file in MQL4/Indicators folder via File ? Open Data Folder in MetaTrader 4.
How to Install and Use atr normalize and range rider
1. Installation: Place your file in the MQL/Indicators folder via "Open Data Folder" and restart your terminal.
2. Loading: Find the indicator in the Navigator, drag it onto your chart, and configure the input parameters in the popup window.
3. Customization: Press Ctrl+I to open the indicator list, select your tool, and click "Properties" to change colors, levels, or visual styles.
4. Updating: Replace the old file in the Indicators folder with the new version and restart the platform to apply changes.
Frequently Asked Questions
Q: Why is my indicator not showing? A: Verify the file is in the MQL/Indicators folder, or try right-clicking the "Indicators" tree in the Navigator and clicking "Refresh."
Q: Do custom indicators slow down the platform? A: Too many complex indicators can impact performance; remove unused ones via the "Indicator List" (Ctrl+I).
Q: Can I use MT4 indicators on MT5? A: No, MQL4 and MQL5 are distinct languages; ensure the indicator is compiled specifically for your platform version.
What this tool does
this is a variant of my translation of larry williams' key points on using indicators in trading.
Typical Use Case
This Indicator excels in automated trading and technical analysis on MetaTrader 4.
Compatible Platform & Setup
This Indicator works on MetaTrader 4. Place the file in the MQL4/Indicators folder and restart the terminal.
Description & Settings
Related: average daily range indicator - another powerful indicator for MetaTrader 4 traders.
this is a variant of my translation of larry williams' key points on using indicators in trading.Also recommended: institutional ict killzones and asian range indicator - similar indicator with strong performance on MetaTrader 4.
see lessons 11 and 14 in the archive for the full details.
this is an indicator that
can
clearly and precisely
determine
when
the price is making peaks and troughs.
when it is in a
high
zone, it usually indicates that the price of the instrument will fall, and when it is in a
low
zone, it indicates that prices will rise.
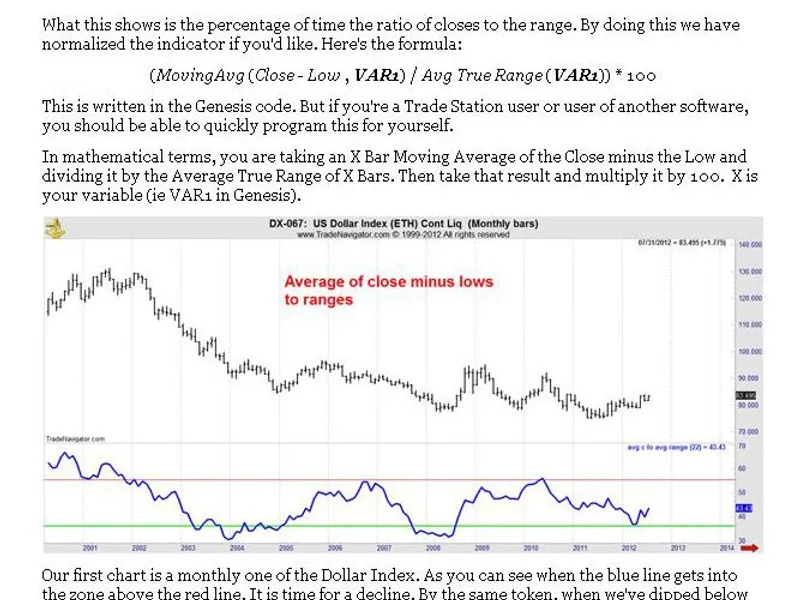
here is the formula for this normalized indicator:
(movingavg (close - low, var1) / average true range (var1)) * 100, var1 = 18 or 22 or another value. determined by history.
the first chart is of the monthly dollar index.
as you can see, when the blue line enters the zone above the red line, it is time for a decline.
also, when the indicator
drops below the green line and the market closes near the low monthly range, it is time to buy.
now let's look at the daily chart.
this works on all timeframes from month to m30.
you have learned about the natural price cycle, which creates peaks and troughs.
i want to show you the following
price cycle, which tells us when the market is most likely to enter a trading range or start a trend.
the range rider indicator.
here is an indicator that makes it easy for you to see when the market is likely to start a new trend or stop a trend or go into a trading range.
there are price cycles in stocks or commodities.
one of these cycles is based on prices going from small ranges to large ranges.
this is a very simple indicator.
i take the average range of the last two days and divide it by the average range of the last seven days.
this allows you to compare and see when the current range is small or large compared to recent daily ranges.
this gives a very clear picture of when ranges were consolidating or expanding.
here are these cycles and they are defined.
when the index is very high, there were large ranges, and you should expect that the next part of the cycle will become more active.
this means that narrow ranges will follow.
when the indicator is very low, there are small ranges, and it is time for trends to break out of consolidation and start moving.
on the chart below, i show the most widely used commodity in the world, e-mini s&p.
the green line indicates when we see a small range compared to the ranges of the last seven days.
the formula is quite simple: movingavg (true range, vara) / (movingavg (true range, varb)) * 100
var1 = 18 or 22 or another value. determined by history.
all i do is divide the average true range of the last two days by the average true range of the last seven days.
this allows you to see when there has been a reduction in the range, which of course leads us to expect an upcoming expansion of daily ranges.
take a moment to look at the cases where i have placed red vertical lines on the chart above, and you will see that what usually follows shortly after is an expansion of daily ranges.
in the next chart (see below) - gold.
you can see the same time period.
this indicator indicates that large ranges are expected when it is below the green line, because there is currently a reduction in ranges.
the indicator allows you to clearly see the range cycle, in particular the transition from large to small.
the cycle is very real, and traders should fully understand it.
so let's declare this again:
markets are cyclical, from small ranges to large ranges, then return from large ranges to small ranges.
markets top out by closing at or near the high of the bar and bottom out by closing at or near the low of the bar.
now, when you look at your charts, ask yourself, "what are the current price cycles?"
do this, and you will become a much better trader.
You may also like: session range boxes for asian, london, and new york trading sessions - excellent alternative for indicator users on MetaTrader 4.
Source Code
#property copyright "robotfx"
#property indicator_separate_window
#property indicator_buffers 1
#property indicator_color1 dodgerblue
extern int atrperiod=14;
double atrbuffer[];
double tempbuffer1[];
double tempbuffer2[];
int init()
  {
.......
⚠ Limitations & Risk Warning
- This tool is provided for educational and testing purposes only.
- Past performance does not guarantee future results.
- Trading involves substantial risk of loss. Use on a demo account first.
- Results may vary depending on market conditions, broker, and settings.
- We recommend thorough backtesting and forward testing before using with real funds.