
Trade Journal and Performance Analytics Dashboard MT4/MT5
Info
The Trade Journal and Performance Analytics Dashboard MT4/MT5 is a Indicator for MetaTrader 5 that trade analytics dashboardthe conceptthis tool is built on a straightforward principle: your trading account already contains an accurate performance report; you simply need to access and interpret it. Instead of exporting your trading history to a separate spreadsheet, this indicator directly queries the terminal's closed deal history using HistorySelect() and HistoryDealGetTicket().
Usage
This tool is typically used for enhancing chart analysis and decision making.
Platform
This Indicator works exclusively on MetaTrader 5 (both build 600+ and newer versions).
Setup
Place the downloaded file in MQL5/Indicators folder via File ? Open Data Folder in MetaTrader 5.
How to Install and Use Trade Journal and Performance Analytics Dashboard MT4/MT5
1. Installation: Place your file in the MQL/Indicators folder via "Open Data Folder" and restart your terminal.
2. Loading: Find the indicator in the Navigator, drag it onto your chart, and configure the input parameters in the popup window.
3. Customization: Press Ctrl+I to open the indicator list, select your tool, and click "Properties" to change colors, levels, or visual styles.
4. Updating: Replace the old file in the Indicators folder with the new version and restart the platform to apply changes.
Frequently Asked Questions
Q: Why is my indicator not showing? A: Verify the file is in the MQL/Indicators folder, or try right-clicking the "Indicators" tree in the Navigator and clicking "Refresh."
Q: Do custom indicators slow down the platform? A: Too many complex indicators can impact performance; remove unused ones via the "Indicator List" (Ctrl+I).
Q: Can I use MT4 indicators on MT5? A: No, MQL4 and MQL5 are distinct languages; ensure the indicator is compiled specifically for your platform version.
What this tool does
Trade Analytics DashboardThe ConceptThis tool is built on a straightforward principle: your trading account already contains an accurate performance report; you simply need to access and interpret it.
Typical Use Case
This Indicator excels in automated trading and technical analysis on MetaTrader 5.
Compatible Platform & Setup
This Indicator works on MetaTrader 5. Place the file in the MQL5/Indicators folder and restart the terminal.
Description & Settings
Related: Quantora Trading Journal Panel MT5 - Professional Daily Trading Performance Analyzer - another powerful indicator for MetaTrader 5 traders.
Trade Analytics DashboardAlso recommended: MT5 Trade Report Table: Comprehensive Account Statistics - similar indicator with strong performance on MetaTrader 5.
The Concept
This tool is built on a straightforward principle: your trading account already contains an accurate performance report; you simply need to access and interpret it. Instead of exporting your trading history to a separate spreadsheet, this indicator directly queries the terminal's closed deal history using HistorySelect() and HistoryDealGetTicket(). It then aggregates this data and displays the results in a compact panel rendered directly on your chart using the CCanvas class. The indicator does not analyze price action, nor does it place, modify, or close any orders. Its sole function is to read your previously executed deals, thus requiring no AutoTrading permissions.
Interpreting the Panel
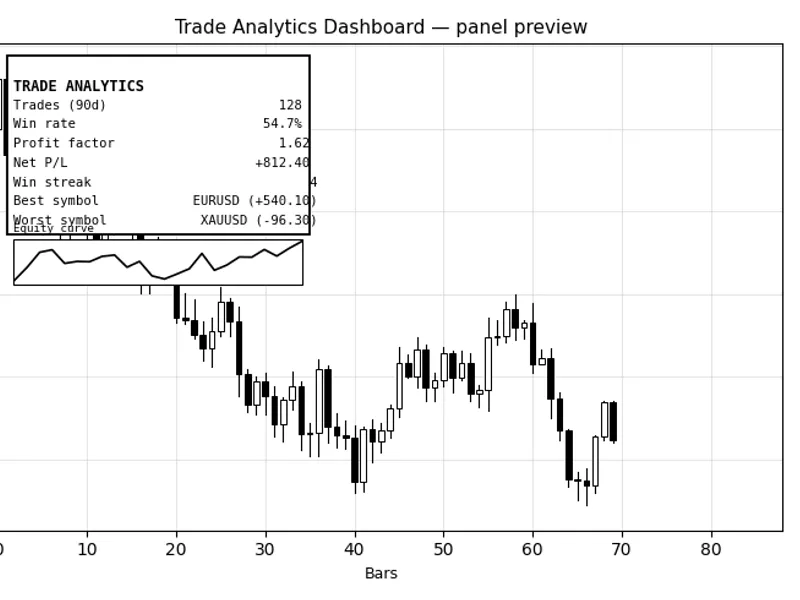
Each metric presented on the panel provides specific insights into your trading performance over a user-defined lookback period:
Trades (Nd)
- This shows the number of closed trades within the specified lookback window. Please note that performance metrics based on a small number of trades (typically under 30) should be considered preliminary rather than definitive.
Win Rate
- This represents the percentage of closed trades that resulted in a profit or break-even, including commission and swap fees. A win rate alone does not guarantee profitability; a system with a 30% win rate can still be highly profitable if winning trades are significantly larger than losing ones.
Profit Factor
- Calculated as gross profit divided by gross loss. A profit factor above 1.0 indicates that winning trades outweigh losing trades within the window. A factor below 1.0 signifies the opposite, regardless of the win rate.
Net P/L
- The net profit or loss after accounting for commissions and swaps. This value is color-coded for immediate visual identification of losing periods.
Win Streak / Loss Streak
- This indicates the number of consecutive trades that closed with a win or a loss, counting back from the most recent trade. This metric is useful for identifying deviations from a system's typical performance patterns.
Best Symbol / Worst Symbol
- Identifies the trading instrument that contributed the most profit and the least profit (or greatest loss) to the net result within the lookback window. This helps uncover symbols that may be disproportionately affecting overall account performance.
Equity Curve
- A visual representation of the cumulative net P/L over the lookback window, displayed as a simple line graph to easily discern trends without needing to read specific values.
It is important to understand that none of these metrics serve as direct trading signals. The primary purpose of this panel is to provide an honest and objective assessment of your trading activity: Is your strategy performing as expected, or is it merely perceived to be doing so?
External Variables (Inputs)
All configurable options are organized within the Inputs tab under the categories Panel, Data Scope, and Colors. These settings can be adjusted per chart without needing to modify the source code:
Input
Default
Purpose
InpCorner
Left Upper
Determines the chart corner where the panel will be anchored.
InpOffsetX / InpOffsetY
12 / 18
Specifies the pixel offset of the panel from the chosen corner.
InpPanelWidth / InpPanelHeight
300 / 250
Sets the dimensions of the panel in pixels.
InpRefreshSecs
5
Defines how frequently the panel re-reads historical data and updates its display, independent of new price ticks.
InpHistoryDays
90
Specifies the number of past days of closed deal history to include in the performance statistics.
InpAllSymbols
true
If set to true, the panel aggregates performance data for all symbols traded on the account. If set to false, it restricts the analysis to the symbol of the current chart only.
InpBackColor
dark navy
Sets the background color of the panel.
InpBorderColor
amber
Sets the color of the panel border.
InpTextColor
off-white
Defines the color for primary labels and values displayed on the panel.
InpAccentColor
amber
Sets the color for the panel's title text.
InpProfitColor
blue
The color used to indicate positive net results, winning streaks, and an upward-trending equity curve.
InpLossColor
red
The color used to indicate negative net results, losing streaks, and a downward-trending equity curve.
Recommended Usage
As an indicator rather than an Expert Advisor, this tool is not linked to a specific symbol or timeframe. You can apply it to any chart, and it will analyze your account's overall trading history. If you manage multiple symbols within a single account, setting InpAllSymbols to true provides a comprehensive overview. Alternatively, setting it to false on a specific chart allows for a focused performance evaluation of that particular instrument.
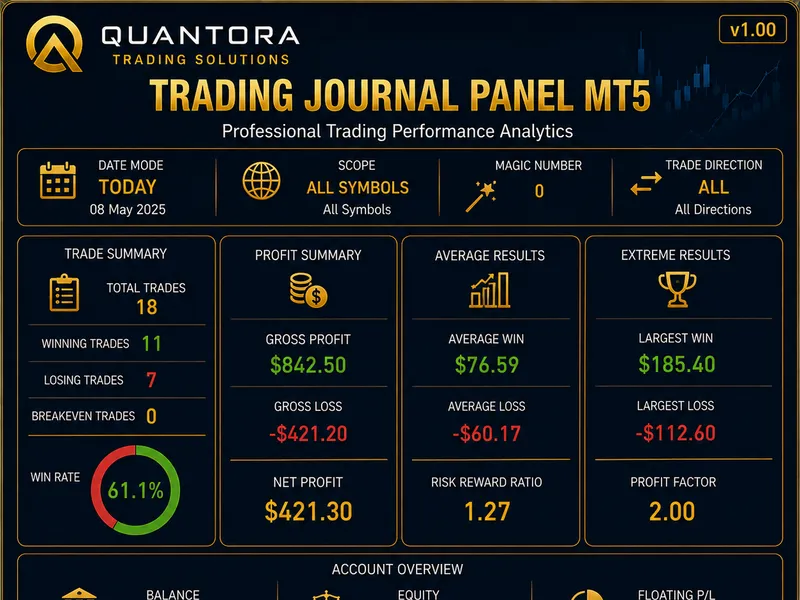
Figure 1. The panel as it appears on a chart, displaying trade count, win rate, profit factor, net P/L, current streak, best/worst symbol, and an equity curve sparkline. Rendered in neutral colors for clarity, as per standard guidelines.
You may also like: Session High-Low Indicator for MetaTrader - excellent alternative for indicator users on MetaTrader 5.
Source Code
#property copyright "RobotFX"
#property link "https://robotfx.org"
#property version   "1.00"
#property strict
#property indicator_chart_window
#property indicator_buffers 0
#property indicator_plots   0
#include <Canvas\Canvas.mqh>
input group "=== Panel ==="
input ENUM_BASE_CORNER InpCorner        = CORNER_LEFT_UPPER;
.......
⚠ Limitations & Risk Warning
- This tool is provided for educational and testing purposes only.
- Past performance does not guarantee future results.
- Trading involves substantial risk of loss. Use on a demo account first.
- Results may vary depending on market conditions, broker, and settings.
- We recommend thorough backtesting and forward testing before using with real funds.