Range Volume Ratio S
This is a powerful addition to your MetaTrader 5 toolkit designed to optimize market analysis and performance. This technical indicator acts as a specialized analysis tool designed to visualize market data. It helps traders identify emerging trends, momentum shifts, and key support or resistance levels by plotting statistical calculations directly onto price charts.
How to Setup and Use Range Volume Ratio S
1. Installation: Place your file in the MQL/Indicators folder via "Open Data Folder" and restart your terminal.
2. Loading: Find the indicator in the Navigator, drag it onto your chart, and configure the input parameters in the popup window.
3. Customization: Press Ctrl+I to open the indicator list, select your tool, and click "Properties" to change colors, levels, or visual styles.
4. Updating: Replace the old file in the Indicators folder with the new version and restart the platform to apply changes.
Frequently Asked Questions
Q: Why is my indicator not showing? A: Verify the file is in the MQL/Indicators folder, or try right-clicking the "Indicators" tree in the Navigator and clicking "Refresh."
Q: Do custom indicators slow down the platform? A: Too many complex indicators can impact performance; remove unused ones via the "Indicator List" (Ctrl+I).
Q: Can I use MT4 indicators on MT5? A: No, MQL4 and MQL5 are distinct languages; ensure the indicator is compiled specifically for your platform version.
Description & Settings
Smoothed Range Volume Ratio is an oscillator based on indicator . It shows in a separate window, as a histogram, the candlestick size / tick volume ratios by two parameters:
Difference between Open and Close;
Difference between High and Low.
It also displays a signal line plotted by the method of smoothing the histogram values.
The color of the histogram columns can be displayed by two methods:
By the value of the previous column. If the previous column is above the signal line, then the color is green. Otherwise, it is orange;
One-color histogram - all columns are of one color.
The indicator has four input parameters:
Calculation type
- type of calculations:
Open/Close
- difference between Open and Close;
High/Low
- difference between High and Low.
Period
- smoothing period of the signal line;
MA Method
- signal line calculation method;
Colors setting
- color settings:
By previous bar position
- histogram column color by the value of the previous column;
One color
- one color.
Calculations:
If the calculation type is Open/Close:
If the calculation type is High/Low:
where:
Fig.1. Calculations by Open/Close, one color
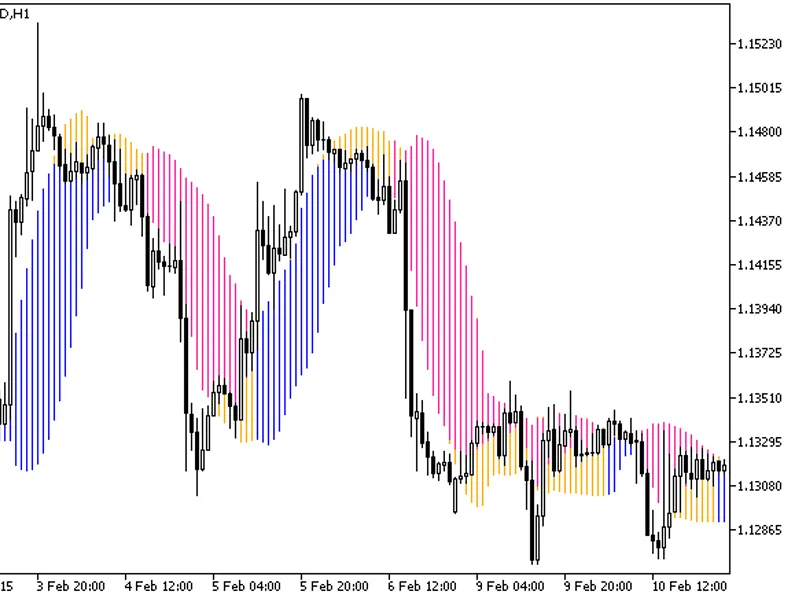
Fig.2. Calculations by Open/Close, the color by the value of the previous column
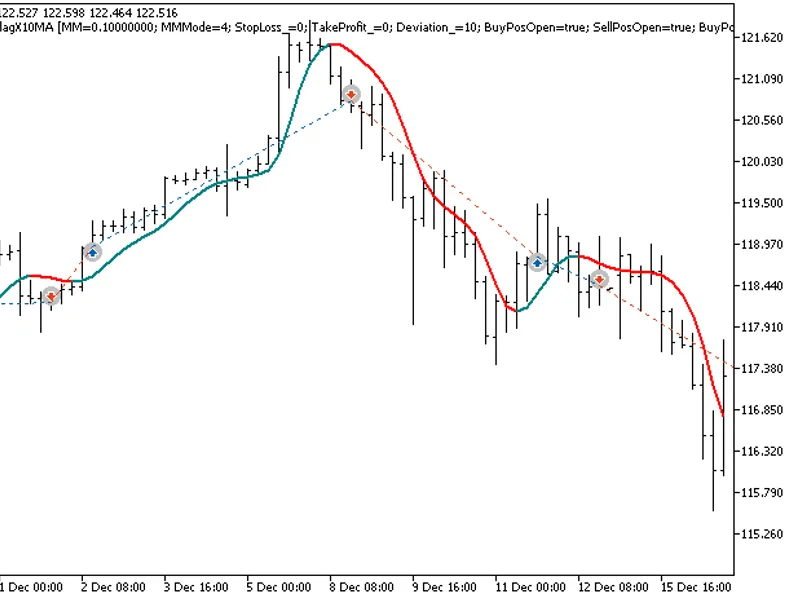
Fig.3. Calculations by High/Low, the color by the value of the previous column