











Footprint X Ray: Advanced Order Flow and Volume Delta Analysis
Info
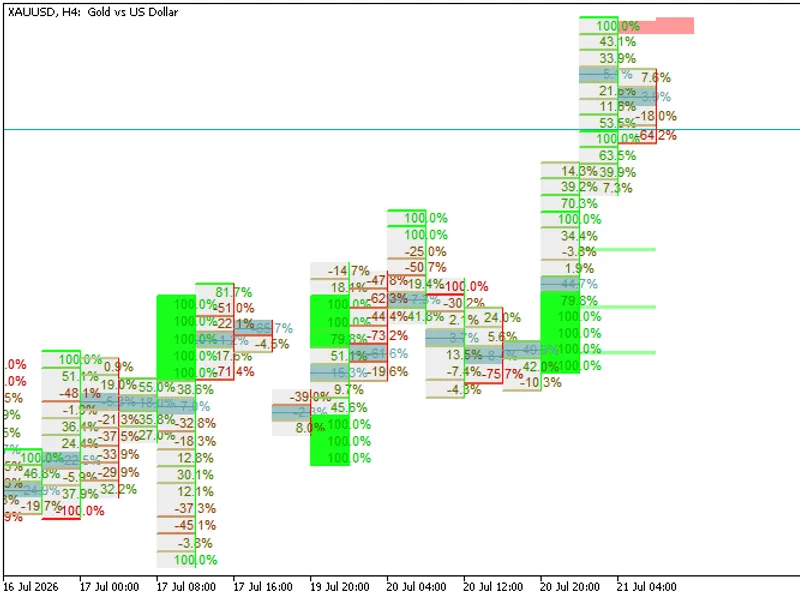
The Footprint X Ray: Advanced Order Flow and Volume Delta Analysis is a Indicator for MetaTrader 5 that an institutional-grade order flow and footprint chart indicator ported from pine script to mql5. It dynamically deconstructs major timeframe bars using lower timeframe (LTF) historical tick/real volume to compute buy/sell volume delta at each price level.
Usage
This tool is typically used for enhancing chart analysis and decision making.
Platform
This Indicator works exclusively on MetaTrader 5 (both build 600+ and newer versions).
Setup
Place the downloaded file in MQL5/Indicators folder via File ? Open Data Folder in MetaTrader 5.
How to Install and Use Footprint X Ray: Advanced Order Flow and Volume Delta Analysis
1. Installation: Place your file in the MQL/Indicators folder via "Open Data Folder" and restart your terminal.
2. Loading: Find the indicator in the Navigator, drag it onto your chart, and configure the input parameters in the popup window.
3. Customization: Press Ctrl+I to open the indicator list, select your tool, and click "Properties" to change colors, levels, or visual styles.
4. Updating: Replace the old file in the Indicators folder with the new version and restart the platform to apply changes.
Frequently Asked Questions
Q: Why is my indicator not showing? A: Verify the file is in the MQL/Indicators folder, or try right-clicking the "Indicators" tree in the Navigator and clicking "Refresh."
Q: Do custom indicators slow down the platform? A: Too many complex indicators can impact performance; remove unused ones via the "Indicator List" (Ctrl+I).
Q: Can I use MT4 indicators on MT5? A: No, MQL4 and MQL5 are distinct languages; ensure the indicator is compiled specifically for your platform version.
What this tool does
An institutional-grade order flow and footprint chart indicator ported from Pine Script to MQL5.
Typical Use Case
This Indicator excels in automated trading and technical analysis on MetaTrader 5.
Compatible Platform & Setup
This Indicator works on MetaTrader 5. Place the file in the MQL5/Indicators folder and restart the terminal.
Description & Settings
Related: BrainTrend2 Indicator - another powerful indicator for MetaTrader 5 traders.
An institutional-grade order flow and footprint chart indicator ported from Pine Script to MQL5.It dynamically deconstructs major timeframe bars using lower timeframe (LTF) historical tick/real volume to compute buy/sell volume delta at each price level.
Also recommended: rocket rs i - similar indicator with strong performance on MetaTrader 5.
The indicator features automatic timeframe selection, Point of Control (POC) highlighting, Stacked Imbalances, extreme Absorption detection, Unfinished Business (UB) tracking with live mitigation, and real-time alert triggers.
Key Features
Dynamic Column Widths
Footprint cells automatically adjust their horizontal dimensions based on MT5's visual chart zoom scale to maintain separation.
Auto-Scaling Font Engine
Text font sizes scale down automatically on smaller zooms and cleanly hide when zoomed out past readability.
Background Candle Toggle
Hide original background candles to render a clean order-flow layout, with safe visual restoration when the indicator is removed.
Performance Optimized
Restricts calculation to a user-defined lookback window to prevent CPU overhead and UI freezing.
Closed-Bar Alerts
Signals are evaluated on completed bars to prevent tick-by-tick alert spam.
Short Guide for Users
1. Installation
Open your MetaTrader 5 terminal.
Press F4 to open MetaEditor.
In the Navigator tree on the left, right-click the Indicators folder and select New File.
Choose Custom Indicator, name it FootPrint_X_Ray, and click Next until finished.
Paste the entire compiled .mq5 code into the workspace, replacing all existing code.
Click the Compile button at the top.
Go back to MetaTrader 5, locate FootPrint_X_Ray under your Navigator's Indicators folder, and drag it onto your chart.
2. Best Practices & Tweaks
Hiding Default MT5 Candles
For the clearest visual layout, keep Hide Background Candles set to true.
This hides the default bodies so you can focus strictly on the footprint cells.
The indicator safely restores your native chart template colors when detached.
Adjusting Column Spacing
If the columns appear too thin or fat on your monitor, use the Width Spacing Multiplier parameter.
Setting it to 0.80 will compress the boxes slightly, while 1.20 will expand them.
Font Legibility
If the numbers are too small or overlapping, adjust the Base Footprint Font Size (defaults to 8).
Calculation Limit
The indicator is optimized to draw footprints on the most recent 25 bars by default.
If you need a deeper lookback and your terminal has a fast processor, you can increase Max Bars to Render in the inputs.
Data Requirements
Make sure your broker provides volume data (either tick or real volume).
When loading on a new chart, MT5 may take a moment to download the required lower timeframe historical data (M1/M5) to compute the deltas.
You may also like: MA Distance from Price Indicator - excellent alternative for indicator users on MetaTrader 5.
Source Code
яю
#property copyright "RobotFX"
#property link "https://robotfx.org"
#property version   "1.00"
#property indicator_chart_window
#property indicator_buffers 5
#property indicator_plots   5
#property indicator_label1  "Bullish Absorption"
#property indicator_type1   DRAW_ARROW
#property indicator_color1  clrLime
.......
⚠ Limitations & Risk Warning
- This tool is provided for educational and testing purposes only.
- Past performance does not guarantee future results.
- Trading involves substantial risk of loss. Use on a demo account first.
- Results may vary depending on market conditions, broker, and settings.
- We recommend thorough backtesting and forward testing before using with real funds.