
Multi-Timeframe Trend Dashboard for MT5
Info
The Multi-Timeframe Trend Dashboard for MT5 is a Indicator for MetaTrader 5 that multi-timeframe trend dashboardthe multi-timeframe trend dashboard is a metatrader 5 indicator designed to analyze and display trend information across multiple timeframes directly on your chart. It calculates Exponential Moving Average (EMA) trends for selected timeframes and presents the results in a convenient panel.
Usage
This tool is typically used for trend following strategies across multiple currency pairs.
Platform
This Indicator works exclusively on MetaTrader 5 (both build 600+ and newer versions).
Setup
Place the downloaded file in MQL5/Indicators folder via File ? Open Data Folder in MetaTrader 5.
How to Install and Use Multi-Timeframe Trend Dashboard for MT5
1. Installation: Place your file in the MQL/Indicators folder via "Open Data Folder" and restart your terminal.
2. Loading: Find the indicator in the Navigator, drag it onto your chart, and configure the input parameters in the popup window.
3. Customization: Press Ctrl+I to open the indicator list, select your tool, and click "Properties" to change colors, levels, or visual styles.
4. Updating: Replace the old file in the Indicators folder with the new version and restart the platform to apply changes.
Frequently Asked Questions
Q: Why is my indicator not showing? A: Verify the file is in the MQL/Indicators folder, or try right-clicking the "Indicators" tree in the Navigator and clicking "Refresh."
Q: Do custom indicators slow down the platform? A: Too many complex indicators can impact performance; remove unused ones via the "Indicator List" (Ctrl+I).
Q: Can I use MT4 indicators on MT5? A: No, MQL4 and MQL5 are distinct languages; ensure the indicator is compiled specifically for your platform version.
What this tool does
Multi-Timeframe Trend DashboardThe Multi-Timeframe Trend Dashboard is a MetaTrader 5 indicator designed to analyze and display trend information across multiple timeframes directly on your chart.
Typical Use Case
This Indicator excels in trend following on MetaTrader 5.
Compatible Platform & Setup
This Indicator works on MetaTrader 5. Place the file in the MQL5/Indicators folder and restart the terminal.
Description & Settings
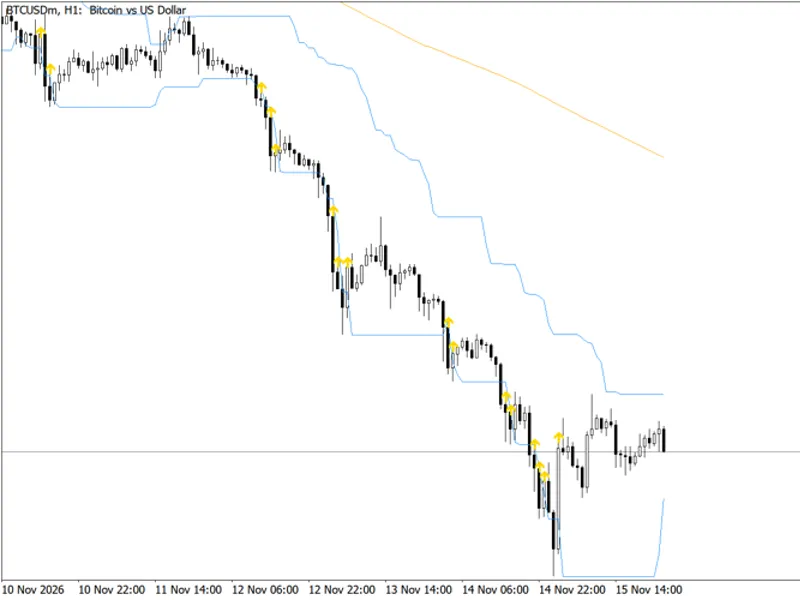
Related: Multi-Timeframe EMA Trend Direction Panel - another powerful indicator for MetaTrader 5 traders.
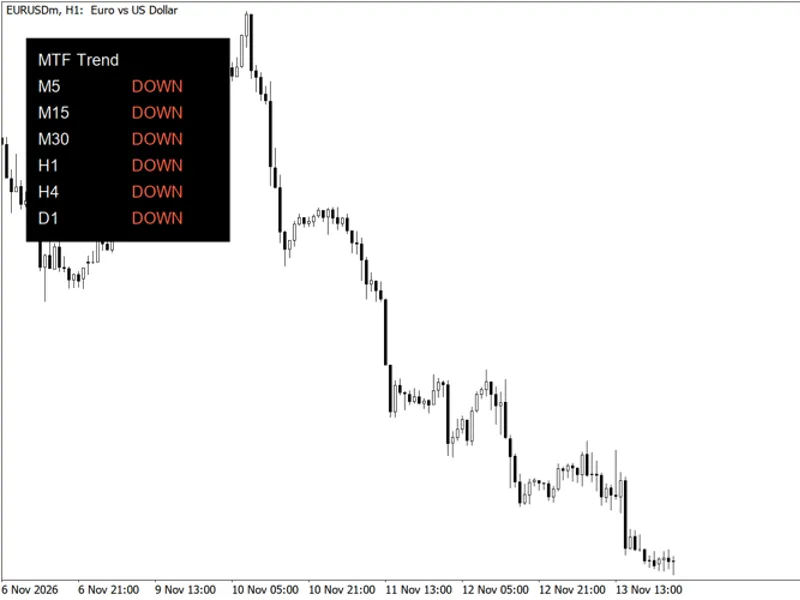
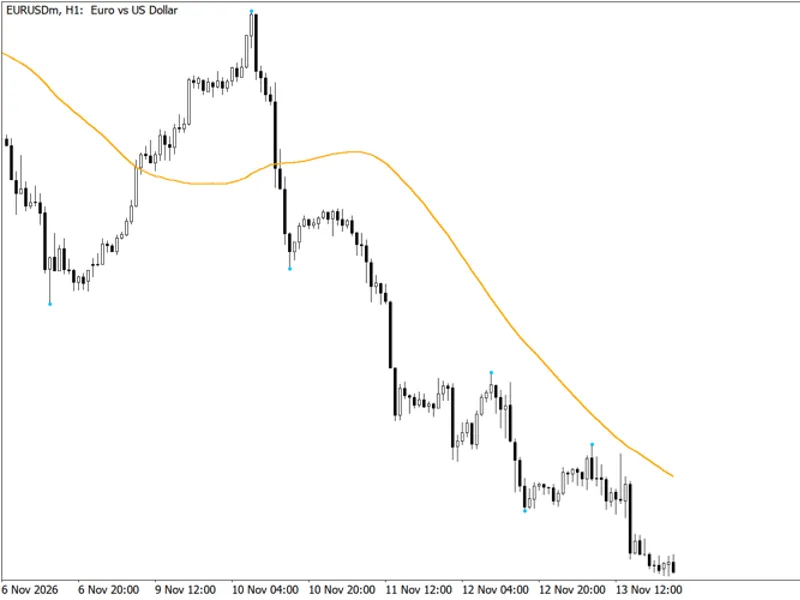
Multi-Timeframe Trend DashboardThe Multi-Timeframe Trend Dashboard is a MetaTrader 5 indicator designed to analyze and display trend information across multiple timeframes directly on your chart. It calculates Exponential Moving Average (EMA) trends for selected timeframes and presents the results in a convenient panel. Optionally, the EMA for the current chart timeframe can also be displayed as a line.
Also recommended: Confirmed Swing Pivots with Trend Moving Average - similar indicator with strong performance on MetaTrader 5.
This indicator focuses solely on trend analysis and does not perform any order management functions (placing, modifying, or closing orders).
Panel Information
For each enabled timeframe, the dashboard displays:
- The timeframe name (e.g., M15, H1, H4, D1, W1, and a sixth optional slot).
- The trend state: UP, DOWN, or FLAT.
- The price distance from the last close to the EMA, shown in both price units and as a multiple of the Average True Range (ATR).
- The number of bars the current trend state has persisted, up to a defined scan limit.
A summary line provides an overview of the trends across all monitored timeframes, indicating whether the overall market is "Aligned UP", "Aligned DOWN", or "Mixed".
Note: If the indicator is attached to a chart during a weekend or market closure, it will use the last available bar data for each timeframe, rather than live quotes.
Trend Determination Logic
The logic for determining the trend state is consistent across all timeframes and uses only closed and current bar data for that specific timeframe:
1. An EMA is calculated using the closing prices with a user-defined period (default is 50).
2. The slope of the EMA is measured over a short lookback period (default is 5 bars).
3. The ATR is calculated for the same timeframe (default period is 14) to provide a scale for the slope measurement.
4. A trend is classified as UP if the current close is above the EMA, and the EMA's slope is positive, exceeding a defined threshold (N * ATR, default N = 0.08).
5. A trend is classified as DOWN if the current close is below the EMA, and the EMA's slope is negative, falling below a defined threshold (-N * ATR).
6. Any other condition, including a close price on the opposite side of a sloping EMA or a slope smaller than the threshold, is classified as FLAT.
This method provides a concise representation of the local trend on each timeframe, not a direct trading signal or future prediction.
User Inputs
Timeframes:
- Six optional slots for defining the timeframes to monitor. Defaults include M15, H1, H4, D1, and W1. Duplicate timeframes are ignored.
Trend Rule Parameters:
- EMA Period: Sets the period for the Exponential Moving Average calculation.
- Slope Lookback: Defines the number of bars used to measure the EMA slope.
- ATR Period: Sets the period for the Average True Range calculation.
- Flat Threshold (in ATR units): Determines the minimum slope required to avoid a FLAT classification.
- Max Scan Bars: Sets the maximum number of bars to scan for calculating the duration of a trend state.
Display Settings:
- Plot Chart EMA: Option to display the EMA line for the current chart's timeframe.
- Show Panel: Toggle the visibility of the information panel.
- Panel Corner: Select the corner of the chart where the panel will be displayed.
- Offsets: Adjust the panel's position with horizontal and vertical offsets.
- Font Size: Customize the font size within the panel.
- Colors: Adjust the colors used for various elements in the panel.
System Requirements
- Platform: MetaTrader 5.
- Compatibility: Works on any trading symbol that provides sufficient historical bars for the selected timeframes.
- Independence: No external DLLs, WebRequests, or internet connection are required.
- Object Management: All graphical objects created by the indicator are automatically removed when the indicator is detached from the chart.
You may also like: Trend Filtered Donchian Breakout Channel - excellent alternative for indicator users on MetaTrader 5.
Source Code
#property copyright "RobotFX"
#property version     "1.00"
#property description "This code is educational. Feel free to use, modify and upgrade as you wish. Visit ROBOTFX.ORG for professional trading tools"
#property indicator_chart_window
#property indicator_buffers 1
#property indicator_plots   1
#property indicator_type1   DRAW_LINE
#property indicator_color1  C'201,168,74'
#property indicator_style1  STYLE_SOLID
#property indicator_width1  1
.......
⚠ Limitations & Risk Warning
- This tool is provided for educational and testing purposes only.
- Past performance does not guarantee future results.
- Trading involves substantial risk of loss. Use on a demo account first.
- Results may vary depending on market conditions, broker, and settings.
- We recommend thorough backtesting and forward testing before using with real funds.