
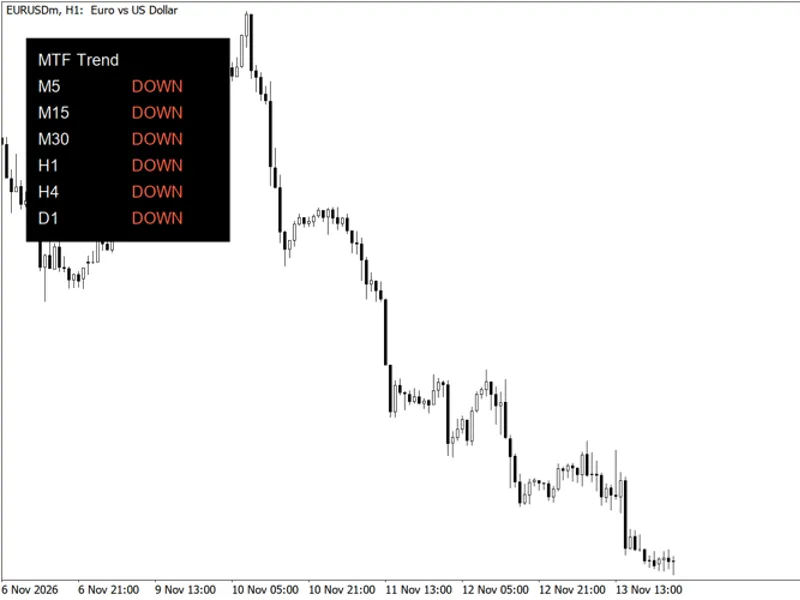
MTF Trend Dashboard — trend, position and volatility on six timeframes at a glance
Info
The MTF Trend Dashboard — trend, position and volatility on six timeframes at a glance is a Indicator for MetaTrader 5 that what you see each row is a timeframe and each column answers one question:column question coloursema slope is the ema rising or falling over the last k bars. green / redvs EMA Is the last close above or below the EMA.
Usage
This tool is typically used for trend following strategies across multiple currency pairs.
Platform
This Indicator works exclusively on MetaTrader 5 (both build 600+ and newer versions).
Setup
Place the downloaded file in MQL5/Indicators folder via File ? Open Data Folder in MetaTrader 5.
How to Install and Use MTF Trend Dashboard — trend, position and volatility on six timeframes at a glance
1. Installation: Place your file in the MQL/Indicators folder via "Open Data Folder" and restart your terminal.
2. Loading: Find the indicator in the Navigator, drag it onto your chart, and configure the input parameters in the popup window.
3. Customization: Press Ctrl+I to open the indicator list, select your tool, and click "Properties" to change colors, levels, or visual styles.
4. Updating: Replace the old file in the Indicators folder with the new version and restart the platform to apply changes.
Frequently Asked Questions
Q: Why is my indicator not showing? A: Verify the file is in the MQL/Indicators folder, or try right-clicking the "Indicators" tree in the Navigator and clicking "Refresh."
Q: Do custom indicators slow down the platform? A: Too many complex indicators can impact performance; remove unused ones via the "Indicator List" (Ctrl+I).
Q: Can I use MT4 indicators on MT5? A: No, MQL4 and MQL5 are distinct languages; ensure the indicator is compiled specifically for your platform version.
What this tool does
What you see Each row is a timeframe and each column answers one question:Column Question ColoursEMA slope Is the EMA rising or falling over the last k bars.
Typical Use Case
This Indicator excels in trend following on MetaTrader 5.
Compatible Platform & Setup
This Indicator works on MetaTrader 5. Place the file in the MQL5/Indicators folder and restart the terminal.
Description & Settings
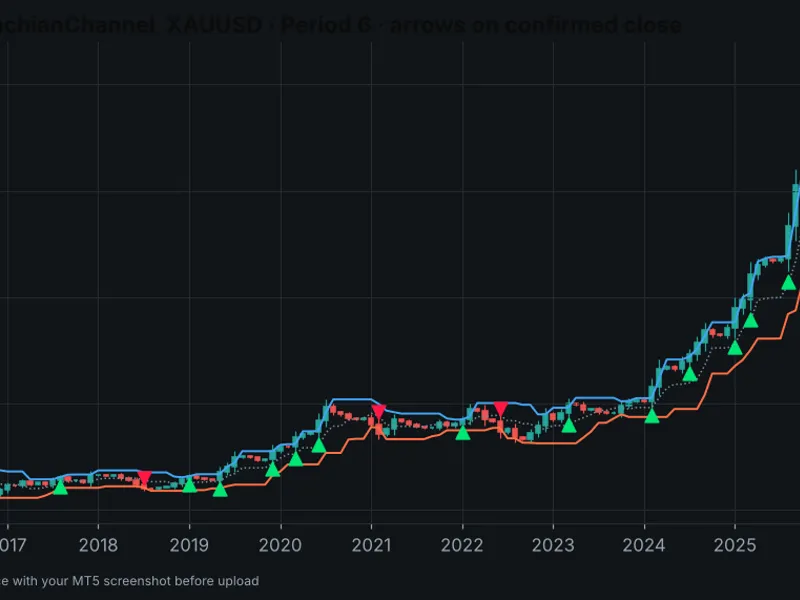
Related: Gold Donchian Breakout Channel (non-repainting, with HTF trend filter) - another powerful indicator for MetaTrader 5 traders.
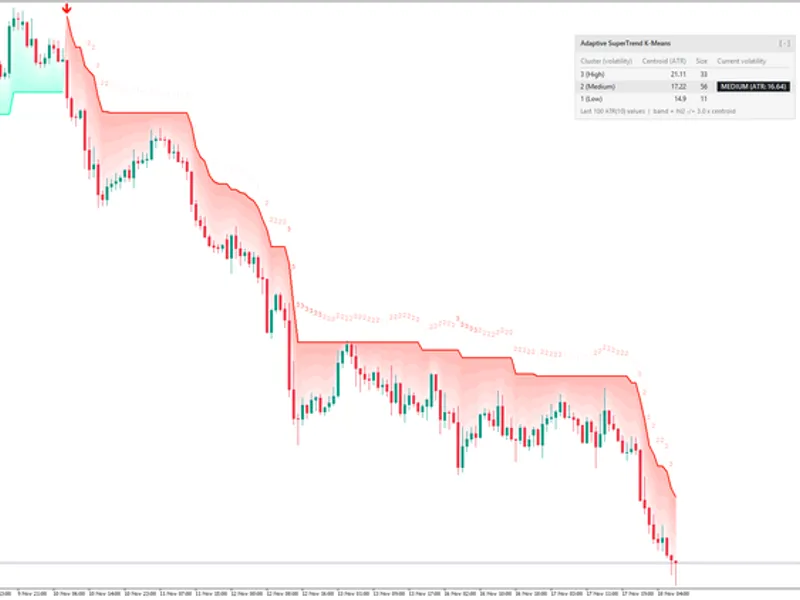
Also recommended: Adaptive Super Trend K-Means - similar indicator with strong performance on MetaTrader 5.
What you see
Each row is a timeframe and each column answers one question:
Column
Question
Colours
EMA slope
Is the EMA rising or falling over the last
k
bars?
green / red
vs EMA
Is the last close above or below the EMA?
green / red
Donchian
Where is the close inside the last N-bar range (0–100%)?
green > 80%, red < 20%
ATR pct
How high is volatility versus the last 250 bars?
blue < 20% (quiet), orange > 80% (hot)
REGIME
Do slope and side agree?
UP / DOWN / RANGE
When timeframes align
Trend-breakout systems earn most of their profit when the higher timeframes agree. A column of
UP
from H1 to MN1, with Donchian position near 100%, is the classic condition for long breakouts on gold. A mix of UP and DOWN tells you that the market is in a correction or a range, which is a reason to reduce risk or stand aside.
Inputs
Input
Default
Description
Trend EMA period
100
EMA on every timeframe
EMA slope look-back
3
Completed bars for the slope
Donchian length
50
Range for the position %
ATR percentile look-back
250
Bars for the volatility rank
X / Y offset, corner
12 / 24, right upper
Layout
Background
dark
Panel colour
Implementation notes
Uses one EMA and one ATR handle per timeframe and refreshes every 5 seconds.
Reads completed bars only (shift 1), so the table never changes on the forming bar.
// regime rule used by the dashboard int regime = (slope>0 && close>ema) ? 1 : ((slope<0 && close<ema) ? -1 : 0); // UP / DOWN / RANGE
You may also like: Multi-Timeframe EMA Trend Direction Panel - excellent alternative for indicator users on MetaTrader 5.
Source Code
#property copyright "RobotFX"
#property link "https://robotfx.org"
#property version     "1.00"
#property description "This code is educational. Feel free to use, modify and upgrade as you wish. Visit ROBOTFX.ORG for professional trading tools"
#property indicator_chart_window
#property indicator_plots 0
input int    InpEMA      = 100;
input int    InpSlope    = 3;
input int    InpDonchian = 50;
input int    InpATRRank  = 250;
.......
⚠ Limitations & Risk Warning
- This tool is provided for educational and testing purposes only.
- Past performance does not guarantee future results.
- Trading involves substantial risk of loss. Use on a demo account first.
- Results may vary depending on market conditions, broker, and settings.
- We recommend thorough backtesting and forward testing before using with real funds.