
Chart Pattern Breakout Indicator
Info
The Chart Pattern Breakout Indicator is a Indicator for MetaTrader 5 that spotting a triangle is the easy part. The question that pays is what price did when it left: did it break out, which way, did it reach the measured target or fall back inside.
Usage
This tool is typically used for breakout trading when price moves beyond key support/resistance levels.
Platform
This Indicator works exclusively on MetaTrader 5 (both build 600+ and newer versions).
Setup
Place the downloaded file in MQL5/Indicators folder via File ? Open Data Folder in MetaTrader 5.
How to Install and Use Chart Pattern Breakout Indicator
1. Installation: Place your file in the MQL/Indicators folder via "Open Data Folder" and restart your terminal.
2. Loading: Find the indicator in the Navigator, drag it onto your chart, and configure the input parameters in the popup window.
3. Customization: Press Ctrl+I to open the indicator list, select your tool, and click "Properties" to change colors, levels, or visual styles.
4. Updating: Replace the old file in the Indicators folder with the new version and restart the platform to apply changes.
Frequently Asked Questions
Q: Why is my indicator not showing? A: Verify the file is in the MQL/Indicators folder, or try right-clicking the "Indicators" tree in the Navigator and clicking "Refresh."
Q: Do custom indicators slow down the platform? A: Too many complex indicators can impact performance; remove unused ones via the "Indicator List" (Ctrl+I).
Q: Can I use MT4 indicators on MT5? A: No, MQL4 and MQL5 are distinct languages; ensure the indicator is compiled specifically for your platform version.
What this tool does
Spotting a triangle is the easy part.
Typical Use Case
This Indicator excels in automated trading and technical analysis on MetaTrader 5.
Compatible Platform & Setup
This Indicator works on MetaTrader 5. Place the file in the MQL5/Indicators folder and restart the terminal.
Description & Settings
Related: G7 Account Inspector Pro: On-Chart Trading Performance and Risk Auditor for MT5 - another powerful indicator for MetaTrader 5 traders.
Spotting a triangle is the easy part. The question that pays is what price did when it left: did it break out, which way, did it reach the measured target or fall back inside? This indicator finds 13 chart patterns on zigzag swings, from channels to wedges, broadening wedges and triangles, and keeps following each one after its last swing, so every pattern on the chart carries its own verdict and its own target.Also recommended: TradingView Style Chart Drag and Zoom for MT5 - similar indicator with strong performance on MetaTrader 5.
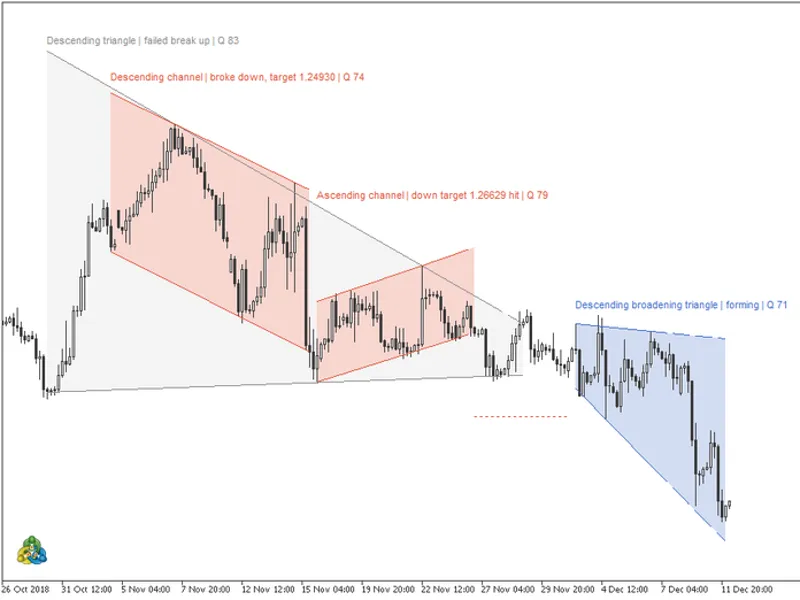
GBPUSD H4, default settings: a descending triangle whose break up failed, two channels inside it that broke down (one already at its target) and a broadening triangle still forming.
The color is the status
Each pattern is a shaded zone between its two lines, drawn behind the candles from the first swing to the breakout bar, or to the last bar while it is still forming. Blue means still forming, teal means it broke up, coral means it broke down, and gray means the break failed or never came. The lines are solid through the swings and dashed where they are projected past the last one. After a break, a dotted line marks the measured target until price reaches it or the wait runs out. One glance tells you which patterns are live, which ones delivered and which ones trapped the breakout traders.
Breakout, target, failure
A breakout needs a close beyond a line, on a bar after the last swing; a wick through the line is not enough. The target is the broken line plus or minus the height of the pattern, its widest distance between the lines. A high or low that touches the target marks it hit, even on the breakout bar itself. A close back past half the pattern height before the target turns the pattern into a failed break, so a simple retest of the broken line does not count against it. A pattern waits as many bars as it took to form, or until its lines meet; no close outside by then means no breakout. Only closed bars change a status, so the bar in progress never rewrites the past.
One label per pattern, off the candles
Each pattern gets a single line of text, for example Rising wedge | broke down, target 1.10550 | Q 79. Labels sit above the candles and zones under them, or below when there is no room at the top of the visible price range, and they never land on another label. They move again when you scroll or rescale the chart, and a pattern that starts left of the screen gets its label on the first visible bar.
Q, the quality score
Q runs from 0 to 100 and weighs three things: how tightly the swings sit on the lines (40 percent), how even the legs are in bars (30 percent) and how many closes stayed inside the lines while the pattern formed (30 percent). A clean wedge with balanced swings scores high; a loose shape stitched from one long leg and one short leg does not.
EURUSD H1: a range channel that hit its down target with two smaller triangles inside it, between a falling wedge and a descending channel that both broke up.
Patterns inside patterns
Small patterns often form inside a larger one, and the larger one is usually the move that matters. When a pattern spans at least twice the bars of a smaller one and holds both of its lines, both stay on the chart: the larger one is drawn behind with a lighter zone, and each keeps its own status, target and score. Patterns of the same size that share bars compete instead, and only the higher Q stays. Each drawing also ends two bars before the next unrelated pattern begins, so nothing piles up into a wall of lines.
XAUUSD H1: an ascending triangle whose break down failed, a descending triangle inside it that broke up, and an ascending channel that broke down.
How patterns are found
A zigzag marks a swing high when a bar makes the highest high of the last bars set by its length, and a swing low on the lowest low. From the swings that go beyond the previous one of the same kind, the indicator builds higher levels, so a single zigzag finds small patterns and large ones. Each pattern uses the last five or six swings: one line through the odd swings and one through the even ones. A line may not leave a whole candle body on the wrong side and may cut through fewer than one candle in five. The slope of each line, with a flat band of 20 percent, and whether the lines converge, diverge or run parallel decide which of the 13 names the pattern gets. Up to four zigzags can run together, and the last 5,000 bars are scanned.
Alerts and Expert Advisors
The optional alert fires on new patterns and on breakouts, only on bars that close while the indicator runs. Three buffers, readable with iCustom and CopyBuffer and shown in the Data Window, hold the top line (0), the bottom line (1) and the measured target (2) of the pattern drawn on each bar. Each copy names its objects with a code built from its settings, so two copies with different zigzags can share one chart.
Inputs
Zigzag:
- four zigzags, each with a length (8 for the first, 0 = off for the others) and the swings kept (55, 34, 21, 13).
Scanning:
- swings per pattern (five); flat line band (20); last swing direction (any); least time ratio of swings (0.382); skip patterns starting inside another (on).
Patterns:
- the 13 types one by one, each off, on, or on with its own last swing direction.
Display:
- patterns kept on the chart (20); labels (on); colors for broke up, broke down and still forming.
Alerts:
- new patterns and breakouts (off).
Works on any symbol and timeframe, and removing the indicator deletes everything it drew.
Educational content, not financial advice. Trading involves risk of loss. 2026
You may also like: Mouse Scroll Zoom for MT4/MT5 Charts - excellent alternative for indicator users on MetaTrader 5.
Source Code
#property copyright "RobotFX"
#property link "https://robotfx.org"
#property version   "1.05"
#property description "This code is educational. Feel free to use, modify and upgrade as you wish. Visit ROBOTFX.ORG for professional trading tools"
#property indicator_chart_window
#property indicator_buffers 3
#property indicator_plots   3
#property indicator_type1   DRAW_NONE
#property indicator_label1  "Pattern top"
#property indicator_type2   DRAW_NONE
.......
⚠ Limitations & Risk Warning
- This tool is provided for educational and testing purposes only.
- Past performance does not guarantee future results.
- Trading involves substantial risk of loss. Use on a demo account first.
- Results may vary depending on market conditions, broker, and settings.
- We recommend thorough backtesting and forward testing before using with real funds.