The Multi-timeframe Moving Average indicator.It has five input parameters:Period - calculation periodMethod - calculation methodApplied price- price used for calculationsTimeframe ...
Donchian Oscillator is an indicator of a ratio between the price and the Donchian channel. If the current Close price is above the Donchian channel, the indicator draws a histogram...
'Three ATR Bands with multiple selection' indicator is a set of three ATR Bands indicators each having adjustable parameters.It has nineteen input parameters:Show middle lines- sho...
Three Bigger Time Frame ATR is a multi-timeframe ATR indicator. It displays three ATRs of higher timeframes on the current chart.It has five input parameters:ATR period- ATR calcul...
Bigger Time Frame Bollinger Bands displays Bolinger Bands indicator data of a higher timeframe on the current one.The indicator has nine adjustable parameters:BB period- Bollinger ...
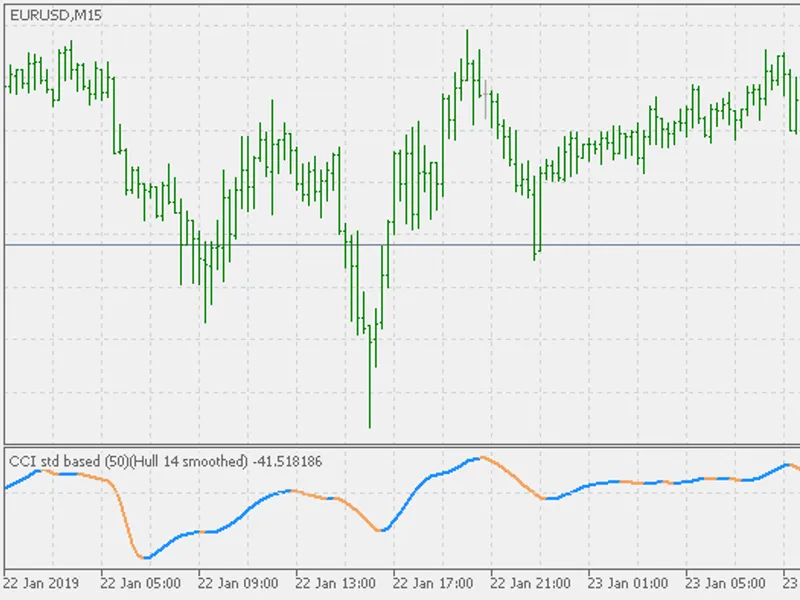
Theory : Short description by John Ehlers :The objective in cycle mode is to filter out the unwanted components – both low frequency trends and the high frequency noise – and retai...
Theory : John Ehlers uses bandpass filter (originally published here : ) to calculate what can be called a "market mode". The method used for that is to calculate an average of pea...
One more in the series of very simple (code wise - ie, execution speed is satisfactory, and to use) indicators :This one is showing the crosses of two averages as signals and the d...
Theory : John Ehlers describes what he calls the nonlinear Kalman filter in the following way :color change on slopecolor change on outer (floating) levels crosscolor change on mid...
Theory : Usage : You can use the color change as signal. There are two possible color change modes :color change on zero crosscolor change on slope change...
Theory : color change on slopecolor change on outer (floating) levels crosscolor change on middle (floating) level (sort of a "zero line") crossUsage : You can use the color change...
Theory : Short description of bandpass filter by John Ehlers :The objective in cycle mode is to filter out the unwanted components – both low frequency trends and the high frequenc...
Theory : color change on macd slope changecolor change on macd to signal crossslope change on macd crossing on outer (OB/OS) crossesslope change on middle (floating zero) crossUsag...
Theory : EMA (Exponential Moving Average) is very well known and widely used indicator. More information on it can be found here : . It is used as a building brick for TRIX (triple...
Theory : Welles Wilder was frequently using one "special" case of EMA (Exponential Moving Average) that is due to that fact (that he used it) sometimes called Wilder's EMA. The dif...
Many friends asked me for a simple, non-obtrusive, resource-friendly clock to track the time during their trades. It seems pretty obvious, but it is a must-have for those trading t...
Theory : it is smoothing a bit the RSI (not too much, but the smoothness difference is noticeable and significant in a lot of cases)it is preventing too much flattening of the RSI ...
Another request from my brotherhood was putting the name of the Symbol being seen - a little bigger - on the Chart, just to get sure that they are seeing the correct one... Mistake...
The concept is simple: Plotting Price behavior within several periods of time.Some Symbols behave very well during the trading day - with this I mean Intraday trading - and this be...
Theory : TRIX (triple exponential average (TRIX) indicator is an oscillator used to identify oversold and overbought markets, and it can also be used as a momentum indicator. It is...
This is a variation of trix that is using Wilder's double smoothed EMA and which has floating levels instead of fixed levels for signals. You can chose :color change on outer level...
Theory : Also it is adding floating levels to the indicator. That way you have 4 choices for color changes :change color when outer floating levels are crossedchange color when mid...
Theory : The idea for this indicator is as simple as it gets : a lot of times we are using some indicator levels as a signal that some desired level is reached and that the price c...
Theory : This is RSI with on-chart support / resistance levels displayed. The way how it is done is explained in more detail here :Usage : You can use it as any regular RSI and you...
The stochastic that has an addition of on-chart support / resistance levels. You have two choices for color (and implicitly for SR levels) display :on signal line crosson levels cr...
The Trix oscillator that has an addition of on-chart support / resistance levels. You have two choices for color (and implicitly for SR levels) display :on zero line crosson slope ...
Theory : Williams %R, or just %R, is a technical analysis oscillator showing the current closing price in relation to the high and low of the past N days (for a given N). It was de...
Theory : The way how this WPR is smoothed is described here :color change on outer levels crosscolor change on middle (sort of zero line) crosscolor change on slope changeUsage : Y...
Theory : The way how this WPR is smoothed is described here :color change on outer levels crosscolor change on middle (sort of zero line) crosscolor change on slope change Usage : ...
Theory : This is the MACD indicator with an addition of on chart support resistance levels. Three choices of color (and SR levels) change are available :color change on zero crossc...
Theory : John Ehlers made one more indicator that was targeting the measuring of cycles / periods of the market. He called it "Dual differentiator". Without too much explanation, h...
Theory : This is an EMA (Exponential Moving Average) that is using Dual Differentiator (published here : ) for adapting.Usage : It can be used as normal EMA, with a twist : the dua...
Visually, each bar is described by two states of the histogram column: 1. According to the index sign of the candle - exterior color (red / green) 2. By relative with the value on ...
Theory : Usage : It can be used as "regular" macd too - zero crosses or slope direction can be used for signalsPS: for those checking the code - there is a "strange" thing in the c...
It has been added floating levels and , accordingly 4 types of color changes :color change on outer levels crosscolor change on middle level crosscolor change on slope changecolor ...
Theory : This indicator is using the asymmetric way of calculating the bands instead of using same distance for up and down bands, and then it is converted to an oscillator. One of...
Theory : Usage : Crosses of the average and the price line can be used as signals but get used to ow it works before attempting to use it or signals estimation...
Theory : Simple indicator that is using a nice smoothing algorithm to display a rainbow. Set the step, price and display options, and that is allUsage : You can use it for overall ...
Theory : The Donchian channel is an indicator used in market trading developed by Richard Donchian. It is formed by taking the highest high and the lowest low of the last n periods...
Theory : As a deviation from the original, you can chose one of the 4 types of average to sue instead of using just EMA. Averages that can be used are :simple moving averageexponen...
Theory : The "smoother" is sometimes called Jurik average even though there is no evidence of being that. Hence the name of this one is simply smoother. The indicator is using the ...