Theory : In 1969, based on Haurlan’s use of advance and decline data, Sherman and Marian McClellan developed the McClellan Oscillator. This oscillator is the difference between two...
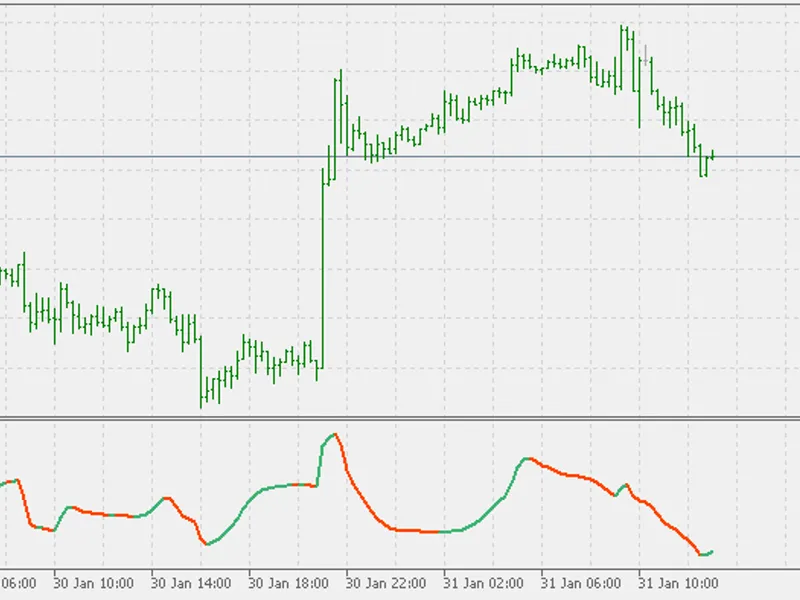
Found this idea on anther forum and it seems to be usable. Hence here it is for metatrader 5 too. The super trend used is the one published here : You can find the exact descriptio...
Theory : In the TASC January 2000 article by Joe Sharp, "More Responsive Moving Averages." the article describes a modified moving average that greatly diminishes the lag that is t...
Theory : Original definition of the Tushar Chande's and Stanley Kroll's DMI is the following :The dynamic momentum index is used in technical analysis to determine if a security is...
Theory : Original definition of the Tushar Chande's and Stanley Kroll's DMI is the following :The dynamic momentum index is used in technical analysis to determine if a security is...
Theory : There is always a need to measure if the market is "quiet" or it is volatile. One of the possible way is to use standard deviations, but the issue is simple : we do not ha...
Theory : There is always a need to measure if the market is "quiet" or it is volatile. One of the possible way is to use standard deviations, but the issue is simple : we do not ha...
Theory : Usage : It can be used the same way as the original. Multi time frames are having, apart from all the standard multi time frames that can be used in metatrader 5, 3 additi...
Theory : McGinley dynamic SMAMcGinley dynamic EMAMcGinley dynamic SMMAMcGinley dynamic LWMAUsage : It can be used as any other average. The difference between the types can be sign...
Theory : Found this on another forum. It is calculated as :Volume Pressure = Volume / Price Change Usage : Like all other volume based indicators. You can chose if you wish to use ...
The BBMA strategy was developed by Malaysian trader Ali Oma (Oma Ally). It is a method that combines Bollinger Bands (BB) and Moving Averages (MA) to identify market movements.CSA ...
Theory : Found this idea on the net. It was originally made for other trading platform by "capissiomo". The indicator is displaying Williams Percent Range (WPR) and is using same p...
Theory : possible channels background color is added. to avoid drawing channel back color, simply set the color to none (see second example)multi time frame support added. apart fr...
Theory : possible channels background color is added. to avoid drawing channel back color, simply set the color to none (see second example)multi time frame support added. apart fr...
Theory: Usage : Any way how divergence is used in trading - the channel will change the color of the middle line in any moment when the slopes of the on-chart channel and on-indica...
Theory : first higher time frame (first time frame higher than the current chart time frame)second higher time frame (second time frame higher than the current chart time frame)thi...
Theory : first higher time frame (first time frame higher than the current chart time frame)second higher time frame (second time frame higher than the current chart time frame)thi...
Indicator MultiStalin_x10 displays information on the current trends, using the values of indicator from ten different timeframesEach indicator is assigned with one of the ten indi...
Eva RuftIndicator without rounding, multiplied by the averaged volumes.The indicator uses SmoothAlgorithms.mqh library classes (copy it to <terminal_data_folder>\MQL5\Include...
Indicator with the timeframe selection option in its input parameters:For the indicator to operate, the Float_Pivot_Digit.ex5indicator should be added to the <terminal_data_dire...
Displaying the latest closed values of indicator Float_Pivot_Digit with colored rectangles and background filling.For the indicator to operate, the Float_Pivot_Digit.ex5indicator s...
Indicator with the timeframe selection option in its input parametersFor the indicator to operate, indicator Float_Pivot_Smoothed_Digit.ex5should be added to the <terminal_data_...
Indicator Stalin_HTF_Signal shows a trend direction or a signal generated by the indicator at the chosen bar as a graphical object with colored trend indication or deal direction. ...
When standard iStochastic is called from the EA, then two levels, 80.0 and 20.0 will ALWAYS be displayed for this indicator in the Visual Tester. It's no good, if the EA uses other...
Indicator Stalin_Signal displays information on the current trend, using the values of indicator with a fixed timeframeNRTR line color is used as the signal source. Colored dots on...
Vladislav GoshkovIndicator of Murrey levels in indicator buffers with the added visual text information on those levels.The indicator uses the class of library (should be copied to...
Indicator of Murrey levels in indicator buffers with the added visual text information on those levels, calculating the levels on a timeframe specified in the inputs.The indicator ...
Indicator with the timeframe selection option in its input parameters:For the indicator to operate, indicator Heiken_Ashi_Smoothed_Volatility_Volume.ex5should be added to the <t...
Indicator with the timeframe selection option in its input parametersFor the indicator to operate, indicator Float_Pivot_Smoothed_Digit_System.ex5should be added to the <termina...
Indicator USDX vs Slope Direction Line is an information and signal indicator. It compares the line directions of two indicators, and , and shows in a separate window the colored s...
Indicator Multi timeframe Dynamic Trend is the multi-timframe indicator. It displays the data of three indicators Dynamic Trend from different timeframes on the current chart.It ha...
Indicator 3 in 1 MTF Stochastic with MA Smoothing options represents three stochastics in one with smoothing options and signal pointers.It has 24 adjustable parameters:First Stoch...
Indicator Linear Regression Moving Average represents the linear-regression moving average.It has one input parameter:Period - calculation periodCalculations:LRMA = 3.0 * LWMA - 2....
Indicator Multi Timeframe Linear Regression Moving Average with signal line represents a multi-timeframe (LRMA) having a signal line.It has four configurable parameters:LRMA period...
Indicator Stochastic RSI is a stochastic calculated on the data of Relative Strength Index (RSI)It has six adjustable parameters:Stochastic %K period- stochastic %K line calculatio...