theory: strictly speaking macd is a (as defined by gerald appel, who invented it) difference of fast and slow ema and then a signal line (which is also ema) is calculated for such ...
theory: range weighted exponential moving average (ema) is, unlike the "regular" range weighted average (originally published here : ) calculated in a different way. even though th...
theory: this indicator is a variation of the range weighted ema (originally published here: with some more explanation what exactly is it doing and how. the variation comes from a ...
theory: is calculated the original way, it is producing exactly the same results as the original and has some options added:you can chose the price (original uses close only)you ca...
theory: in technical analysis, the stochastic oscillatoris a momentum indicator that uses support and resistance levels. developed this indicator in the late 1950s. the term stocha...
theory: stochastic oscillator is usually used on prices. but sometimes that produces much noise. some filtering methods can be used (like this: ).simple moving average(sma)exponent...
basics: metatrader built-in stochastic allows us to chose only two "prices":close/closelow/highobviously we are missing the rest of the usual price types in those choices.usage: th...
theory: robert miner developed something that he named "dynamic trader oscillator" (usually shortened as dtosc). the indicator is actually a stochastic of rsi, but for the sake of ...
theory: it is adding the choice of prices and the usual "low/high" combination too (which is the default setting).usage: the indicator adds signal (or trigger) line in order to mak...
theory: instead of using "raw" price, it is using the ratio of fast ema / slow ema of the price. the difference may seem small, but the results are quite different in some cases th...
theory: where:c = current closela = lowest low in a daysha = highest high in a daysey = y-day exponential moving averageez = z-day exponential moving average it is calculating as d...
theory: trend trigger factor was described by m.h. pee in the technical analysis of stocks and commodities magazine in december, 2004. usually the indicator is added some sort of s...
theory: as john ehlers describes it:the cg is computed in much the same way as the ehlers filter. the position of the balance point is the summation of the product of position with...
theory: color change on signal / trigger line cross (the default)color change on level zero cross color change on slope change usage: depending on the way you desire to use it (by...
two indicators from different timeframes in a single window as a cloud colored according to a trend direction.fig. 1. spearmanrankcorrelation_2htf indicator...
indicator with the timeframe selection option available in input parameters:to provide correct operation of the indicator, place the compiled hlcrosssigformfi.ex5indicator file in ...
bigeev rustemhlcrosssigformfi is considered as a trend indicator since it is intended for "catching" trends. however, it's a pretty complex and informative indicator that allows ex...
trend score indicator by tushar s. chande was described in the article "rating trend strength" in s&c magazine (september 1993).it displays both the power and direction of a tr...
tmacd divergence searches for oscillator divergences and displays them.the indicator has three input parameters:fast ma period slow ma periodapplied pricetmacd indicator signal lin...
slow volume strength index oscillator defines the volume momentum. the indicator was first described in "stock&commodities" (april 2015).there are five inputs:ema period- ema c...
key reversal pattern is similar to engulfing price action pattern and consists of three bars. two of them are trend-following and the third (key) one should absorb the previous (se...
smoothed standard deviation. smoothing period is equal to 3 (smoothing is calculated using movingaverages.mqh). the image below shows conventional and smoothed standard deviations:...
extent oscillator displays the difference between the moving average and the price as a colored histogram.it has four inputs:ma period- moving average calculation periodma type- mo...
'specified time range candles' indicator displays colored candles at a specified time interval (trading session) on the price chart. candles not falling within the specified range ...
cci bar signal indicator. the indicator displays the colored diagram of cci indicator status relative to its oversold/overbought levels (above/below/upward crossing/downward crossi...
indicator with the timeframe selection option available in input parameters:for the indicator to operate, the spearmanrankcorrelation_histogram.ex5indicator should be added to the ...
input parameters for activating signals: the indicator uses the onesidegaussian.mqhgaussian algorithms library (should be copied to the terminal_data_folder\mql5\include).fig. 1. s...
indicator with the timeframe selection option available in input parameters:for the indicator to operate, the sr-rateindicator.ex5indicator should be added to the <terminal_data...
the indicator plots one vertical line per month in a specified moment of time. lines are drawn using indicator buffers and graphical construction type. it is recommended to place t...
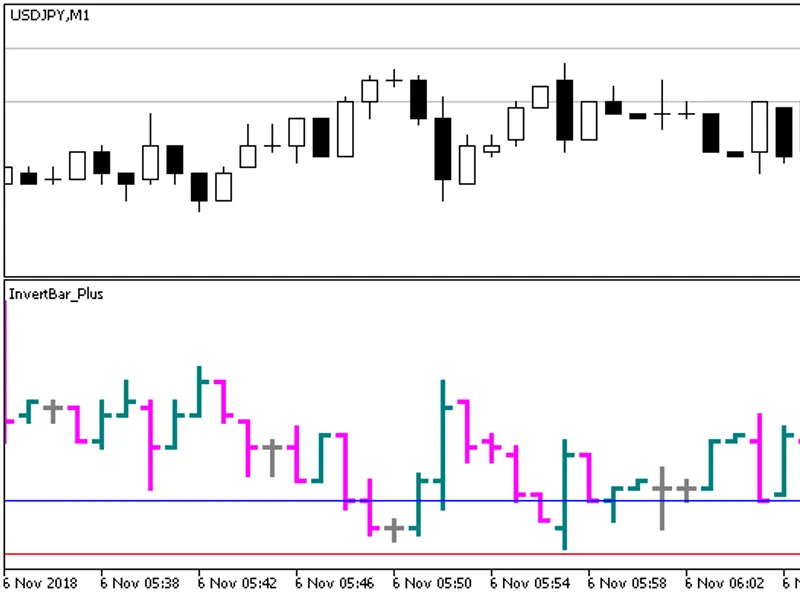
the inverted chart of the current financial instrument, displaying ask and bid price levels in the form of colored bars in the additional window.fig. 1. bar_plus indicator...
indicator featuring background filling in overbought/oversold areas. filling size and position are adjustable by inputswhen launching the indicator, you can change the style and co...
indicator featuring background filling in overbought/oversold areas. filling size and position are adjustable by inputswhen launching the indicator, you can change the style and co...
indicator is able to color each line depending on its position relative to overbought and oversold areas. when launching the indicator, you can change the style and color of only t...
the indicator plots one vertical line per day in a specified moment of time once per week. lines are drawn using indicator buffers and graphical construction type. it is recommende...
wick length indicator displays the candle wick length in points in a separate chart window.it has one configurable parameter:method - display methodseparated - separateseparated op...
vortex trend signal indicator. the indicator is based on indicator. it displays the colored diagram of the trend direction in a separate chart window.there are five inputs:vortex p...
'since last fractal' displays the number of bars passed since the last fractal formation in a separate chart window. two lines: one displays the number of bars after the upper frac...
market meanness index indicator is a business activity index. it displays the market state - trend or random (chaotic).the indicator has three input parameters:period - calculation...
whistler's active volatility energy - price mass indicator. the indicator was described in the book "volatility illuminated" by mark whistler.the indicator has twelve input paramet...
consensus of five signal indicator. the indicator is based on the readings of five indicators: adx, dmi, cci, macd and stochastic.dmi, cci, macd and stochastic indicator directions...
the indicator plots one vertical line per day in a specified moment of time. lines are drawn using indicator buffers and graphical construction type. it is recommended to place the...
the following characteristics were made input parameters:color of the indicator main linewidth of the indicator main linevalues of the two indicator levels why was this done when t...
the with the timeframe selection option available in its input parameters:for the indicator to operate, the volatility2step_alerts.ex5indicator should be added to the <terminal_...