Specified Time Range Candles
This software component for MetaTrader 5 is built to enhance the capabilities of your trading environment. This technical indicator acts as a specialized analysis tool designed to visualize market data. It helps traders identify emerging trends, momentum shifts, and key support or resistance levels by plotting statistical calculations directly onto price charts.
How to Setup and Use Specified Time Range Candles
1. Installation: Place your file in the MQL/Indicators folder via "Open Data Folder" and restart your terminal.
2. Loading: Find the indicator in the Navigator, drag it onto your chart, and configure the input parameters in the popup window.
3. Customization: Press Ctrl+I to open the indicator list, select your tool, and click "Properties" to change colors, levels, or visual styles.
4. Updating: Replace the old file in the Indicators folder with the new version and restart the platform to apply changes.
Frequently Asked Questions
Q: Why is my indicator not showing? A: Verify the file is in the MQL/Indicators folder, or try right-clicking the "Indicators" tree in the Navigator and clicking "Refresh."
Q: Do custom indicators slow down the platform? A: Too many complex indicators can impact performance; remove unused ones via the "Indicator List" (Ctrl+I).
Q: Can I use MT4 indicators on MT5? A: No, MQL4 and MQL5 are distinct languages; ensure the indicator is compiled specifically for your platform version.
Description & Settings
'Specified time range candles' indicator displays colored candles at a specified time interval (trading session) on the price chart. Candles not falling within the specified range are displayed by the specified chart display type.
The indicator has three input parameters:
Start hour of the trading session
Session length
- displayed trading session duration in hours
Chart mode
- mode of displaying the chart not falling within a specified period
Bar chart
Candlesticks
Line chart
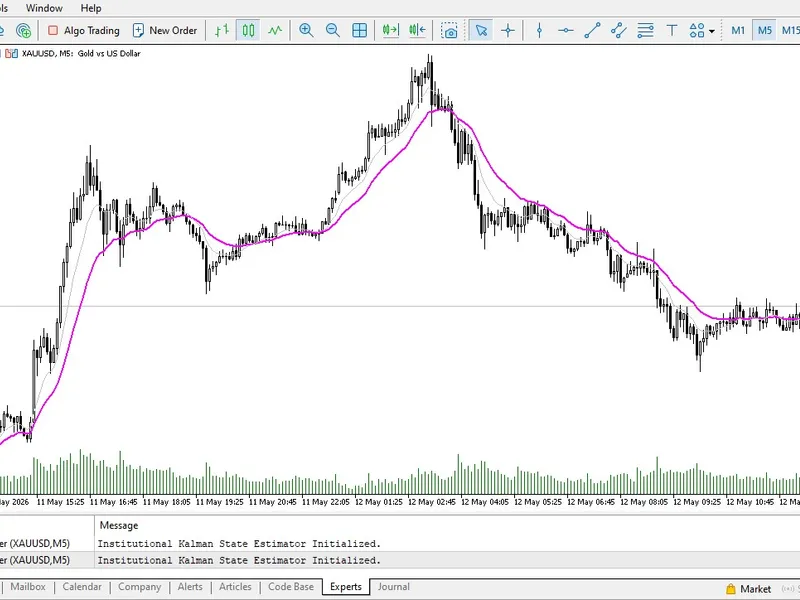
Fig. 1. Start hour of the trading session = 8, Session length = 5
Fig. 2. Start hour of the trading session = 0, Session length = 12