Investors Vs Speculators
This professional-grade solution for MetaTrader 5 helps traders achieve greater efficiency in their daily workflow. This technical indicator acts as a specialized analysis tool designed to visualize market data. It helps traders identify emerging trends, momentum shifts, and key support or resistance levels by plotting statistical calculations directly onto price charts.
How to Setup and Use Investors Vs Speculators
1. Installation: Place your file in the MQL/Indicators folder via "Open Data Folder" and restart your terminal.
2. Loading: Find the indicator in the Navigator, drag it onto your chart, and configure the input parameters in the popup window.
3. Customization: Press Ctrl+I to open the indicator list, select your tool, and click "Properties" to change colors, levels, or visual styles.
4. Updating: Replace the old file in the Indicators folder with the new version and restart the platform to apply changes.
Frequently Asked Questions
Q: Why is my indicator not showing? A: Verify the file is in the MQL/Indicators folder, or try right-clicking the "Indicators" tree in the Navigator and clicking "Refresh."
Q: Do custom indicators slow down the platform? A: Too many complex indicators can impact performance; remove unused ones via the "Indicator List" (Ctrl+I).
Q: Can I use MT4 indicators on MT5? A: No, MQL4 and MQL5 are distinct languages; ensure the indicator is compiled specifically for your platform version.
Description & Settings
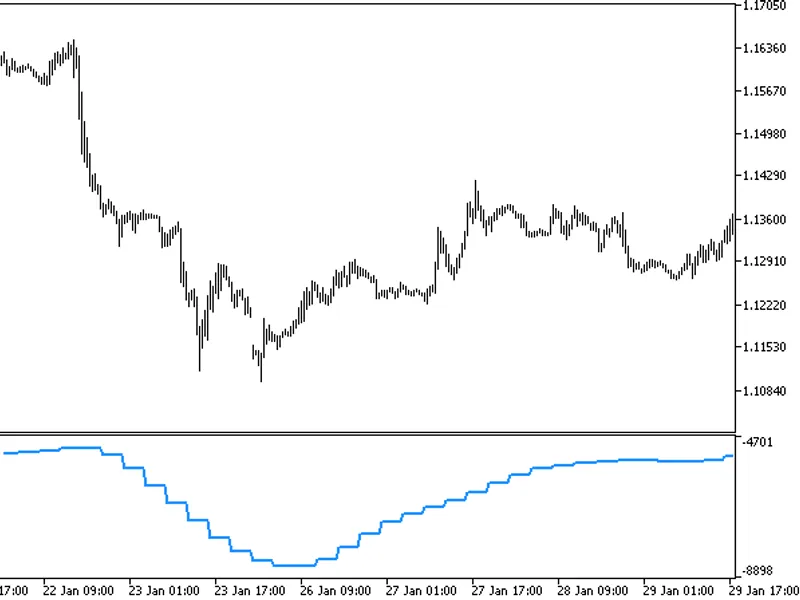
Investors vs Speculators displays the ratio of major players' actions (Investors) to the actions of market traders (Speculators).
It has two configurable parameters:
Period
- calculation period
AD method
- accumulation/distribution calculation method
Classical MT
- standard as in MetaTrader
Trade Station
- as in Trade Station
Calculation:
Delta = Investors - Speculators
where:
If VOL > AVGSpeculators = PrevSpeculatorsInvestors = PrevInvestors + AD
otherwiseInvestors = PrevInvestorsSpeculators = PrevSpeculators + AD
If AD method = Classical MTAD = ((Close - Low) - (High - Close)) / (High - Low) * VOL
If AD method = Trade StationAD = (Close - Open) / (High - Low) * VOL
AVG - SMA(VOL, Period)
VOL - tick volume