AD X Trend
This professional-grade solution for MetaTrader 5 helps traders achieve greater efficiency in their daily workflow. This technical indicator acts as a specialized analysis tool designed to visualize market data. It helps traders identify emerging trends, momentum shifts, and key support or resistance levels by plotting statistical calculations directly onto price charts.
How to Setup and Use AD X Trend
1. Installation: Place your file in the MQL/Indicators folder via "Open Data Folder" and restart your terminal.
2. Loading: Find the indicator in the Navigator, drag it onto your chart, and configure the input parameters in the popup window.
3. Customization: Press Ctrl+I to open the indicator list, select your tool, and click "Properties" to change colors, levels, or visual styles.
4. Updating: Replace the old file in the Indicators folder with the new version and restart the platform to apply changes.
Frequently Asked Questions
Q: Why is my indicator not showing? A: Verify the file is in the MQL/Indicators folder, or try right-clicking the "Indicators" tree in the Navigator and clicking "Refresh."
Q: Do custom indicators slow down the platform? A: Too many complex indicators can impact performance; remove unused ones via the "Indicator List" (Ctrl+I).
Q: Can I use MT4 indicators on MT5? A: No, MQL4 and MQL5 are distinct languages; ensure the indicator is compiled specifically for your platform version.
Description & Settings
ADX Trend signal indicator analyzes the values of three ADX indicators and sets signal pointers.
There are seven configurable parameters:
First ADX period
- first ADX calculation period
Second ADX period
- second ADX calculation period
Third ADX period
- third ADX calculation period
Lelel 1
- first ADX threshold level
Level 2
- second ADX threshold level
Applied price
Signal point anchor
- signal pointers' anchor point
High/Low
- by High/Low signal levels
Open
- by Open prices of signal colors
Signal pointers are set if:
ADX1_1 < ADX1_0 и ADX2_1 < ADX2_0 и ADX3_1 < ADX3_0 и ADX1_0 > Lelel 1 и ADX2_0 > Level 2
If DMI > 0, bearish (red) signal pointer is set
If DMI < 0, bullish (green) signal pointer is set
where:
ADX1_1, ADX1_0 - ADX(First ADX period, MAIN_LINE) on bar 1 and 0ADX2_1, ADX2_0 - ADX(Second ADX period, MAIN_LINE) on bar 1 and 0ADX3_1, ADX3_0 - ADX(Third ADX period, MAIN_LINE) on bar 1 and 0
DMI = PDI - MDIPDI = ADX(First ADX period, PLUSDI_LINE)MDI = ADX(First ADX period, MINUSDI_LINE)
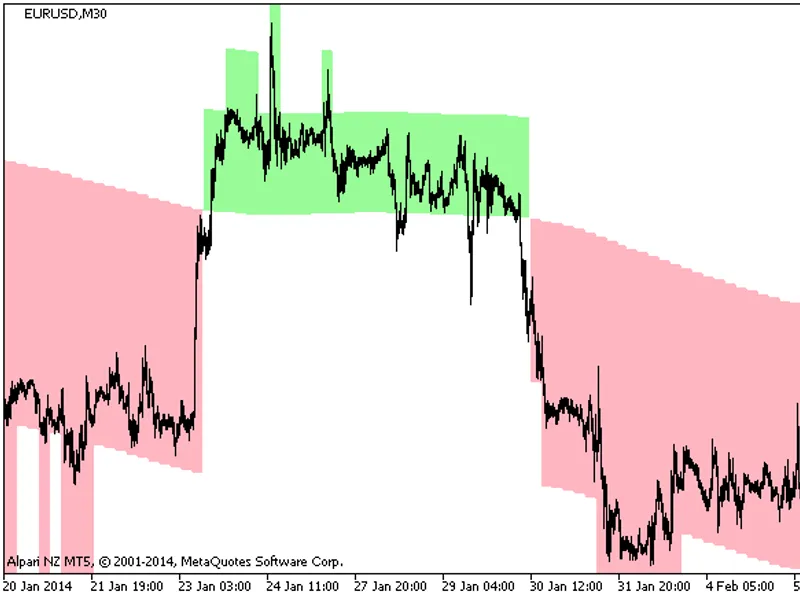
Fig. 1. ADX Trend, pointers to High/Low
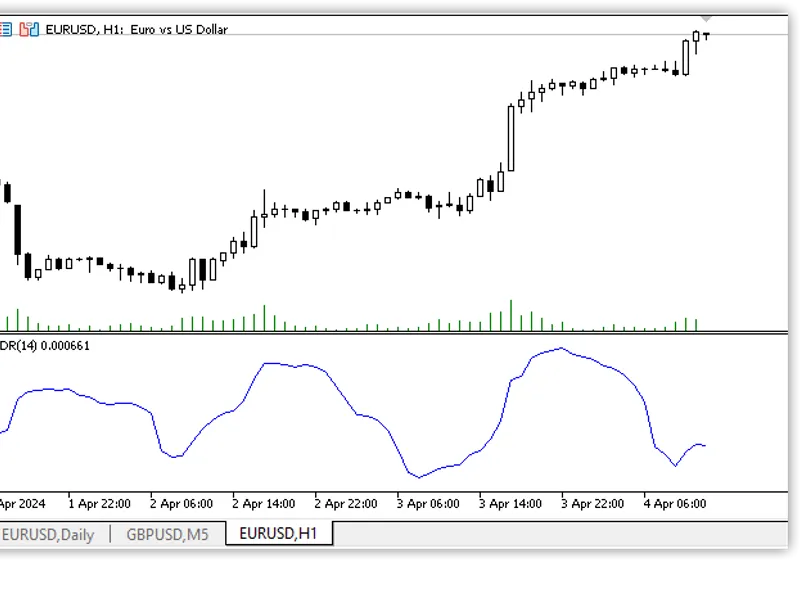
Fig. 2. ADX Trend, pointers to Open