Trend intensity index
This tool for MetaTrader 5 is specifically engineered to streamline your trading operations. This technical indicator acts as a specialized analysis tool designed to visualize market data. It helps traders identify emerging trends, momentum shifts, and key support or resistance levels by plotting statistical calculations directly onto price charts.
How to Setup and Use Trend intensity index
1. Installation: Place your file in the MQL/Indicators folder via "Open Data Folder" and restart your terminal.
2. Loading: Find the indicator in the Navigator, drag it onto your chart, and configure the input parameters in the popup window.
3. Customization: Press Ctrl+I to open the indicator list, select your tool, and click "Properties" to change colors, levels, or visual styles.
4. Updating: Replace the old file in the Indicators folder with the new version and restart the platform to apply changes.
Frequently Asked Questions
Q: Why is my indicator not showing? A: Verify the file is in the MQL/Indicators folder, or try right-clicking the "Indicators" tree in the Navigator and clicking "Refresh."
Q: Do custom indicators slow down the platform? A: Too many complex indicators can impact performance; remove unused ones via the "Indicator List" (Ctrl+I).
Q: Can I use MT4 indicators on MT5? A: No, MQL4 and MQL5 are distinct languages; ensure the indicator is compiled specifically for your platform version.
Description & Settings
Theory :
It was created by M.H.Pee. The definition (in short) is the following :
To calculate a 30-day trend intensity index (TII), follow these steps:
Obtain the 60-day simple moving average by adding the closes for the past 60 days and dividing the result by 60.
Find the deviation of each of the recent 30 closes from the 60-day moving average. The deviation is up if the close is above the moving average, and down when the close is below the average. Up deviation values are obtained by subtracting the moving average from the close, while down deviations are calculated by subtracting the close from the moving average. The TII allows you to find out what percentage of these deviations is up or down. For a 30-day TII , you should have 30 deviations from the 60-day moving average.
Usage :
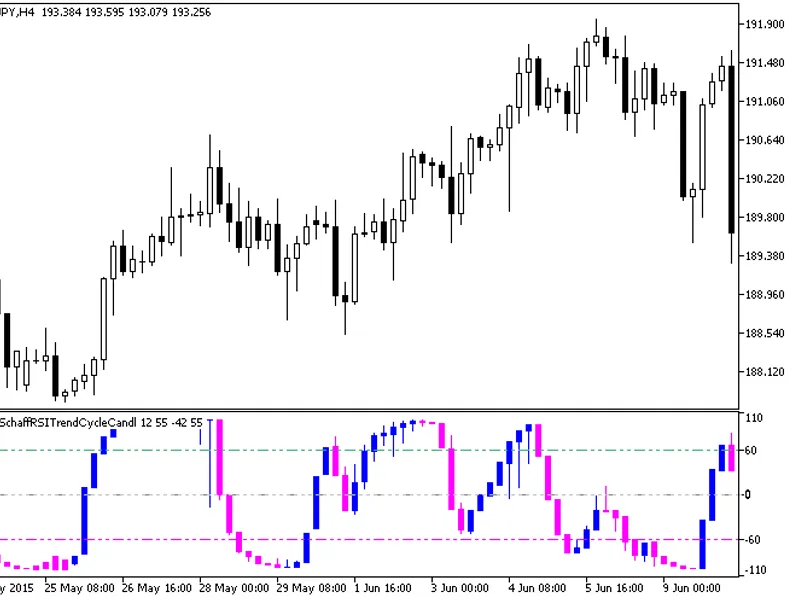
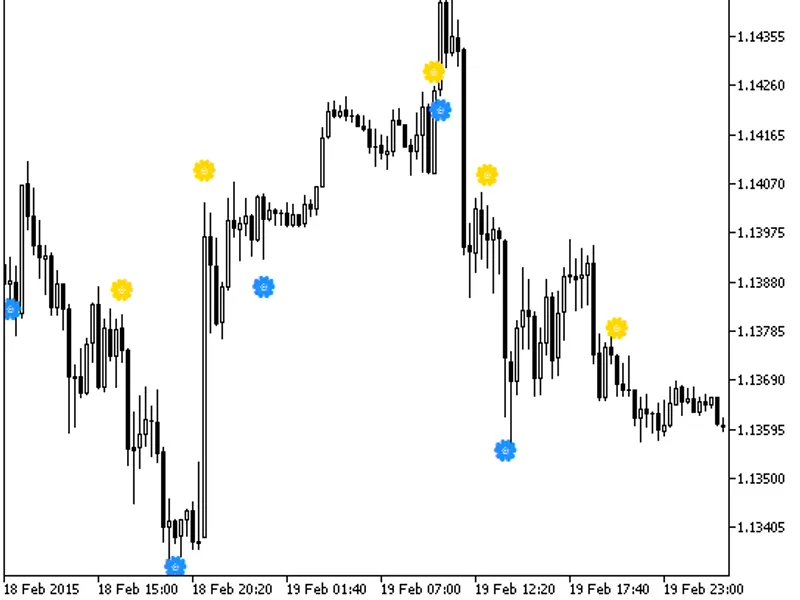
You can use color changes as signals