Better Volume
This is a powerful addition to your MetaTrader 5 toolkit designed to optimize market analysis and performance. This technical indicator acts as a specialized analysis tool designed to visualize market data. It helps traders identify emerging trends, momentum shifts, and key support or resistance levels by plotting statistical calculations directly onto price charts.
How to Setup and Use Better Volume
1. Installation: Place your file in the MQL/Indicators folder via "Open Data Folder" and restart your terminal.
2. Loading: Find the indicator in the Navigator, drag it onto your chart, and configure the input parameters in the popup window.
3. Customization: Press Ctrl+I to open the indicator list, select your tool, and click "Properties" to change colors, levels, or visual styles.
4. Updating: Replace the old file in the Indicators folder with the new version and restart the platform to apply changes.
Frequently Asked Questions
Q: Why is my indicator not showing? A: Verify the file is in the MQL/Indicators folder, or try right-clicking the "Indicators" tree in the Navigator and clicking "Refresh."
Q: Do custom indicators slow down the platform? A: Too many complex indicators can impact performance; remove unused ones via the "Indicator List" (Ctrl+I).
Q: Can I use MT4 indicators on MT5? A: No, MQL4 and MQL5 are distinct languages; ensure the indicator is compiled specifically for your platform version.
Description & Settings
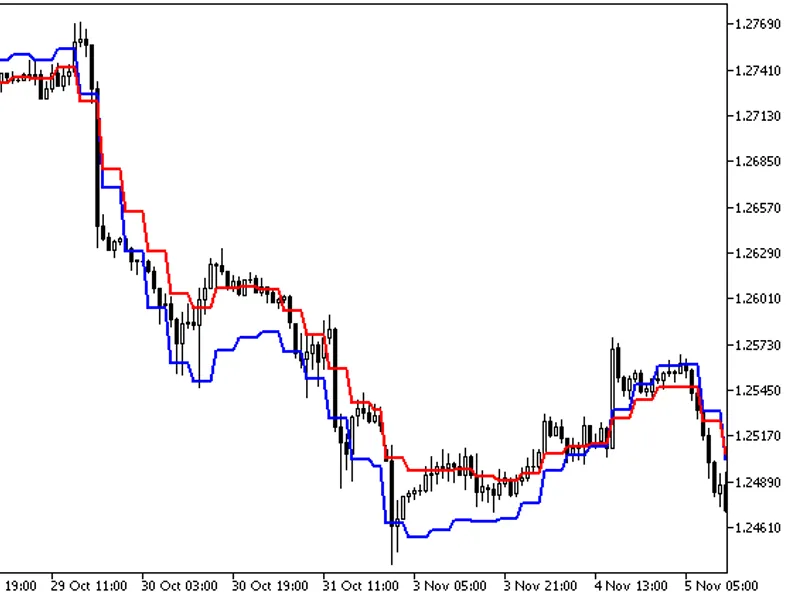
Every person who studied Technical Analysis knows that one of the drivers of Price Change is Volume. Several training courses show the monitoring of Volume changes using a Moving Average within the Volume indicator in order to let the trader identify changes in its behavior. Since the trader have to visually follow every aspect of his/her trade, it is very easy for him/her to miss a breakout of the Volume Average at that moment.
The proposal of this indicator is to present the volume data BELOW the average set by the trader in very pale colors. When a breakout of this average is happening, the bar in the histogram becomes All Color, presenting a GREEN color for an UPTREND, and a RED color for a DOWNTREND...
Please note that this behavior is NOT necessarily always true, because we can have situations - e.g.: following the information in Tape reading - where the volume is theoretically in an Uptrend but is being absorbed by the SELL side, ending in a Downtrend...
That said, and along with your Trading System, I hope that this indicator be helpful for those trading manually...
Live Long and Prosper...