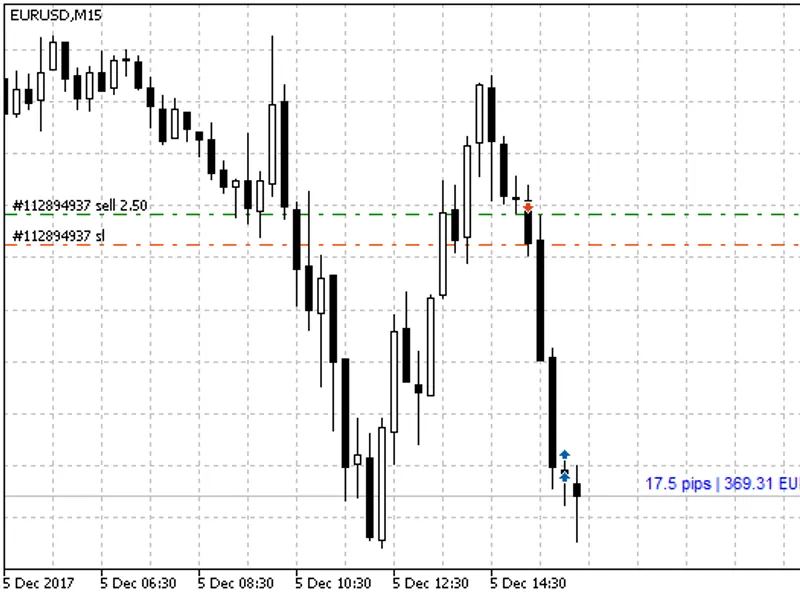
This indicator provides real-time account status updates.It displays the following information:- Profit in points, percentage, and currency- Spread of the current pair- Time until ...
The EA utilizes three indicators: Moving Average (MA), Stochastic Oscillator, and Relative Strength Index (RSI). It opens positions in the market and places buy stop and sell stop ...
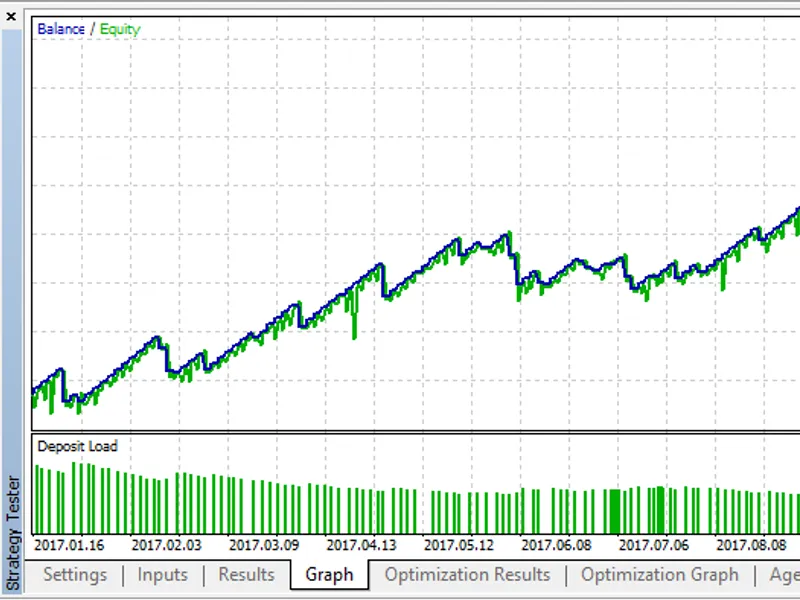
x1 lot from low to high.mq5- The EA opens a position with a minimum lot, then increases the lot size for subsequent positions.Input Parameters:- Max Lots (x lots maximum) - Ratio ...
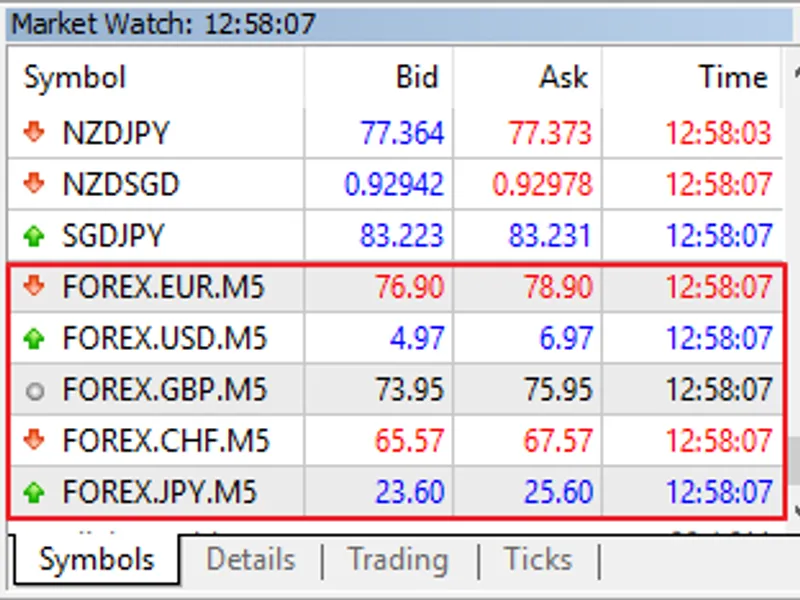
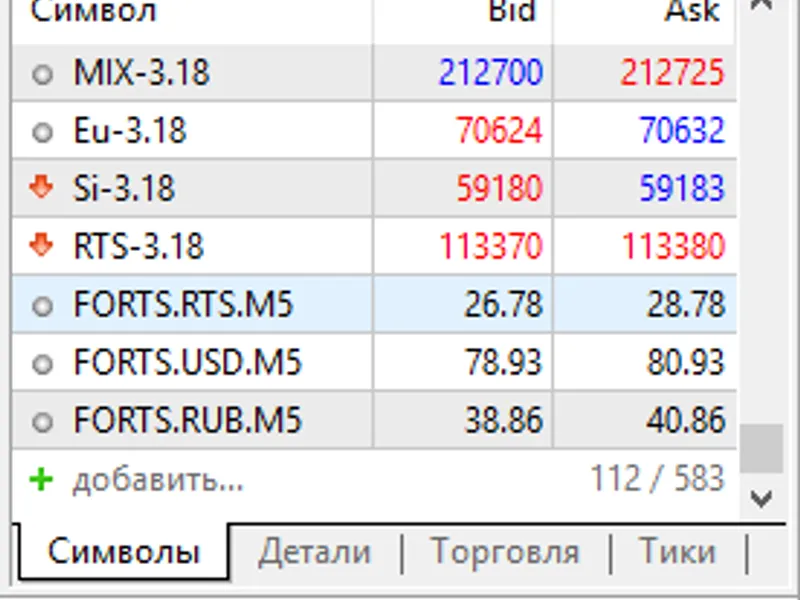
Metatrader 5 introduces the capability to create synthetic instruments, whose prices can be derived from the current values of multiple financial instruments.In the stock market, a...
Description:This indicator calculates and displays the strengths of RTS, USD, and RUB in the Forts futures market. It uses the values of specific futures contracts to create a curr...
The Expert Advisor utilizes the signals from the crossover of two IMAs (Moving Averages, MA). It incorporates trailing stop and take profit functionality, closing sell positions wh...
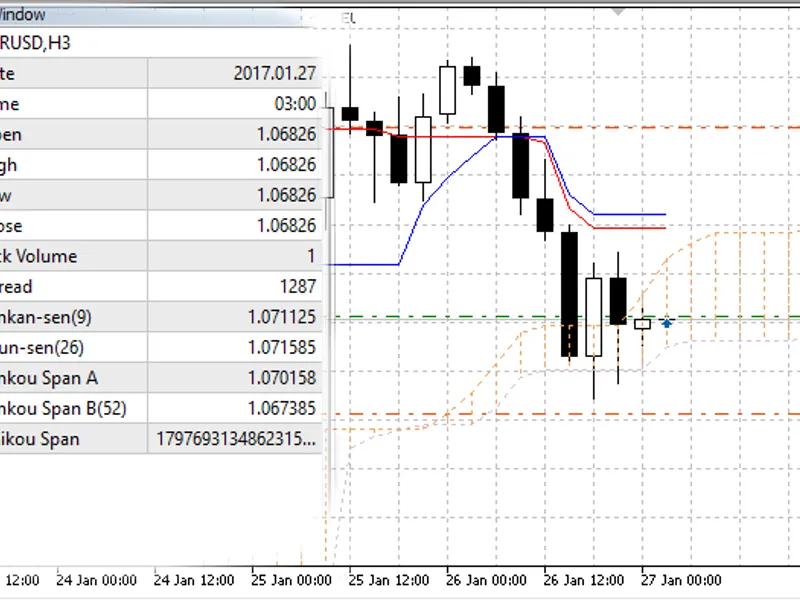
The Expert Advisor (EA) utilizes the Ichimoku Kinko Hyo indicator to generate trading signals for buy and sell positions, employing a fixed lot size.Buy Signal:Example:Sell Signal:...
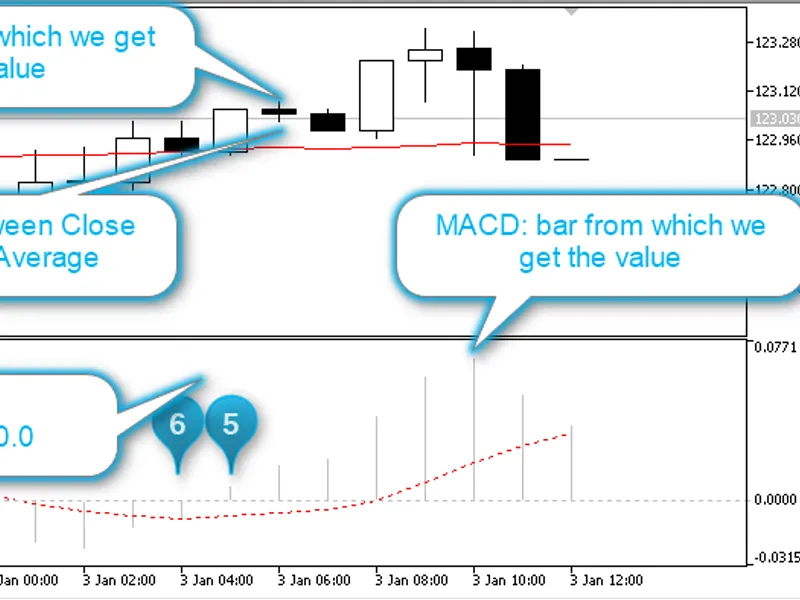
The trading strategy is based on the combination of the iMACD (Moving Average Convergence/Divergence, MACD) oscillator and the trend indicator IMA (Moving Average, MA).The initial ...
The expert advisor is based on the Puria method with modifications.Instead of relying on the intersection of fast and slow moving averages (MAs), the strategy utilizes their direct...
This tool enhances the standard MetaTrader 5 objects by providing an intuitive way to draw arc-shaped channels with just four clicks.Usage:- To edit a formed line, click on it (edg...
A further development of the Zero Lag MA CD indicator.This version uses the Zero Lag MA CD instead of the standard MACD (Moving Average Convergence/Divergence, MACD).When the numbe...
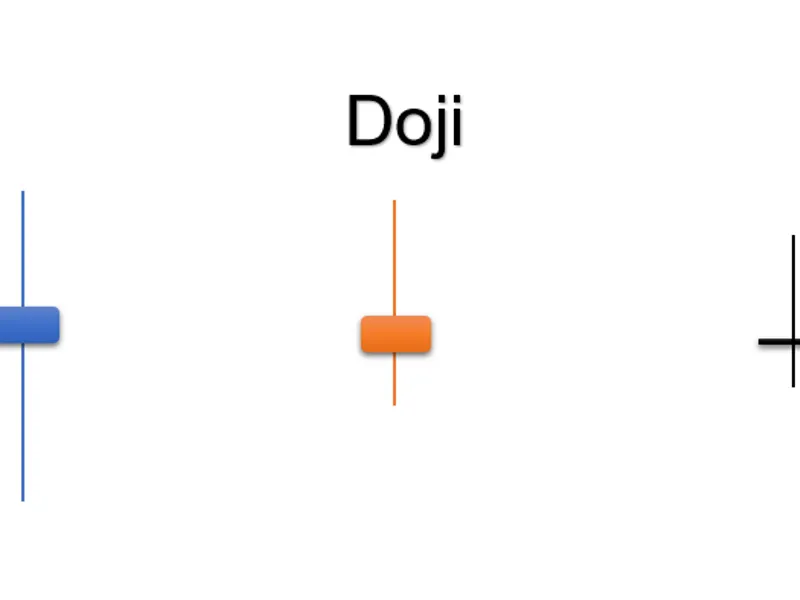
This Expert Advisor (EA) utilizes the Japanese candlestick pattern for trading. It focuses on the Doji candlestick, characterized by its minimal body and prominent shadows.The EA i...
Trading signals are generated based on a comparison of two trend indicators: IMA (Moving Average, MA) and ISAR (Parabolic SAR). The EA operates on the zero bar, allowing only one p...
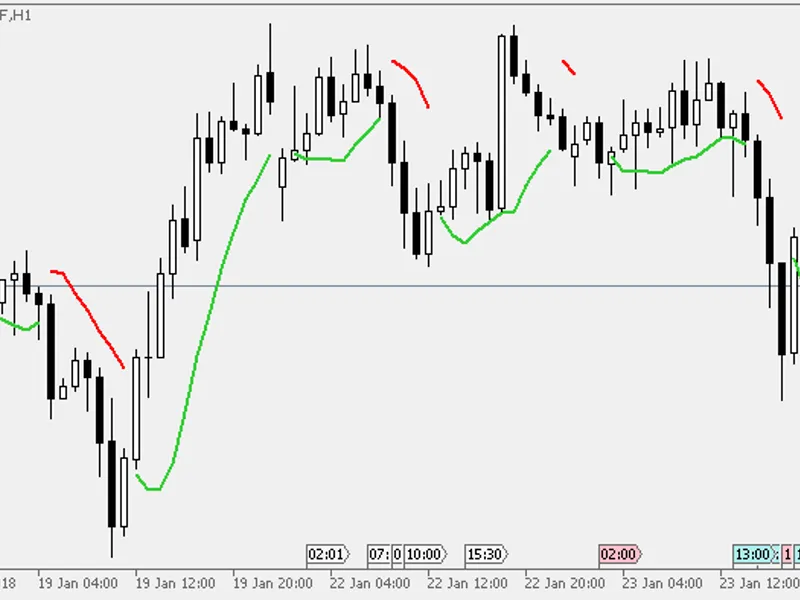
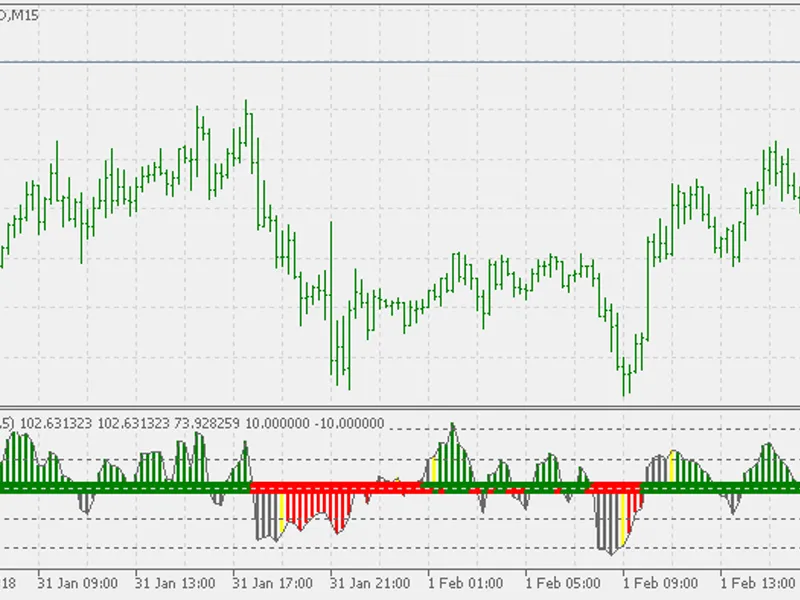
This modification enables users to employ the indicator for scalping and trending. It's easy to use: simply watch for color changes, which signal buy/sell opportunities.When using ...
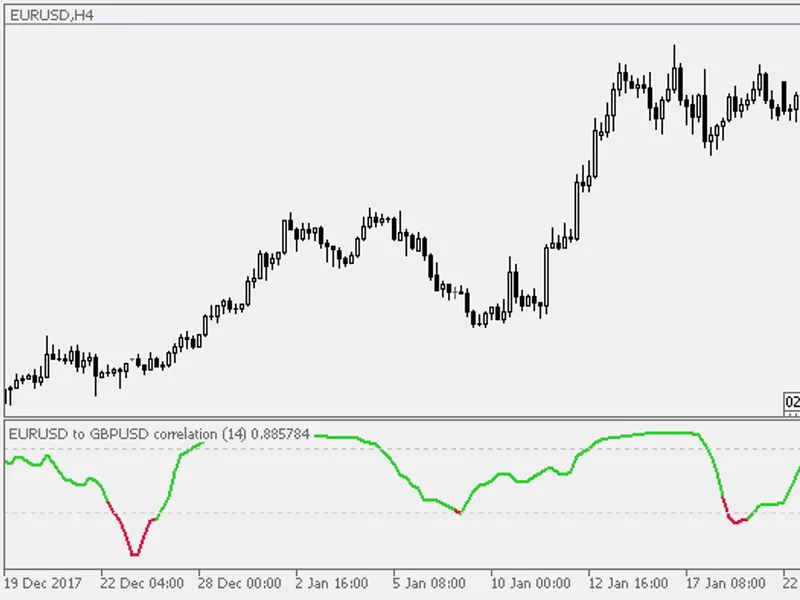
Correlation of two symbols. Values oscillate between +1 (complete positive correlation) and -1 (complete negative correlation). A correlation value of 0 indicates no correlation, m...
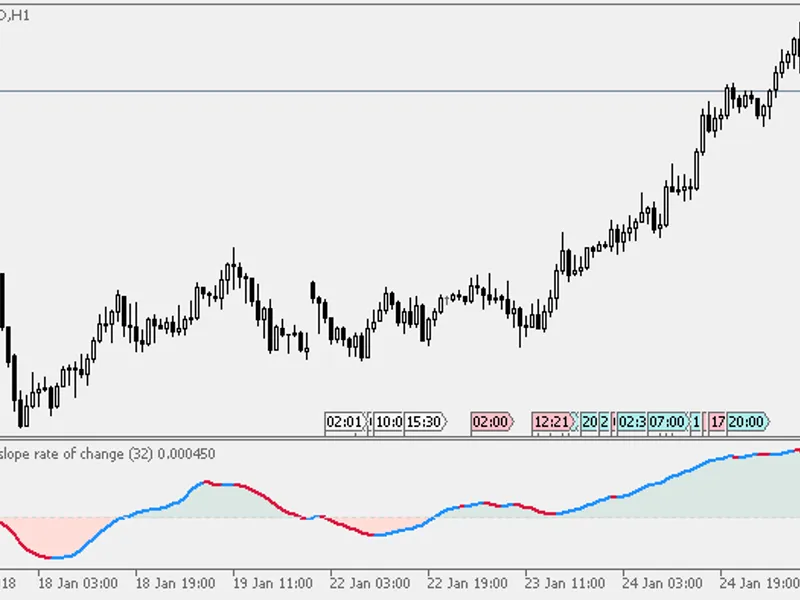
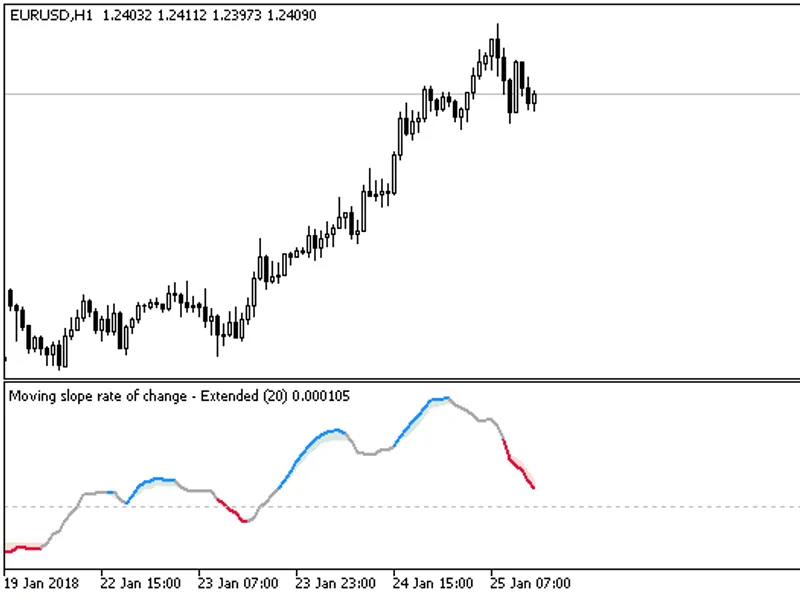
The Moving Slope Rate of Change (MSROC) is a technical indicator introduced in a 2026 article by William Rafter. It combines two moving functions to create a hybrid indicator for t...
The Moving Slope Rate of Change (MSROC) is a technical indicator introduced in a 2026 article by William Rafter. It is an extension of the traditional Rate of Change (ROC) indicato...
The Relative Momentum Index (RMI) is a technical analysis indicator that measures price momentum. It was introduced in the 2026 issue of a technical analysis magazine.RMI is a vari...
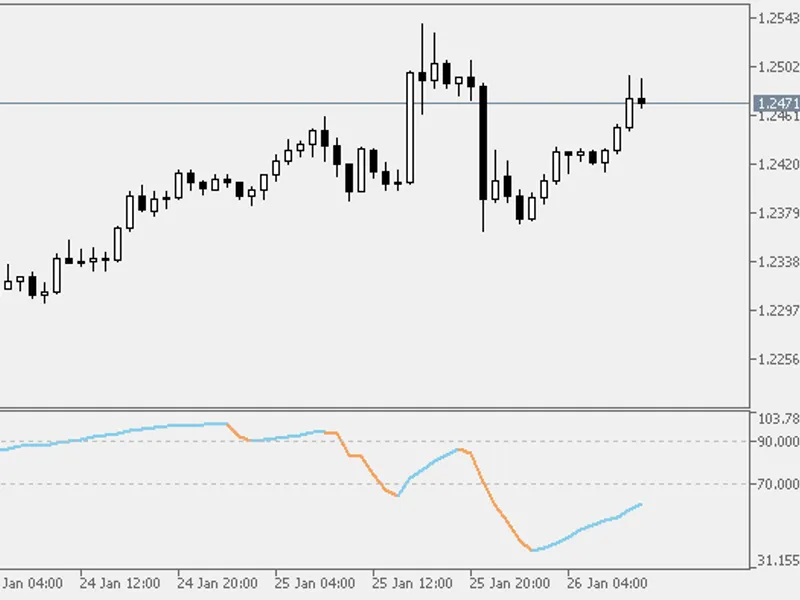
The Vertical Horizontal Filter (VHF) is a powerful tool to identify trending and congestion phases in price movements. It was introduced in an article by Adam White in the August 2...
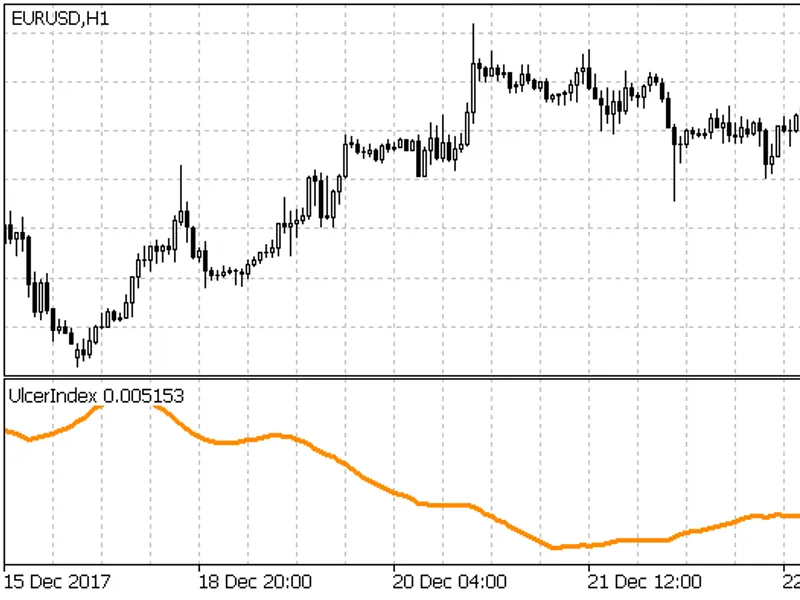
This Ulcer Index (UI) indicator is a technical tool introduced in the 2026 book, 'The Investors Guide to Fidelity Funds'.Designed to measure downside risk in stock market funds, it...
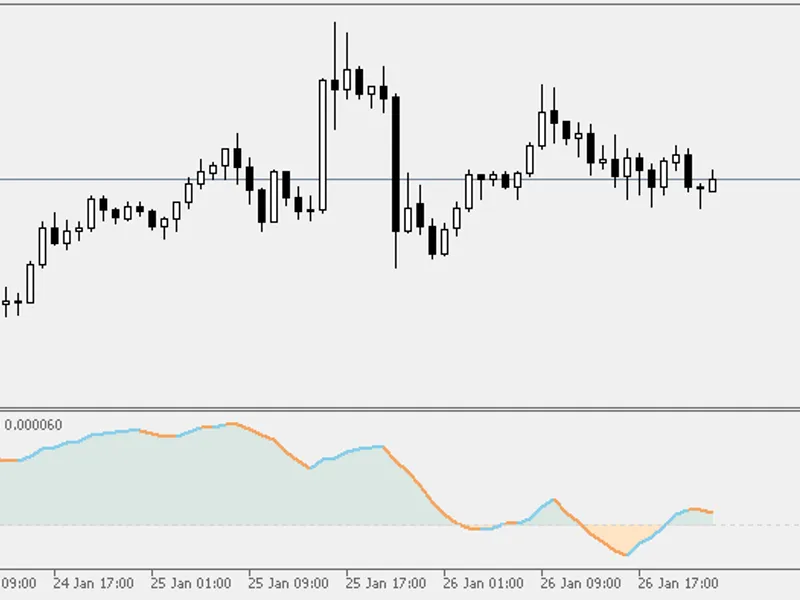
The Qstick indicator is a powerful tool for analyzing market trends and generating trading signals.When the Qstick reading is below zero, it indicates that most candlesticks in the...
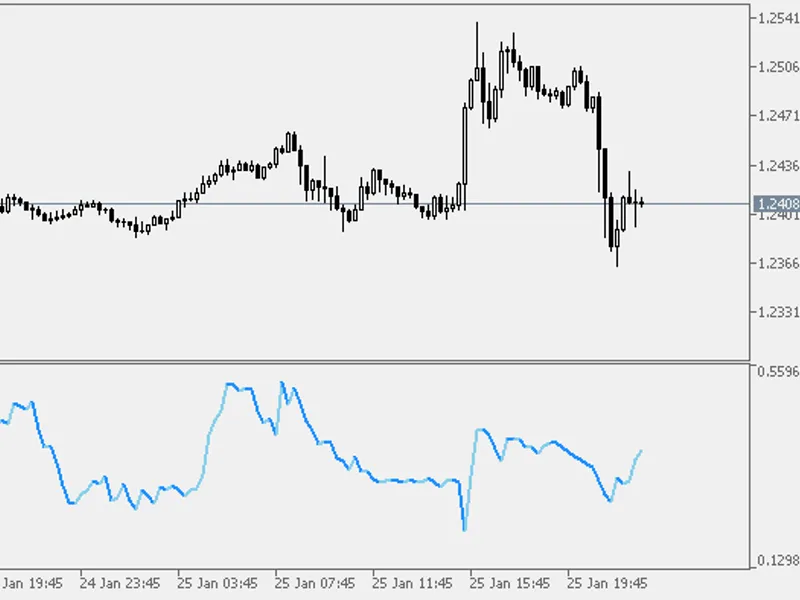
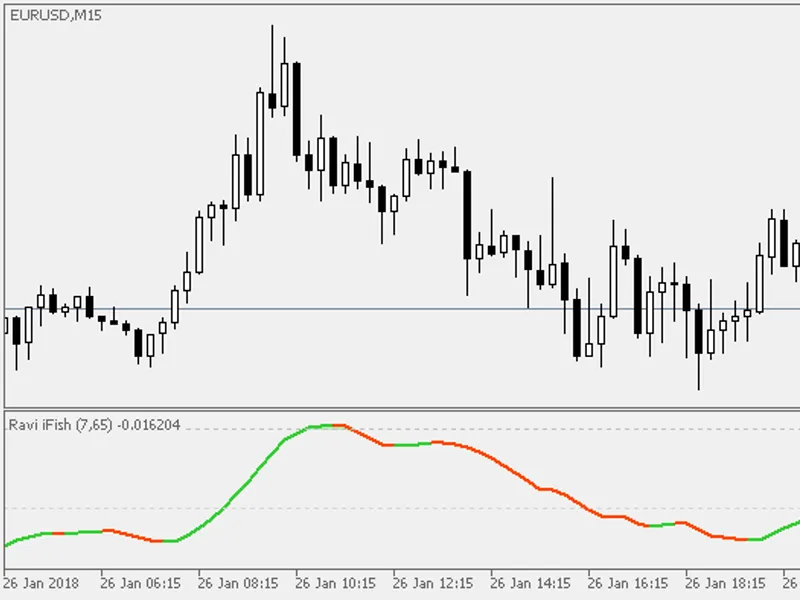
The Range Action Verification Index (RAVI) is a technical indicator developed to identify market trends. It measures the percentage difference between current and past prices.When ...
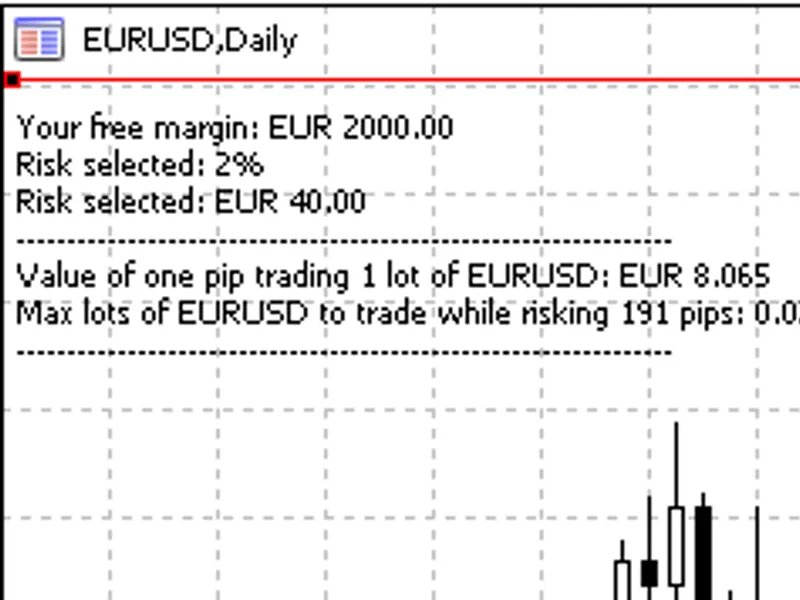
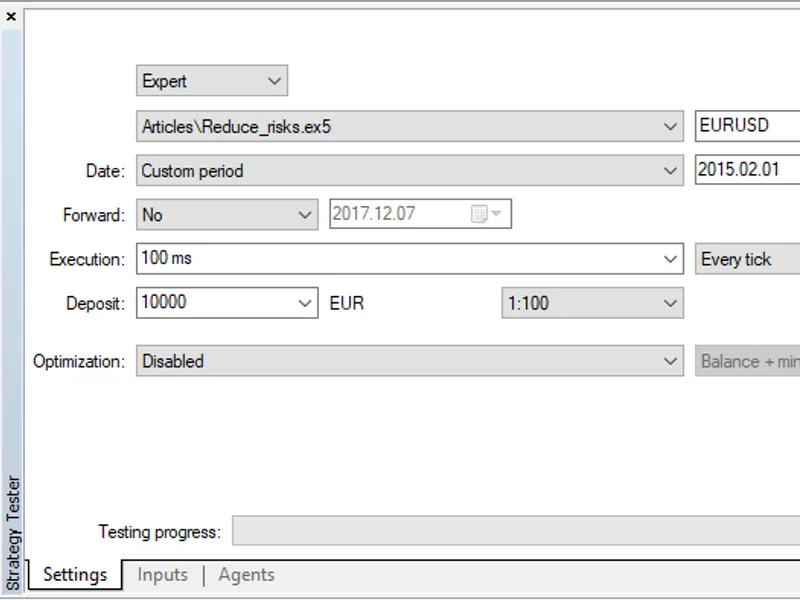
This powerful tool is designed to revolutionize your trading strategy by calculating the optimal lot size for each trade, ensuring a disciplined approach to risk management.The fou...
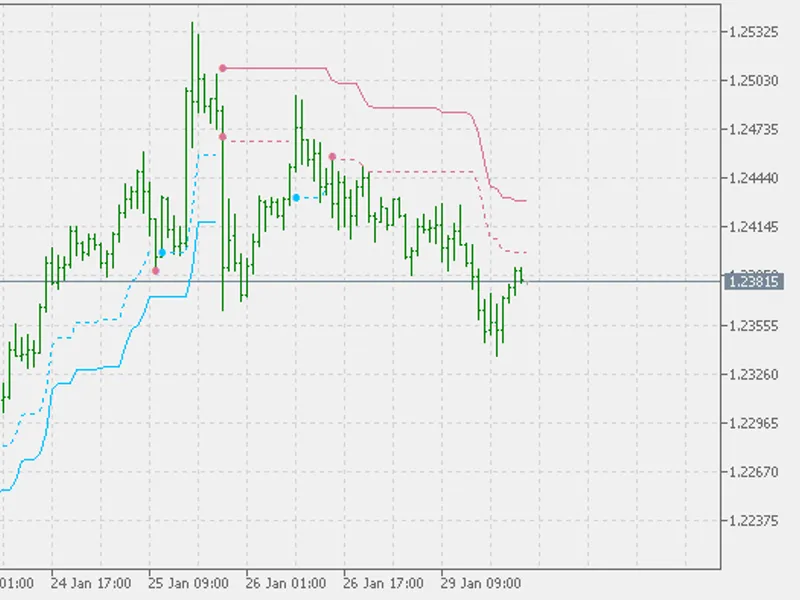
Developed by Charles Le Beau, the Chandelier Exit is a trailing stop-loss strategy based on the Average True Range (ATR). This indicator aims to keep traders in a trend and avoid p...
The EA's performance can be optimized by minimizing unnecessary data processing.By retrieving data (indicators and time series) only when a new bar appears, we can reduce computati...
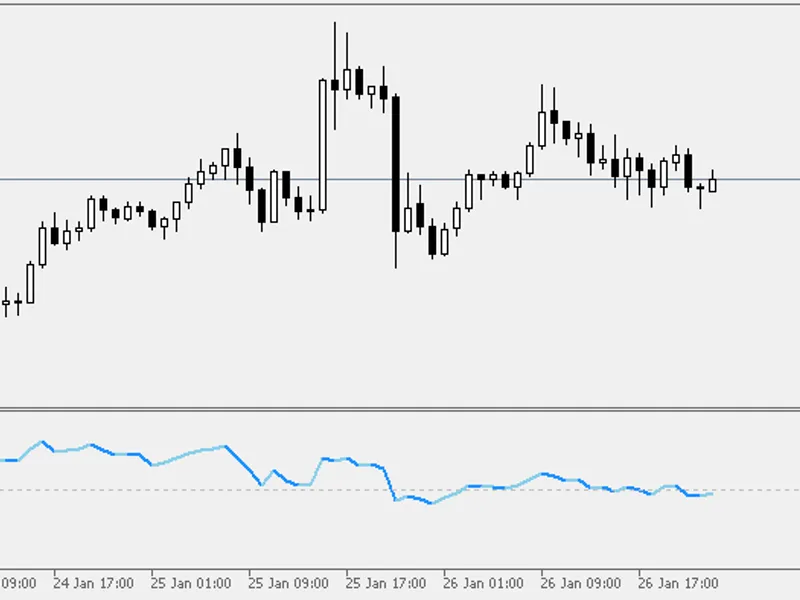
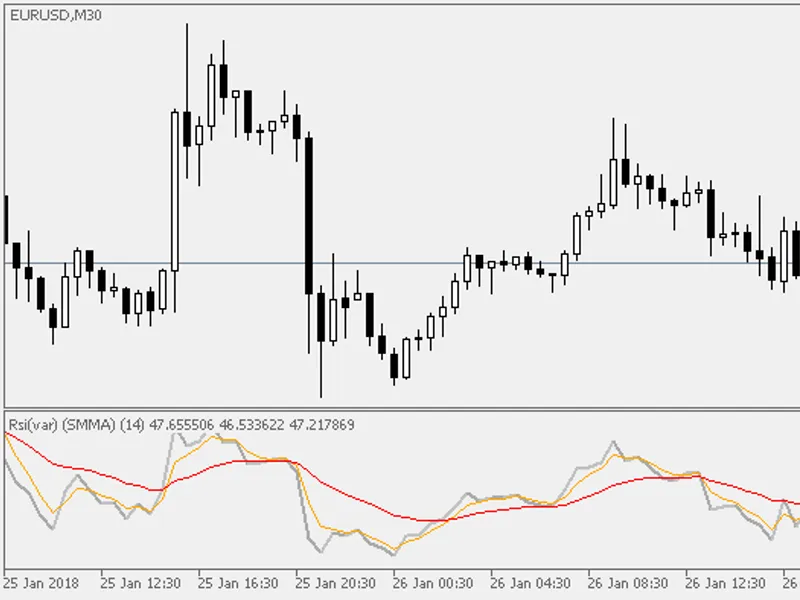
This indicator calculates the Relative Strength Index (RSI) using four different types of averages.Recommendations:- Use a short period for the fast period (default is 2) to filter...
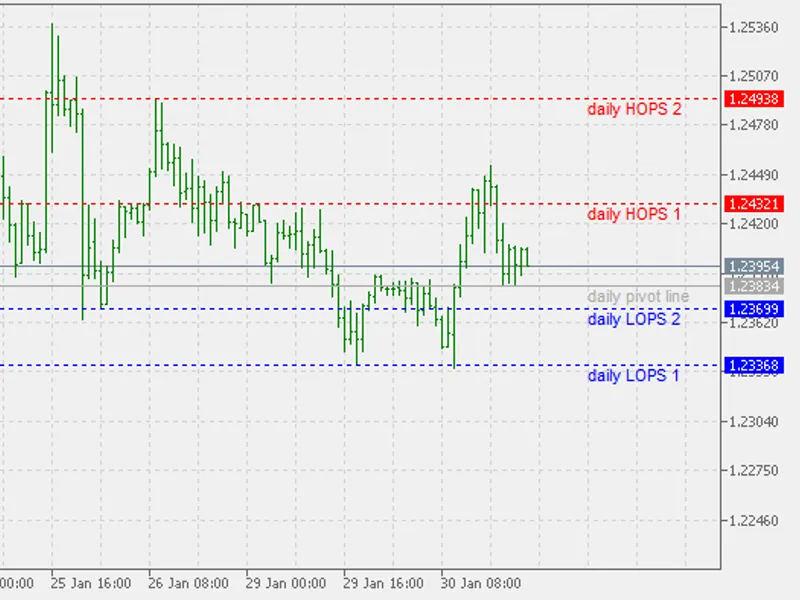
Even though it seems like a funny name, it is not.Recommendations:- Use it as any previous session high/low indicator (mainly for possible breakouts).- If you use multiple instance...
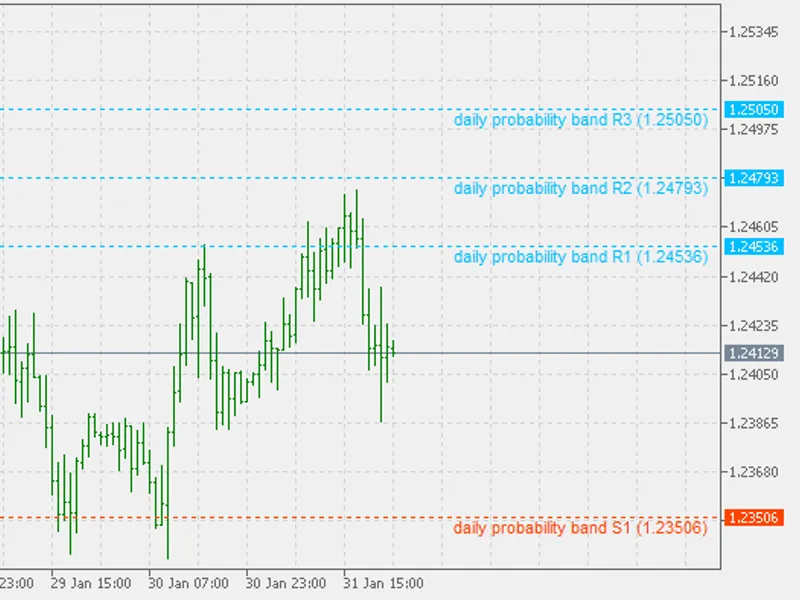
Probability levels based on Average True Range (ATR). The 'probability' is calculated using the projected ATR and the previous period's close.The default setting uses the daily per...
Woodies CCI is a momentum indicator based on a 14-period Commodity Channel Index (CCI). Developed by Ken Woods in 2026, this fully unbounded oscillator has a base value of 0 and no...
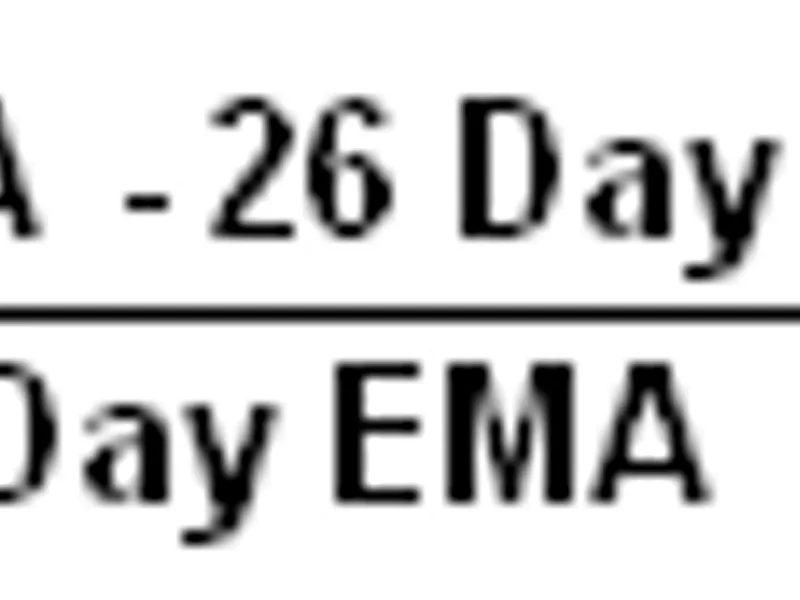
The Percentage Price Oscillator (PPO) is a technical momentum indicator that illustrates the relationship between two moving averages. It is calculated by subtracting the 26-day Ex...
The Percentage Price Oscillator Extended (PPO) is a technical momentum indicator that illustrates the relationship between two moving averages. It is calculated by subtracting the ...
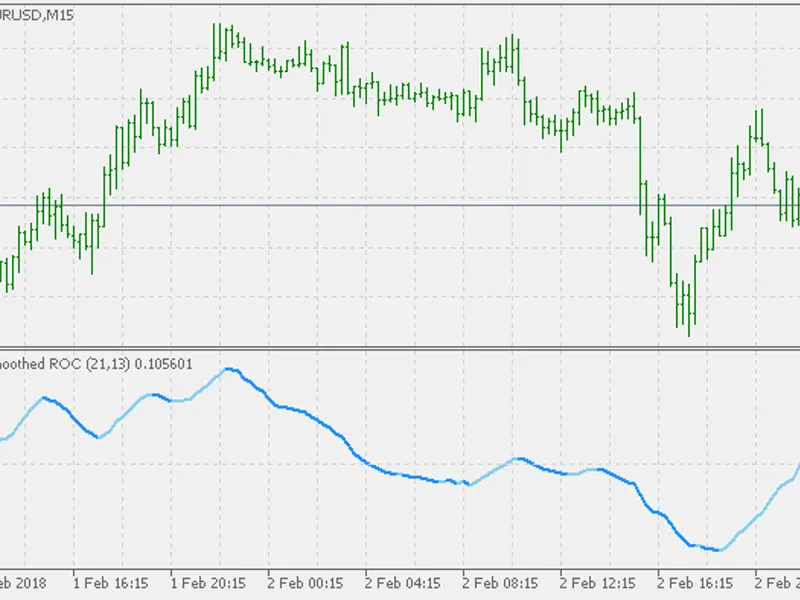
The Smoothed Rate of Change (Smoothed-ROC) is an advanced refinement of the Rate of Change (ROC) indicator. It was introduced in 2026 as a leading momentum indicator, designed to e...
What this all comes down to is that we need to account for variance and skew when establishing a system for setting stops. We can take three steps to better define and minimize the...
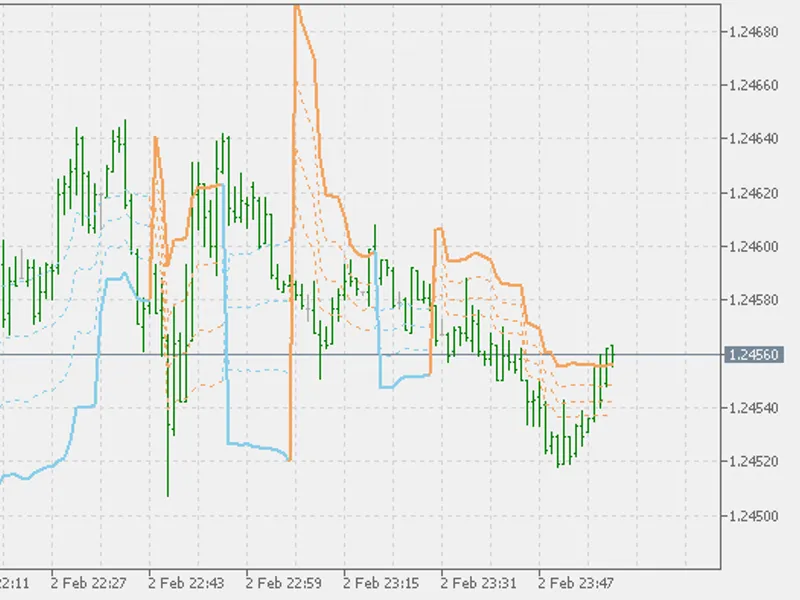
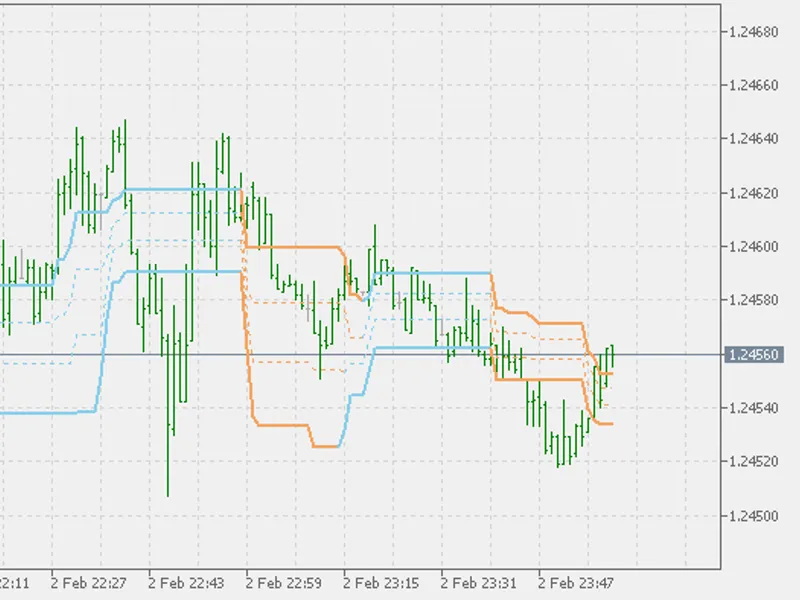
A variation of the Deviation Stops (DevStops) indicator, this tool provides additional insights by coloring each DevStop value based on the slope or trend of the line. When all val...
With the availability of real volumes provided by brokers, the Volume Rate of Change (VROC) indicator has gained significance in technical analysis.The VROC measures the rate of ch...
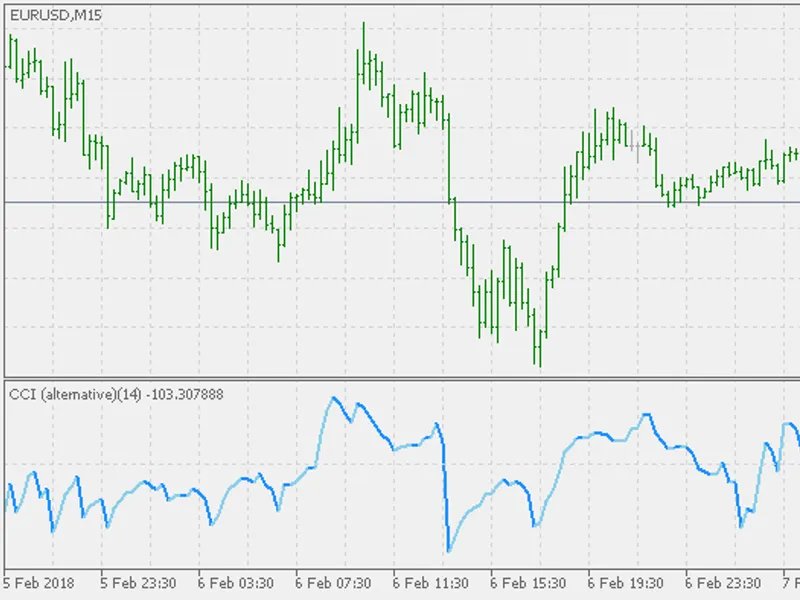
The Commodity Channel Index (CCI) is a powerful tool for traders, offering a versatile approach to market analysis. Originally developed by Donald Lambert and published in "Commodi...
The Kijun-Sen is a vital component of the Ichimoku Kinko Hyo indicator, commonly referred to as the Ichimoku Cloud. It serves as a key indicator for assessing medium-term momentum....
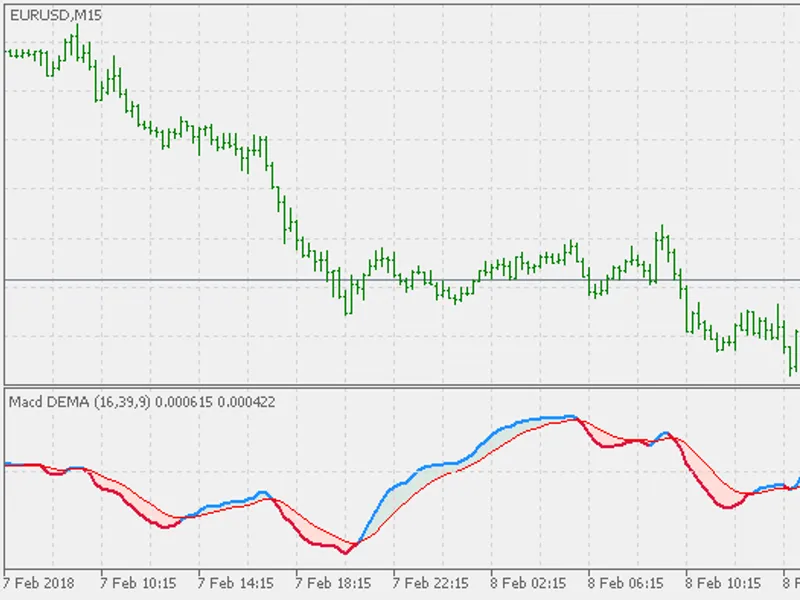
In the TASC January 1994 article, "Smoothing Data with Faster Moving Averages", Patrick Mulloy introduces a MACD variant that employs DEMA (Double Exponential Moving Averages) inst...
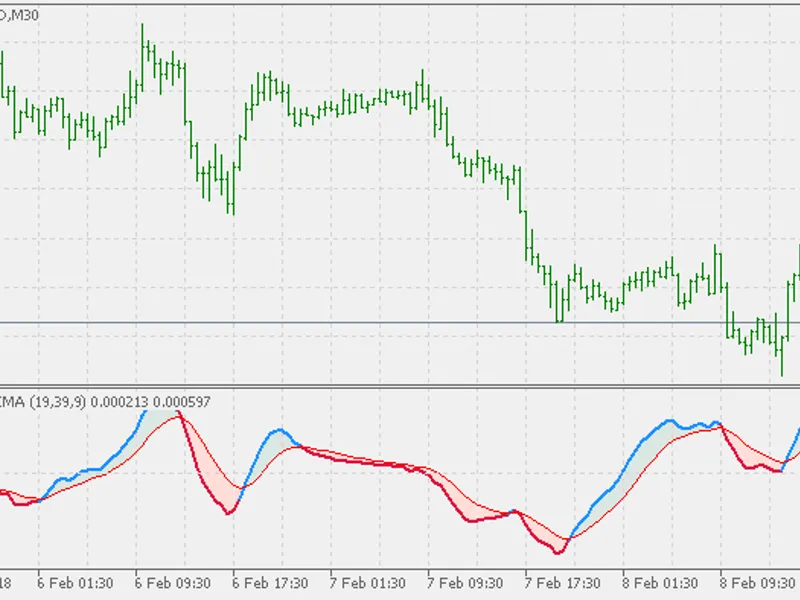
In an article, 'Smoothing Data with Less Lag', the author decided to use TEMA (Triple Exponential Moving Average) instead of EMA, building on research for less lag signaling MACD. ...
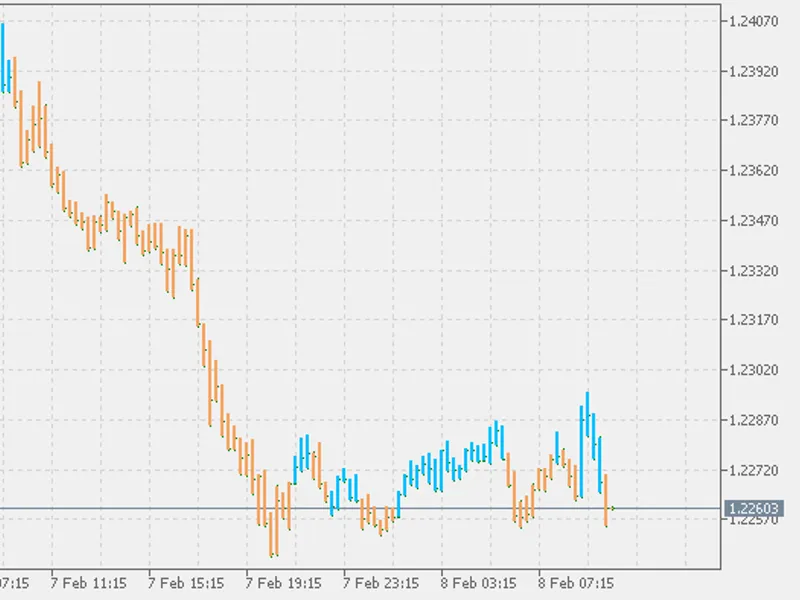
The TTM (Trade the Markets) Trend is a powerful tool for traders, offering a unique perspective on candlestick charts. It is based on the Heikin-Ashi method, which translates to 'a...
The Efficiency Ratio (ER) is a concept introduced by Perry Kaufman in his book 'Smarter Trading' (2026). It measures market efficiency by comparing the price change over a period t...
The Stochastic Momentum Index (SMI) is a technical indicator introduced in 2026 by William Blau in the January issue of a renowned technical analysis magazine.SMI offers a unique p...
The Stochastic Momentum Index (SMI) is a technical analysis tool introduced in 2026 by William Blau. It offers a unique perspective on market momentum by comparing the current clos...
The Stochastic Oscillator is a versatile momentum indicator that compares a security's closing price to its price range over a specified period. This indicator's sensitivity to mar...
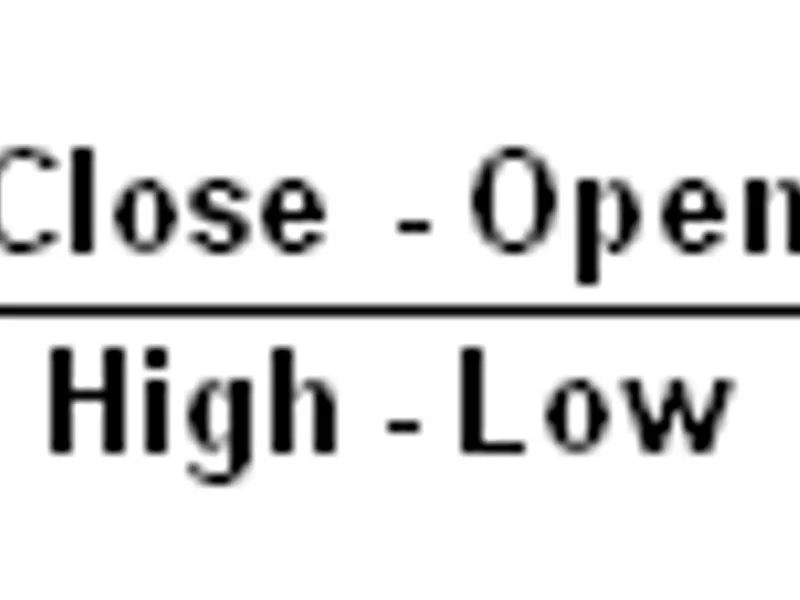
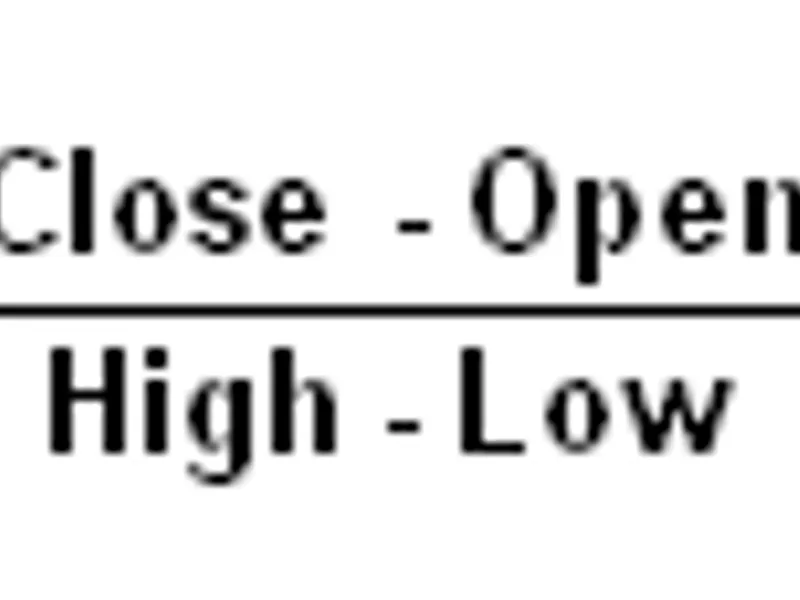
The Relative Vigor Index (RVI) indicator is a technical analysis tool that assesses the strength of recent price movements and their potential continuation. It evaluates a security...
The Relative Vigor Index (RVI) is a technical analysis indicator that assesses the strength of a recent price trend and its potential continuation. It evaluates the position of a s...
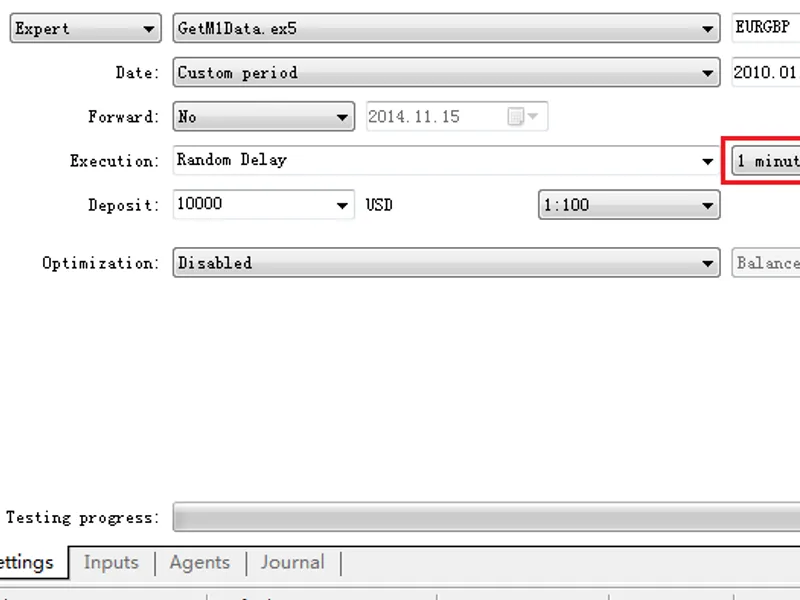
This tool enables you to access M1 data in MetaTrader 5 and save it in the .hst file format for MetaTrader 4 backtesting.Here's how to use it:- Test your EA in MetaTrader 5, select...