This indicator plots arrows to indicate gaps in the market. Up arrows for bullish gaps and down arrows for bearish gaps. It can also plot a cross for a closed gap or hide it.Trader...
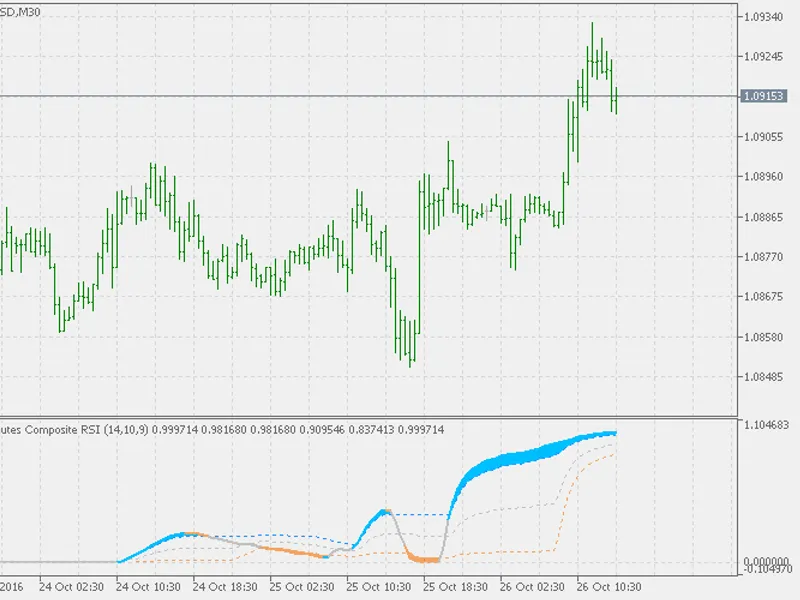
The Composite RSI is a unique indicator that offers a fresh perspective on market analysis.While its name might suggest a combination of multiple RSIs, it is, in fact, a novel appr...
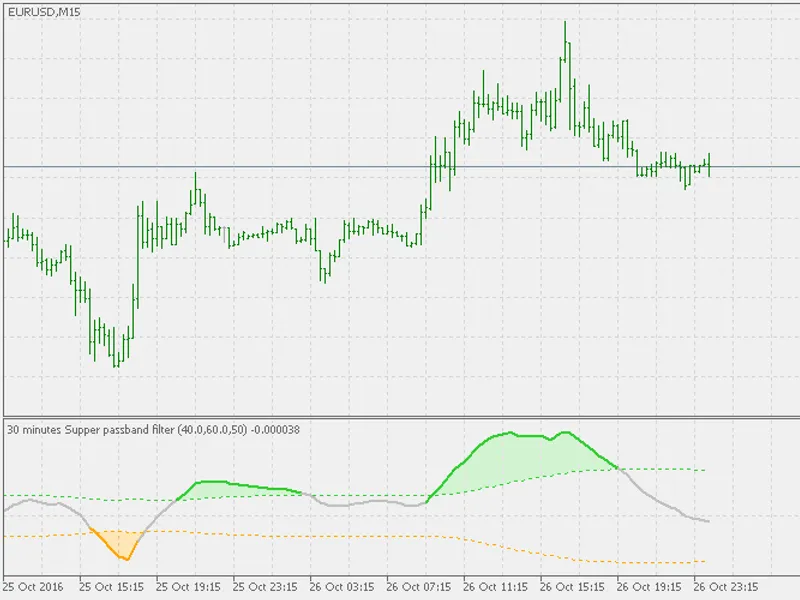
This indicator is based on John Ehlers' work, with a deviation that allows for different calculating periods. The default settings follow Ehlers' original parameters, but customiza...
The indicator presents five symbol parameters and two account parameters, some of which may fluctuate during significant news releases or before the weekly session closes.The follo...
Modification of the standard Awesome Oscillator.Recommended timeframe: M15.This version is suitable for capturing small movements (around 100 points) on volatile pairs.The upper in...
This indicator calculates and displays options levels on the chart.Download the CME bulletin:- СМЕ bulletin- ftp://ftp.cme.com/bulletin/Input the required parameters and view the o...
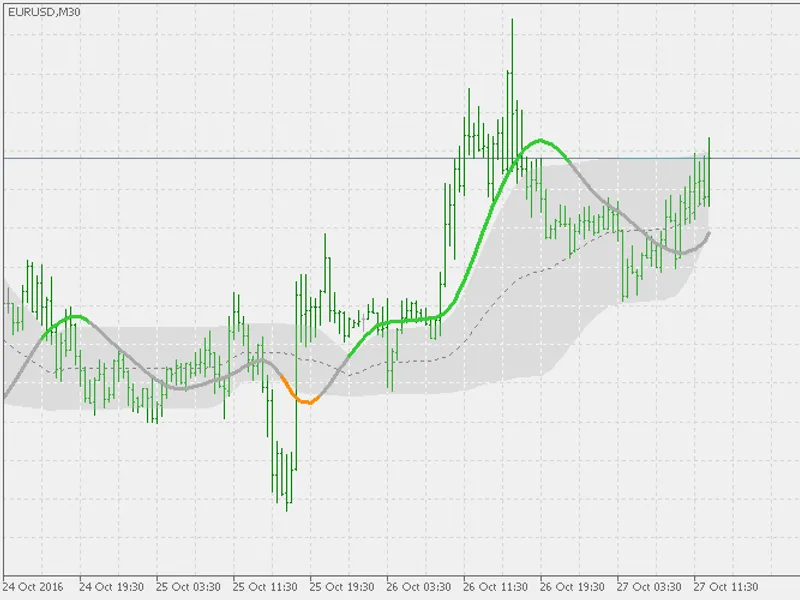
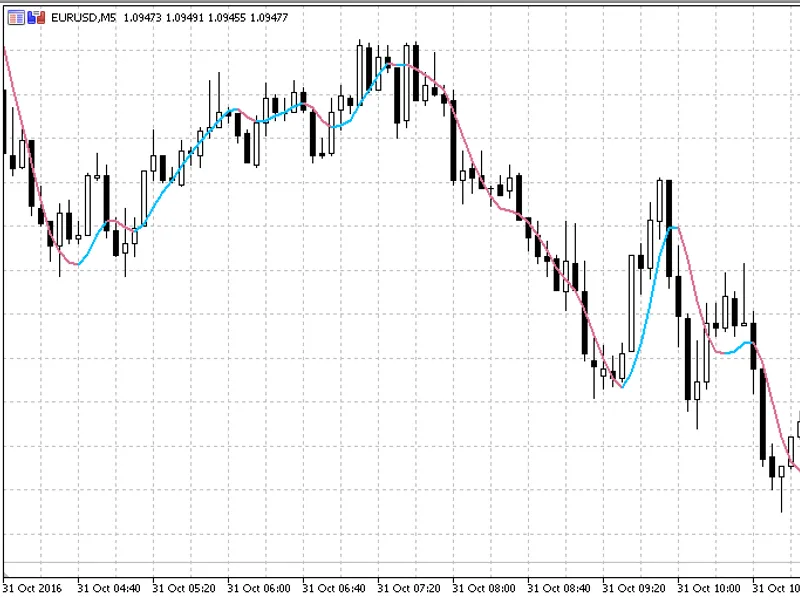
T3 indicator utilizing floating levels to determine trend direction.This indicator employs an extended set of 22 price types and adapts its colors and alerts based on three conditi...
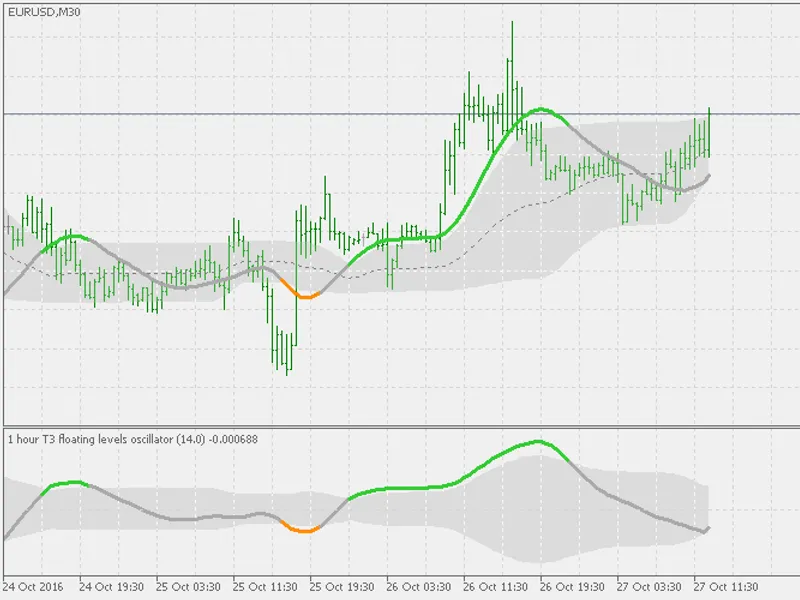
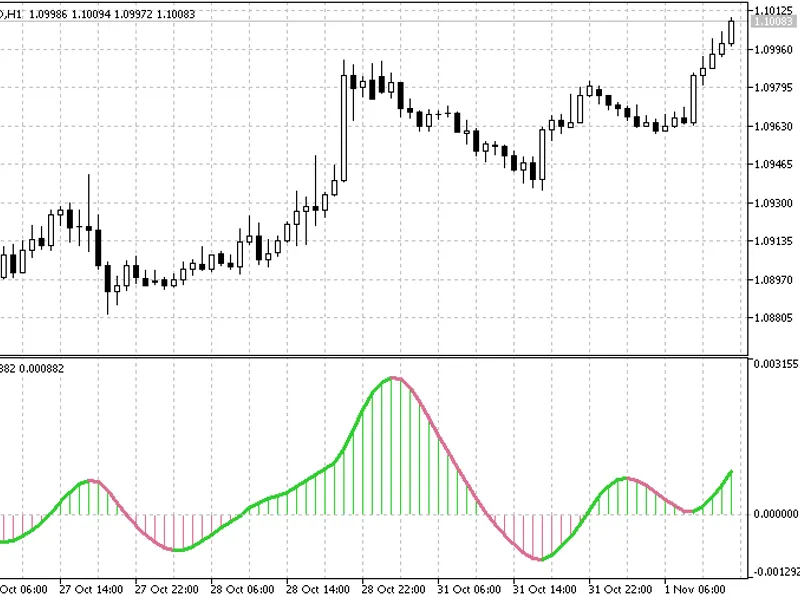
T3 indicator with floating levels, transformed into an oscillator.This indicator is an extension of the T3 Floating Levels indicator, designed to provide additional insights into t...
This indicator is designed for testing and practicing manual trading strategies. It offers comprehensive operation reports in table and chart formats, saving templates with and wit...
The OANDAX product series is designed to display additional data on orders and positions provided by the OANDA FXLabs service.The OANDAX OrderBook Chart indicator is designed to di...
This indicator displays two text labels at the bottom right corner of the chart, showing the current spread and time remaining until the next candle closes.Users can customize the ...
This indicator identifies the price pivot point, a crucial level where price reversal is likely.When candles form a pattern with wicks that can be intersected by a line, it often s...
This indicator calculates and displays the price change as a percentage relative to the open price of the current candle.Key features:- Percentage price change calculation based on...
The check mark pattern is a technical analysis tool used to predict the type of the next candle: bullish or bearish.This pattern is plotted similarly to the 'Three Inside Up/Down' ...
This indicator calculates and displays the difference between the arithmetic mean and geometric mean of the price.The price is determined using the formula: (O+H+L+C)/4, where O re...
This indicator calculates and displays the difference between the estimated values of the current and previous bars.The estimated value is derived from the difference between the a...
This indicator provides a comprehensive view of trading performance by displaying the total volume and profit of trades for each direction.Key features:- Volume and profit monitori...
This indicator calculates and plots two channels based on the price movement over a specified number of bars (default 200). The channels represent the limits where the price ranges...
This indicator provides a simple yet powerful tool for traders, displaying the moving average for the chosen timeframe.It offers a clear and concise way to visualize the trend and ...
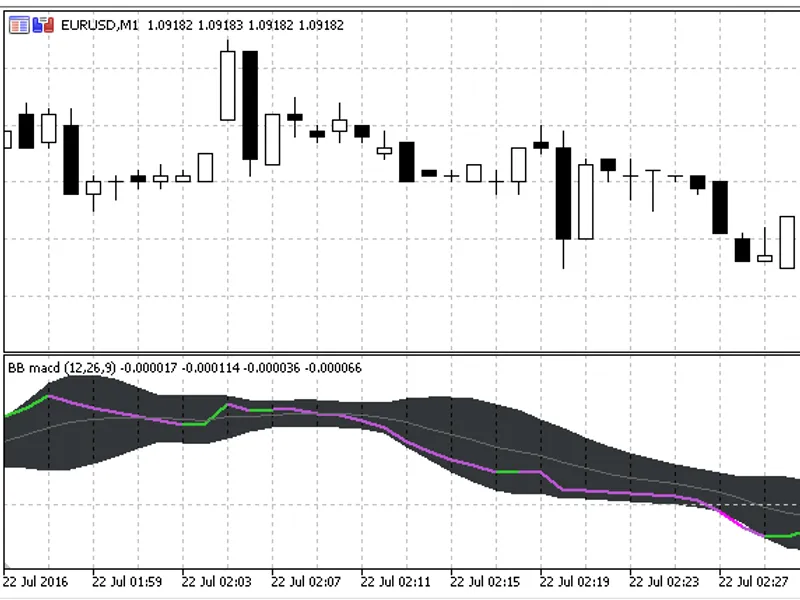
BB MACD is a MACD (Moving Average Convergence Divergence) indicator variation with an addition of Bollinger Bands, which aids in identifying trend change points and gauging the str...
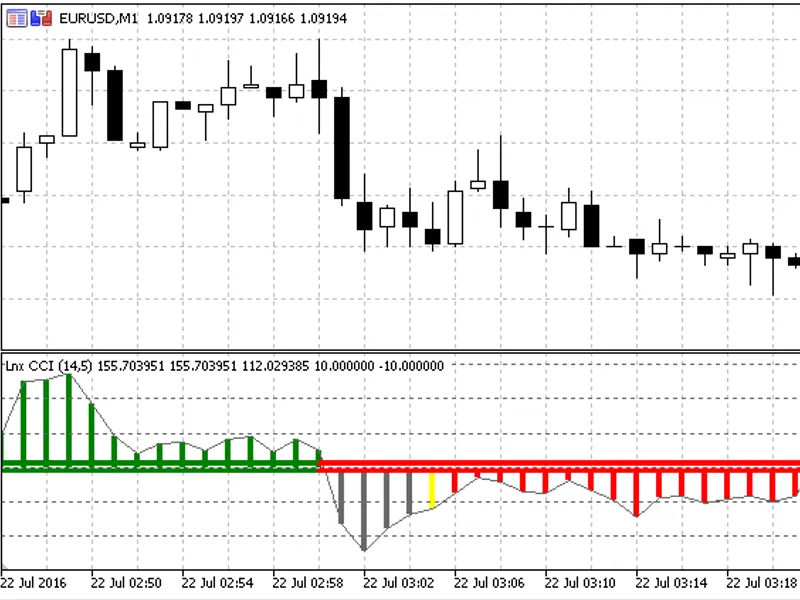
The Woodies CCI System is designed for trading primarily on 5-minute charts. The indicator is optimized for this specific time frame with its default settings.For usage on other ti...
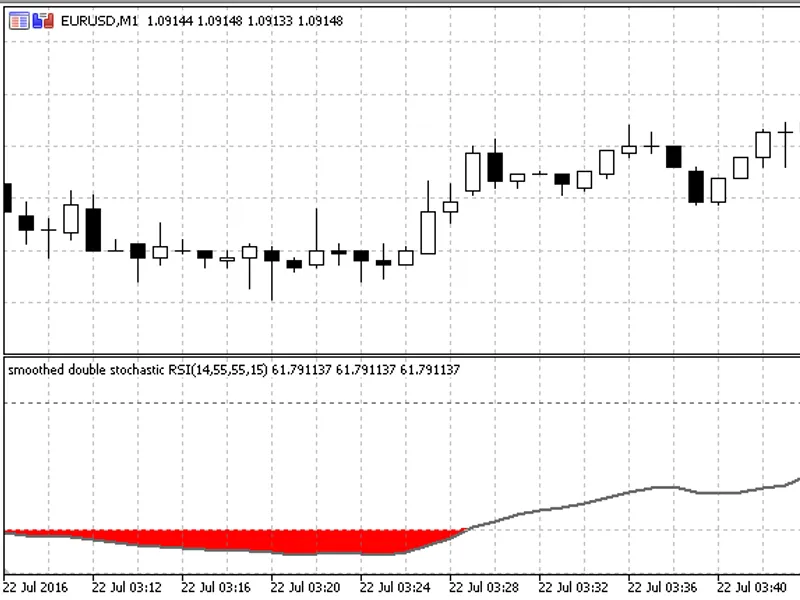
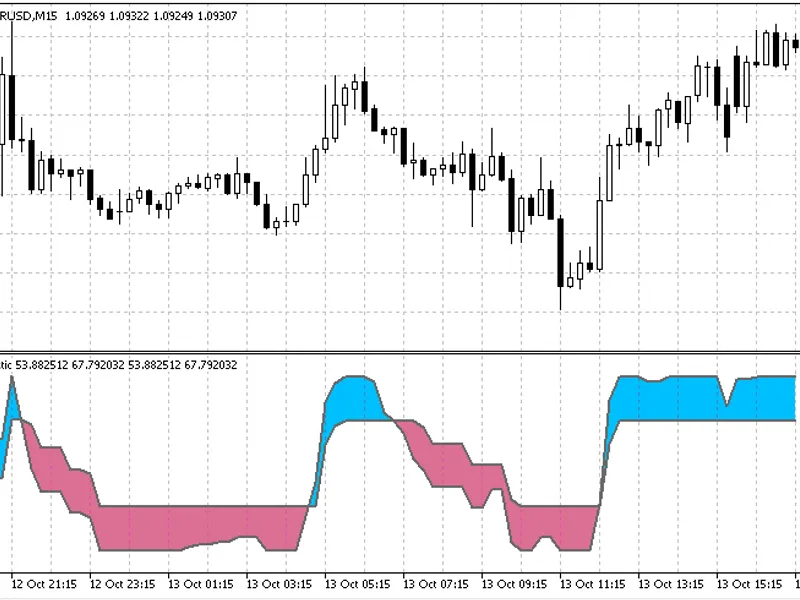
Stochastic RSI (sometimes referred to as DTOSC - Dynamic Trend Oscillator) is a technical indicator derived from the Relative Strength Index (RSI). It is essentially a stochastic v...
A variation on the T3 theme, this indicator creates envelopes using T3 for basic value instead of built-in averages. It functions similarly to standard envelopes, but remember that...
This indicator is an enhanced version of the classic Guppy Multiple Moving Averages (MM) indicator, updated for modern trading platforms.The original indicator was based on Exponen...
A unique indicator that calculates a stochastic and then applies the same calculation to the resulting data.This innovative approach provides an additional layer of analysis, offer...
A straightforward indicator designed to display the high and low values of a specified time frame on the current chart.This tool offers the flexibility to limit the display of high...
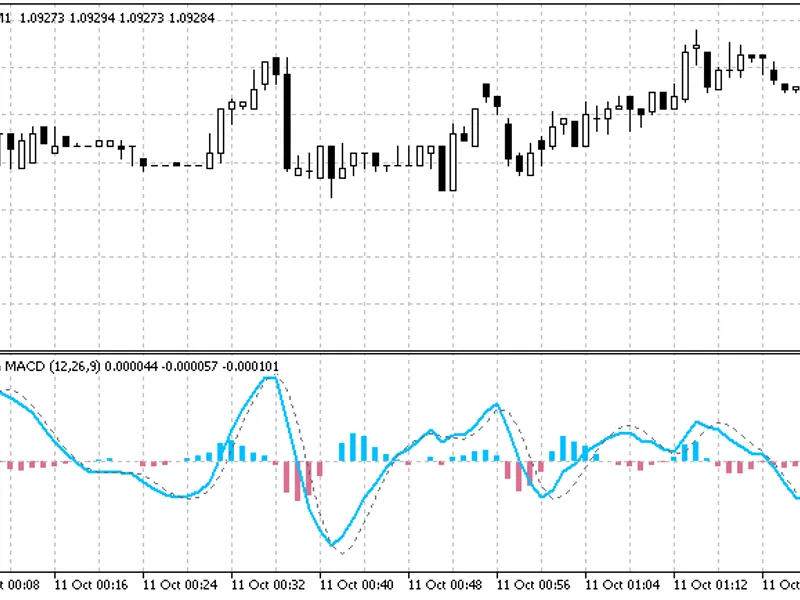
A variation of the MACD indicator that uses Nonlag MA for calculation, making it faster and more responsive.This indicator offers a unique approach by employing Nonlag MA for both ...
This indicator displays three T3s calculated based on the high, close, and low prices.The indicator features a unique color-coding system. When the upper two T3s have the same slop...
The Relative Volatility Index is an indicator that deviates from the original calculation by incorporating smoothing. This modification addresses the 'jumpy' nature of the original...
The Step Stochastic indicator is designed to address the issue of deformation over time in traditional step stochastic indicators.The traditional step stochastic indicator calculat...
This is a DT Oscillator as described by Robert Miner. It includes additional features not available in MetaTrader 4, such as a filled zone between the oscillator and the signal lin...
This script provides a comprehensive set of moving average indicators for MetaTrader 5 (MT5).It includes:- Simple Moving Average (SMA)- Exponential Moving Average (EMA)- Smoothed M...
This indicator is a multi-timeframe tool with alert functionality, covering the essential requirements for a comprehensive indicator.It provides a versatile solution for traders, o...
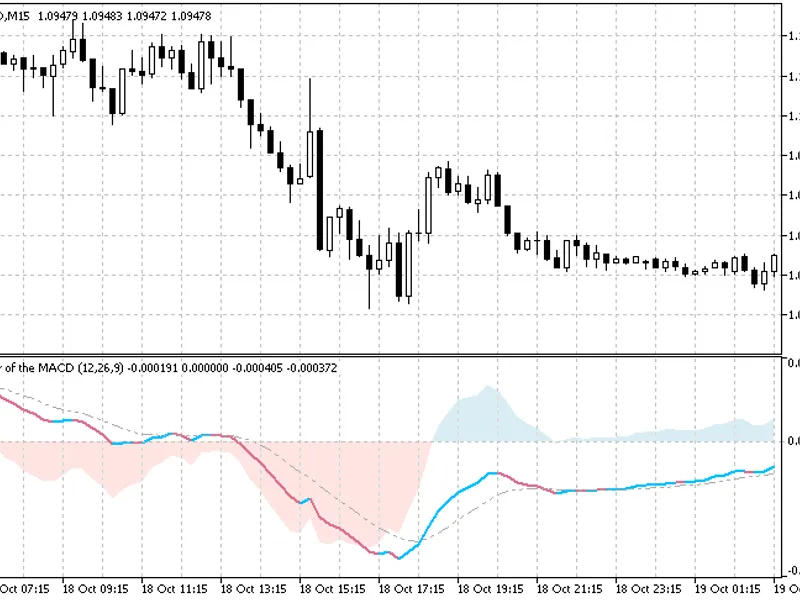
This is the leader of the MACD indicator, which combines two indicators in one. It features a regular MACD displayed as lines (with the colored line representing the regular MACD a...
This indicator is based on the original Keltner Channel, which utilized a Simple Moving Average (SMA) and range-based band calculations, specifically the average range rather than ...
This indicator calculates the autocorrelation of the Spearman Rank, a measure of the correlation between the indicator and itself. It includes additional features such as zones for...
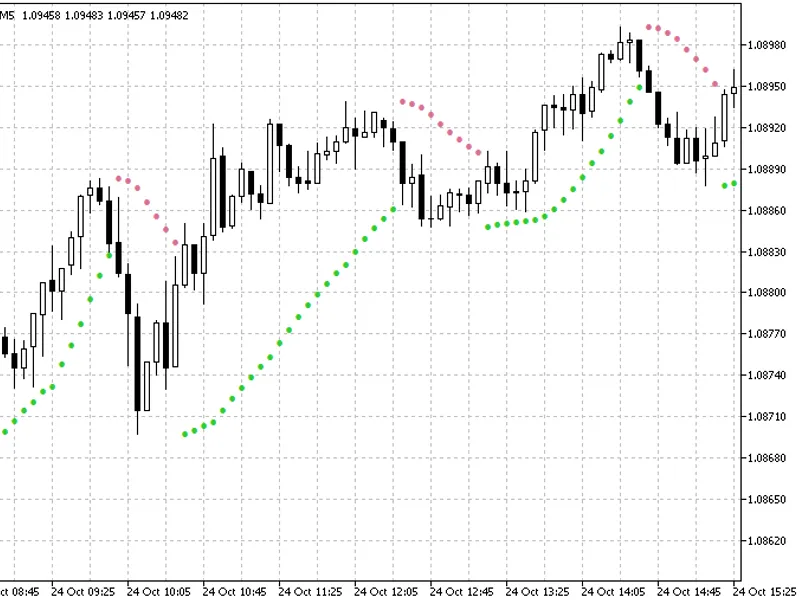
This is an improved Parabolic SAR indicator that addresses common issues with existing versions. It provides a more accurate calculation and a dual-color display for better trend v...
The Keltner Channel Oscillator is a unique indicator designed to enhance the monitoring of channel breakouts. By transforming the traditional Keltner Channel into an oscillator for...
A variation of the Hull Moving Average that offers speed adjustment capabilities.This indicator provides traders with a versatile tool to fine-tune the sensitivity of the Hull Movi...
Unlike MetaTrader 4, MetaTrader 5 supports 'real' volumes for certain symbols. This indicator allows you to select between using real volume or tick volume (the default for forex s...
This indicator calculates the Volume Weighted Moving Average (VWMA) for your charts, with the option to use either tick volume or real volume (for symbols that support real volumes...
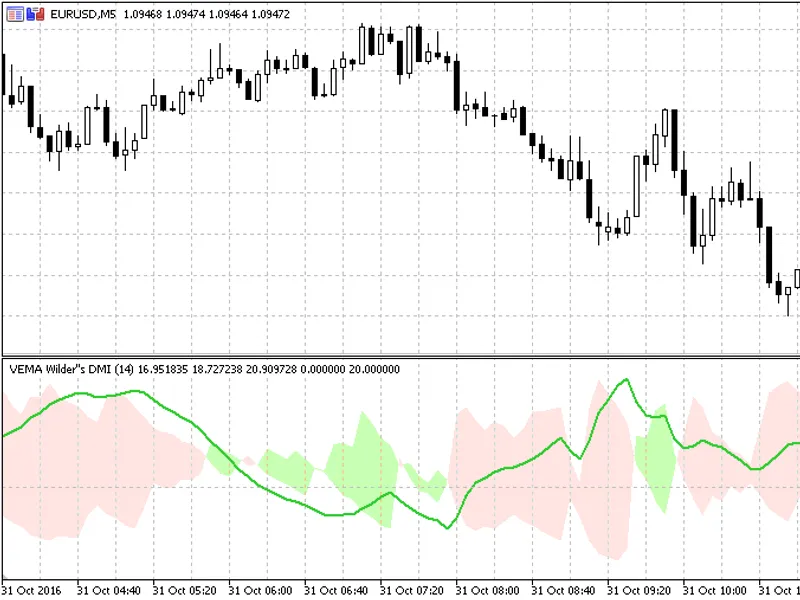
This indicator is a volume-weighted version of Wilder's DMI (Directional Movement Index), also known as the real ADX.It offers flexibility by accommodating three types of volumes:-...
This updated and upgraded indicator offers a comprehensive suite of 18 types of averages, providing a versatile tool for technical analysis.The available averages include:- Simple ...
This is a MetaTrader 5 version of the Jurik Velocity indicator, also known as the 'Smoother Moment'. It offers an additional choice of prices, including the Heiken Ashi variation, ...
This indicator is designed to provide a clear trading signal without any adjustable parameters. It is recommended for use on higher time frames, starting from the 1-hour chart, to ...
The T3 Velocity indicator is a refined momentum calculation based on Mark Jurik's work. Unlike some variations, the original Velocity by Jurik does not incorporate JMA. It offers a...
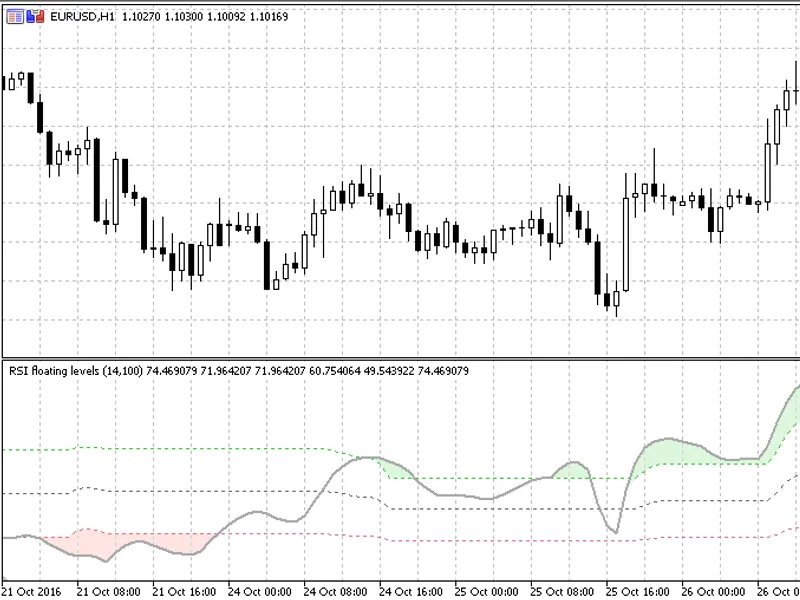
The Relative Strength Index (RSI) is a valuable tool, but it has a limiting characteristic known as the 'flattening property'. The issue is that longer RSI periods result in a flat...