Check Mark pattern
This professional-grade solution for MetaTrader 4 helps traders achieve greater efficiency in their daily workflow. This technical indicator acts as a specialized analysis tool designed to visualize market data. It helps traders identify emerging trends, momentum shifts, and key support or resistance levels by plotting statistical calculations directly onto price charts.
How to Setup and Use Check Mark pattern
1. Installation: Place your file in the MQL/Indicators folder via "Open Data Folder" and restart your terminal.
2. Loading: Find the indicator in the Navigator, drag it onto your chart, and configure the input parameters in the popup window.
3. Customization: Press Ctrl+I to open the indicator list, select your tool, and click "Properties" to change colors, levels, or visual styles.
4. Updating: Replace the old file in the Indicators folder with the new version and restart the platform to apply changes.
Frequently Asked Questions
Q: Why is my indicator not showing? A: Verify the file is in the MQL/Indicators folder, or try right-clicking the "Indicators" tree in the Navigator and clicking "Refresh."
Q: Do custom indicators slow down the platform? A: Too many complex indicators can impact performance; remove unused ones via the "Indicator List" (Ctrl+I).
Q: Can I use MT4 indicators on MT5? A: No, MQL4 and MQL5 are distinct languages; ensure the indicator is compiled specifically for your platform version.
Description & Settings
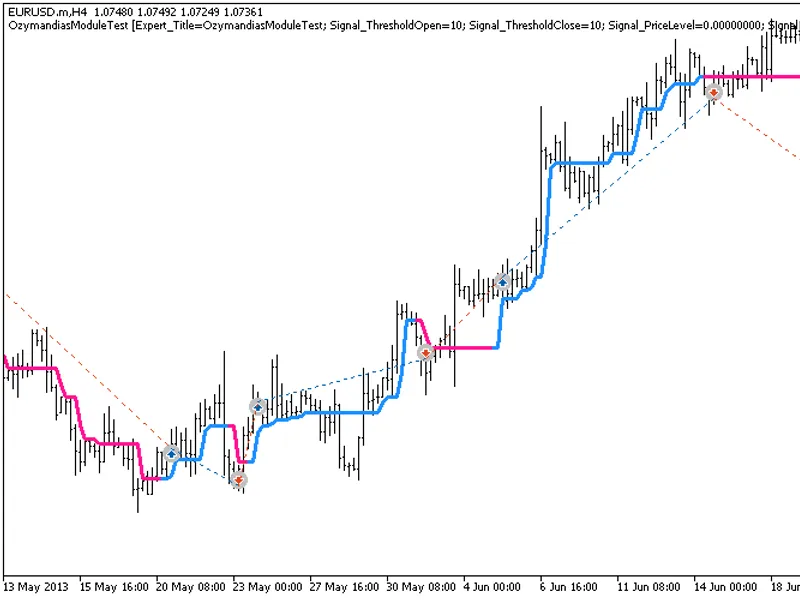
Purpose of the pattern - predict the type of the next candle: bullish or bearish. It has no further effect.
The "CheckMark" pattern is plotted the same way as the , which means that a price chart alone is not enough for finding it. An additional indicator is also required. This task is performed best by various oscillators.
Formation of the pattern involves three last bars. It is necessary to connect the Close prices of bars by lines, and on the oscillator chart — simply highlight three last vales. If "checkmarks" are obtained from both charts and they have different vertical orientation, then the "CheckMark" pattern is found. The local minimum on the oscillator chart is a bullish pattern (blue), the local maximum is bearish (red).
The indicator has been described in more details in the article .