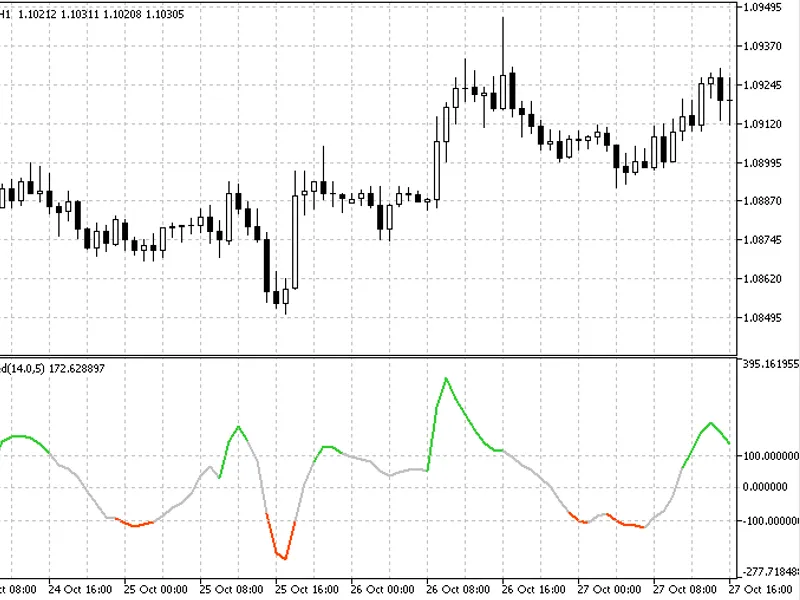
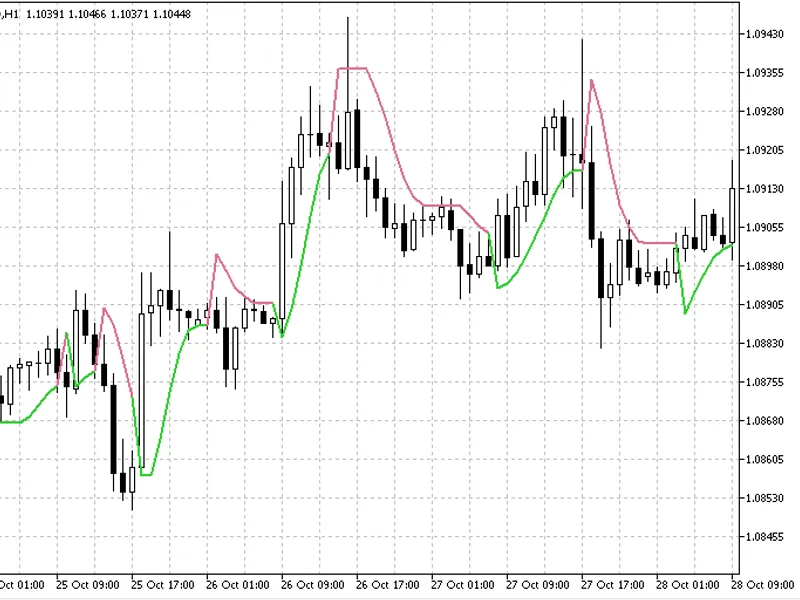
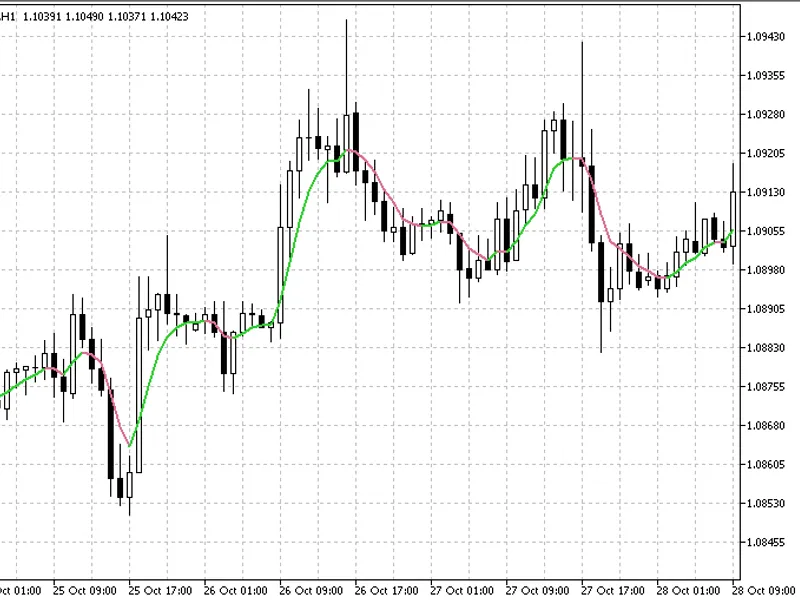
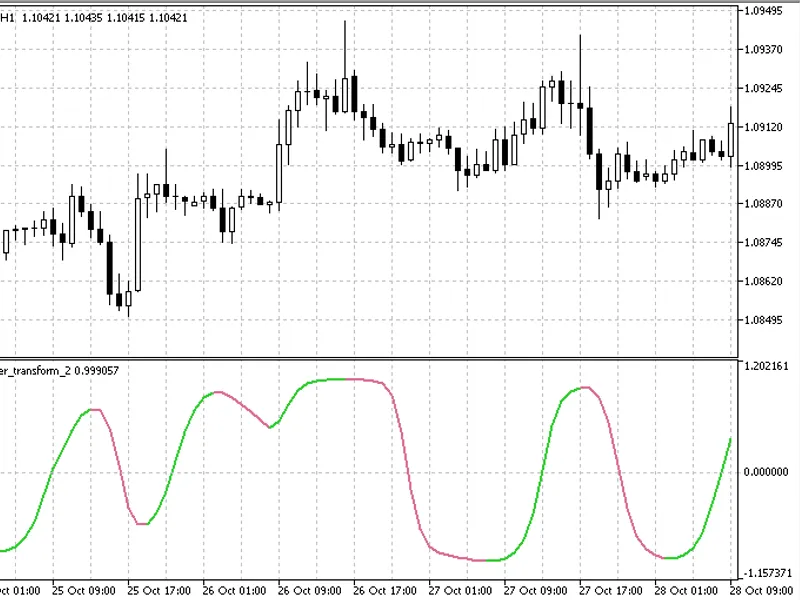
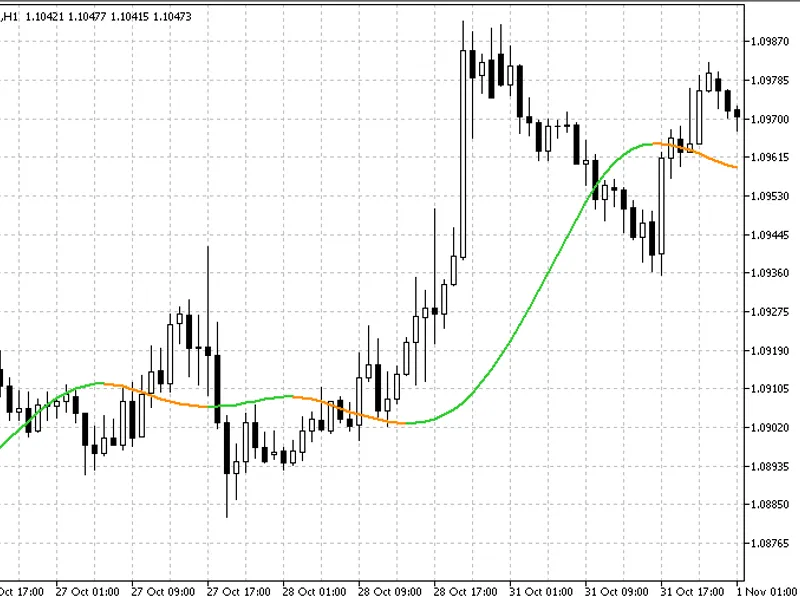
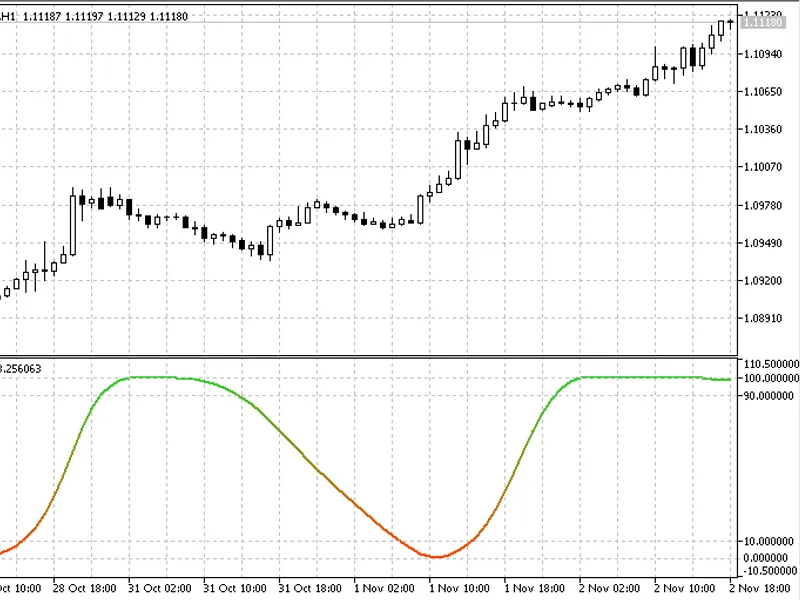
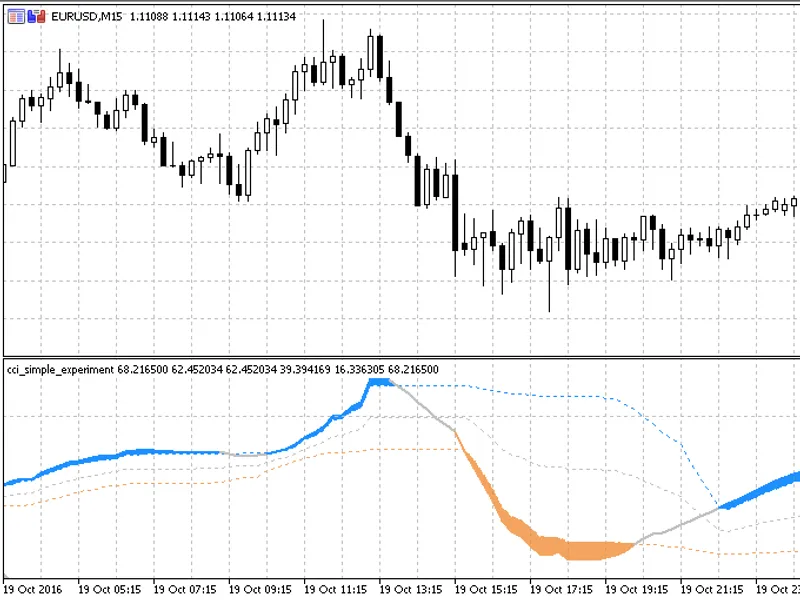
The CCI (Commodity Channel Index) is a valuable indicator, but its sensitivity to sudden price changes can limit its effectiveness. Traditional smoothing methods often diminish the...
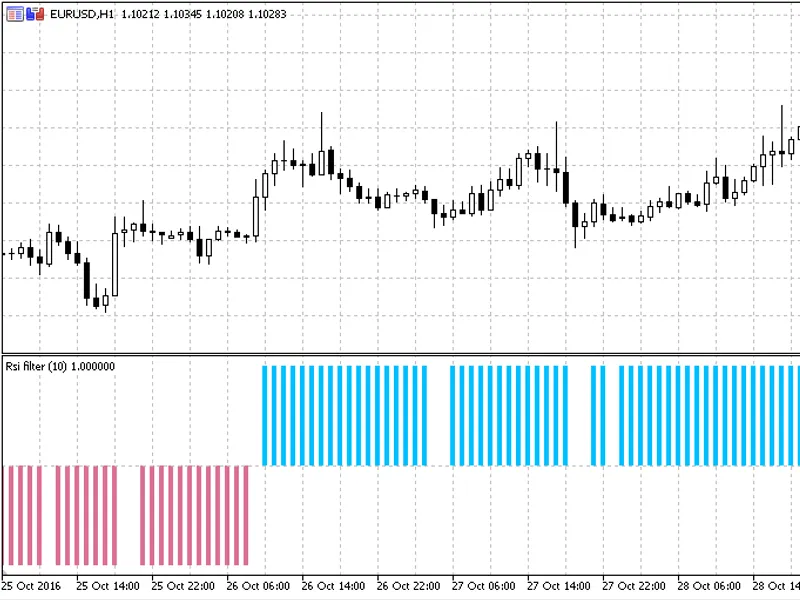
This RSI indicator is designed to function as a filter, analyzing RSI states by comparing them to the levels of 30 and 70. Based on the breaches of these levels, the indicator plot...
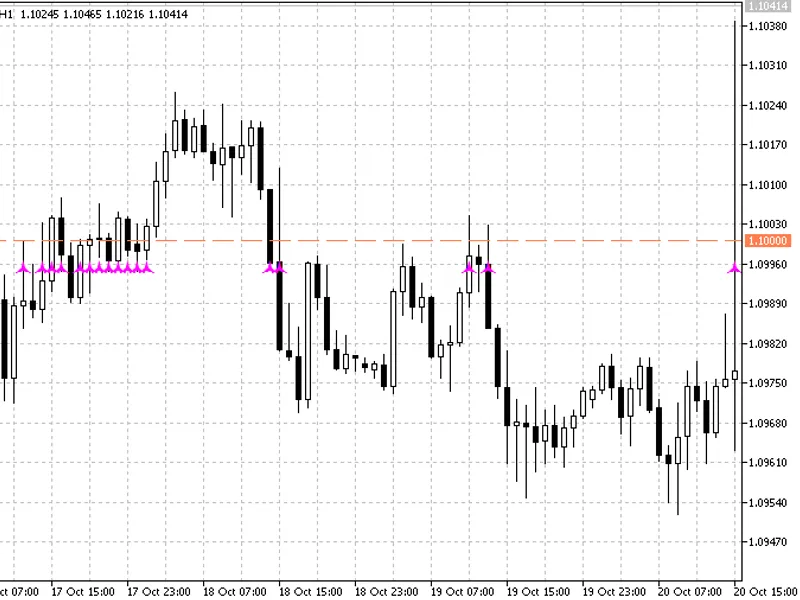
This indicator allows you to draw equidistant horizontal lines on your chart.To use this tool, you must specify the maximum and minimum prices. The indicator will then generate eve...
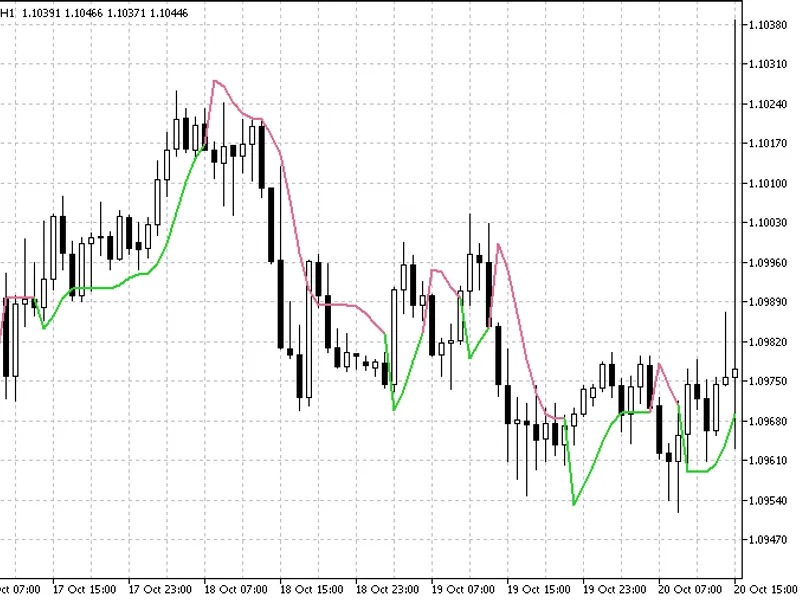
This indicator is a variation of the popular Super Trend, utilizing the Hull Moving Average (HMA) for its calculations.The Super Trend Hull Indicator offers a unique approach to tr...
This indicator is a variation of the Super Trend, incorporating 18 different averages for calculation.The Super Trend is a popular tool for trend identification and trade managemen...
This is a Gaussian filter designed for MetaTrader 5, offering enhanced functionality beyond the typical 4-pole limit.The filter can handle higher-order poles, up to 15, although pr...
This indicator offers an Ehlers Inverse Fisher Transform with various RSI calculation options. The RSI variations include:- RSI (Wilder's RSI)- RSX (Cuttler's RSI)Each RSI type pro...
The Multi-Pass Averages indicator for MetaTrader 5 offers a versatile approach to moving averages, providing 16 types of averages beyond the standard LWMA.This indicator is an expa...
This indicator provides a visual countdown to the end of the current candle. It allows you to customize the display by selecting the color and font size of your choice.With this to...
This indicator displays customizable vertical and horizontal lines, offering a versatile tool for various trading strategies.The indicator's key features include:- Entry levels ind...
This indicator highlights the opening and closing times of major trading sessions on the chart.Features:- Asian session: Orange- European session: Blue- American session: GreenThe ...
This indicator is a modified RSI that incorporates directional movement, filtering, and Parabolic SAR to estimate trend changes. It provides a more nuanced view of market trends by...
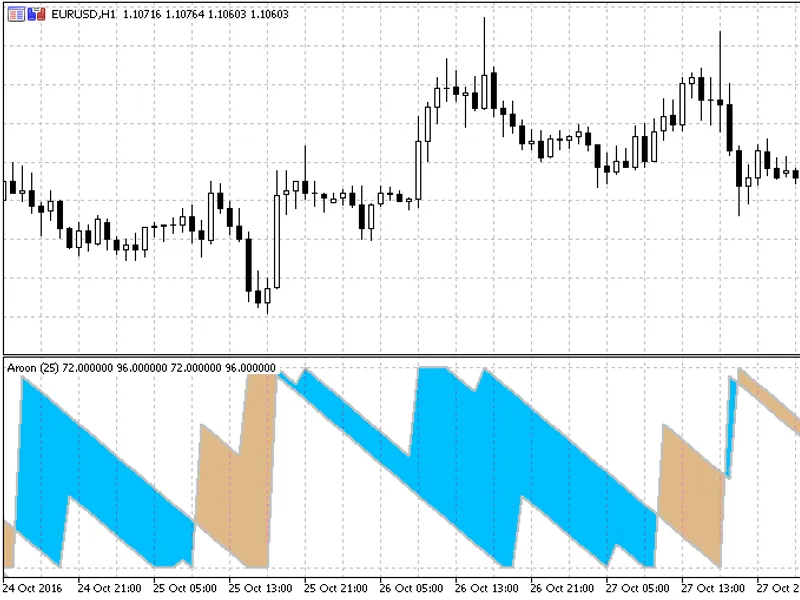
The Aroon Oscillator is a powerful tool for trend identification and reversal detection. It is presented as a straightforward line, with color-coded trend changes for easy visualiz...
This indicator calculates the absolute strength of averages, utilizing up to 18 types of averages in its calculation.Signal lines are included to provide early warnings of bull and...
The challenge of calculating the angle of an average in time series data is often overlooked. The issue arises due to the different data types on the x and y axes. As these axes re...
This is a 5-indicator package named 'Rapid RS I'. It offers a comprehensive solution for traders, ensuring reliable functionality within the MetaTrader platform. Adhering to the st...
This indicator is an adaptive version of the T3, utilizing standard deviations and featuring gradient colors. The gradient effect can be disabled by setting the starting and ending...
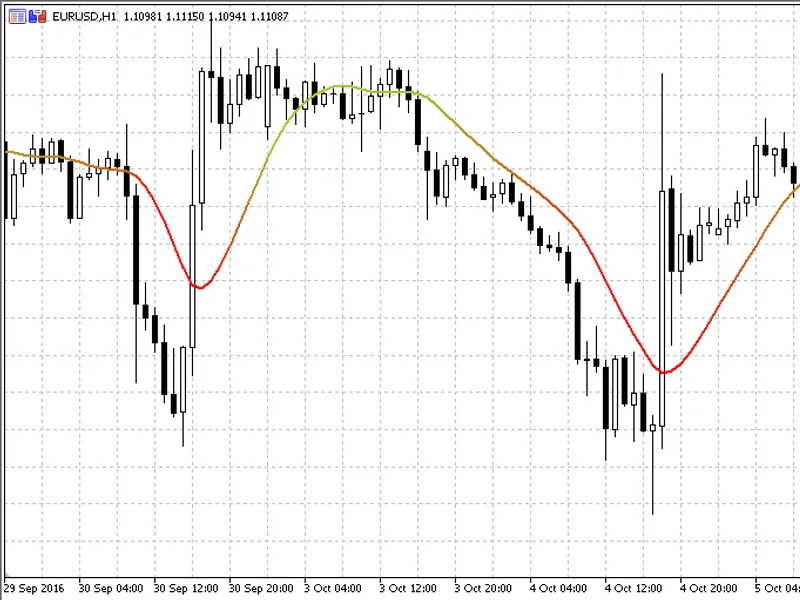
This is the Super Smoother of prices. The only parameter that can be adjusted is the price used in the Super Smoother calculation. It can serve as an effective filter for price pre...
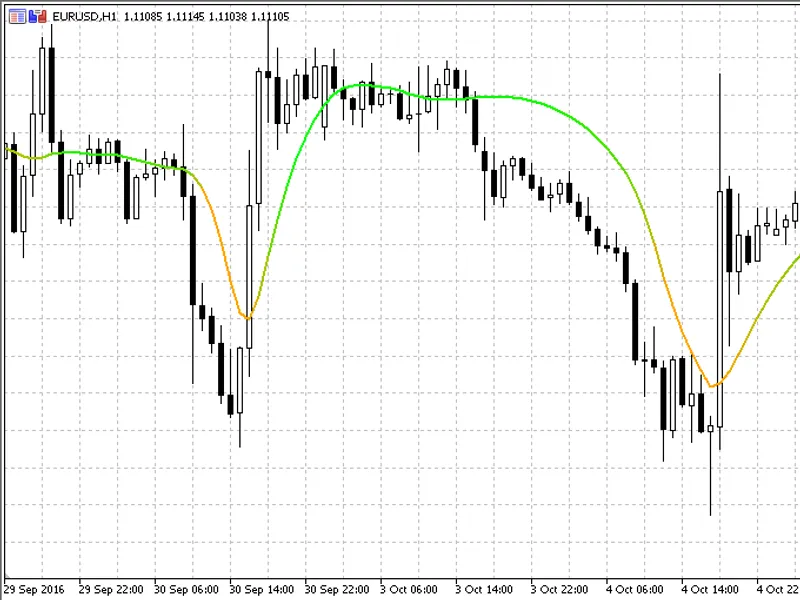
This indicator is part of a series of experiments with a variable-length super smoother. Here, the adaptive super smoother is applied to price pre-filtering before calculating a st...
This indicator provides a customizable Hull Moving Average (HMA) with adjustable weights for calculation.The 'Hull Power' parameter offers fine-tuning of the HMA. When set to 1, it...
This indicator is a variation of the Stochastic Oscillator, providing a clearer view of the trend.It offers an additional criterion for identifying trend formations....
This is a comprehensive indicator named 'Adaptive Smoother', offering a reliable and user-friendly experience for traders within the MetaTrader platform. It adheres to the standard...
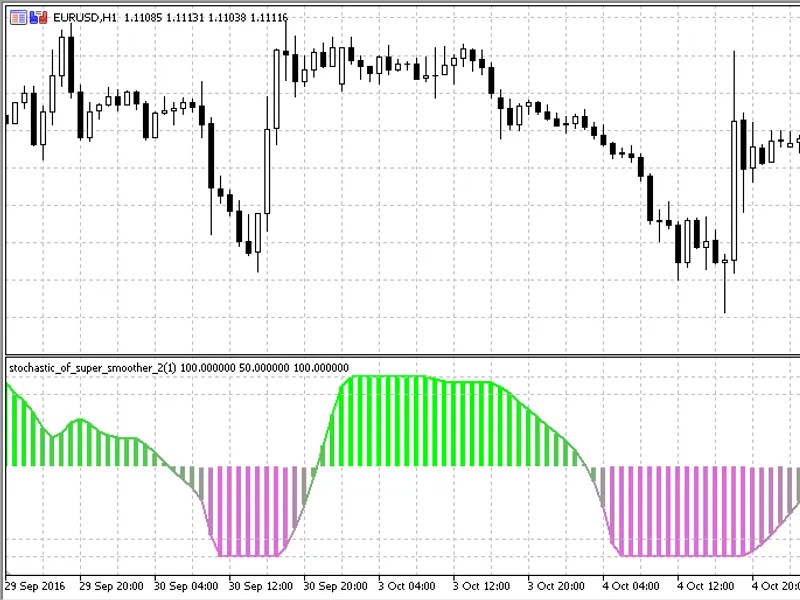
This indicator employs an adaptive approach to stochastic smoothing, utilizing standard deviations to filter prices. The adaptive mechanism adjusts to price changes, ensuring a rap...
A stochastic indicator that uses RSX as input for calculations.This indicator enhances the extremes of any value it is applied to, utilizing a 'smoother RSI' (RSX is a smoother RSI...
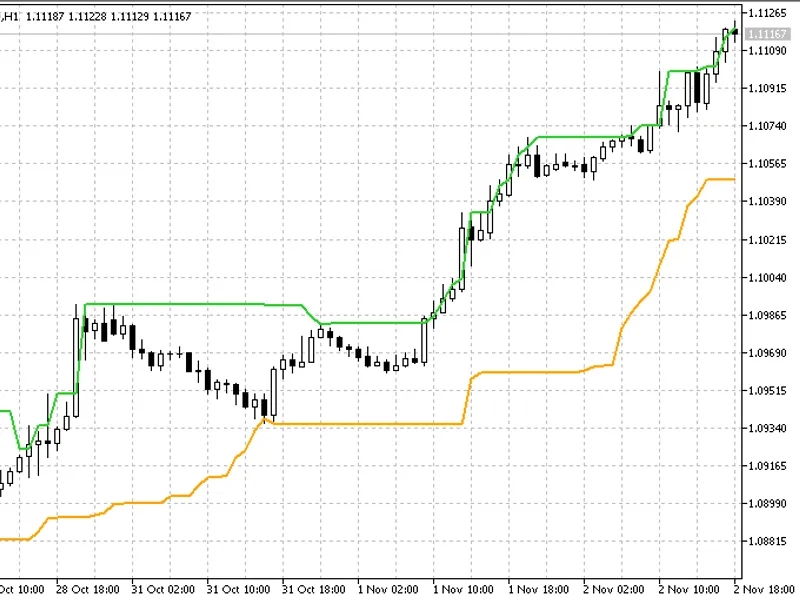
The Donchian Channel is a popular indicator in market trading, offering a unique approach to analyzing price movements.This indicator is constructed by identifying the highest high...
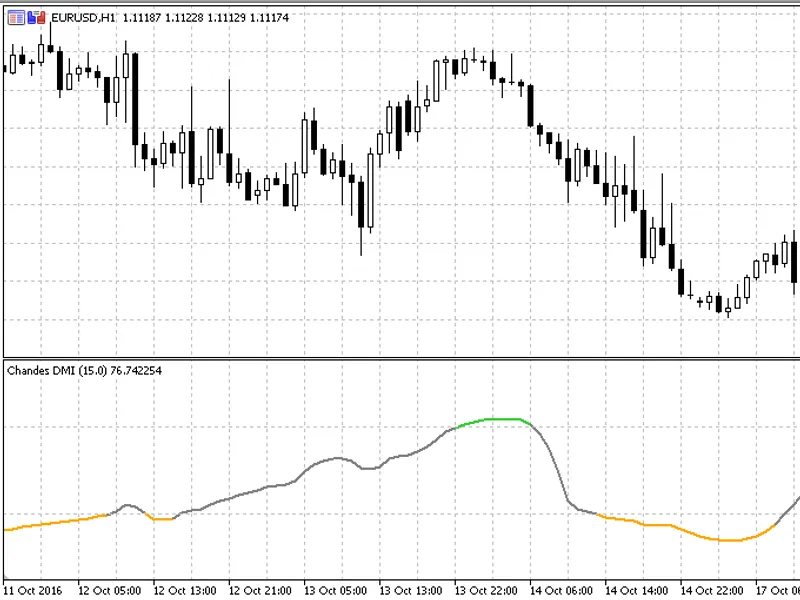
Definition of Dynamic Momentum IndexThe Dynamic Momentum Index (DMI) is an indicator utilized in technical analysis to identify overbought and oversold conditions for an asset. It ...
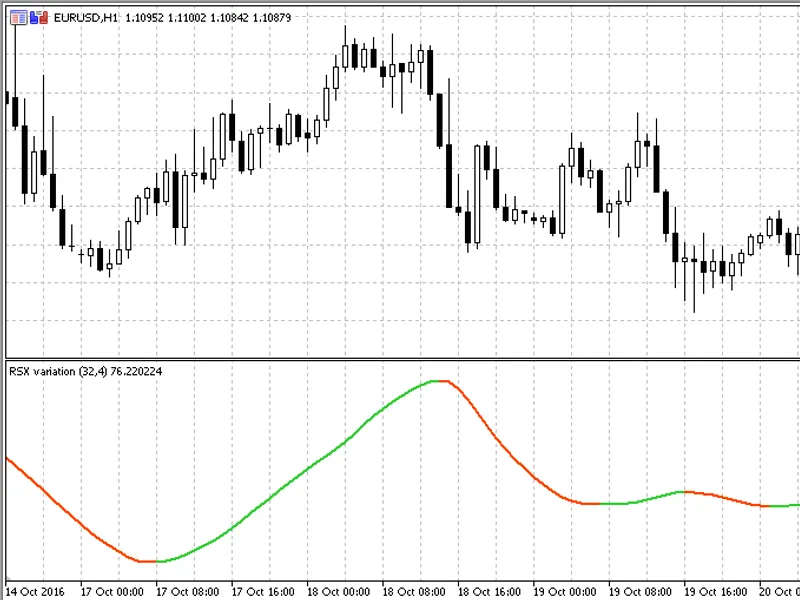
RSX is often referred to as a 'smoother RSI', which is an accurate description in many instances.This indicator is a valuable tool for traders, offering insights into market trends...
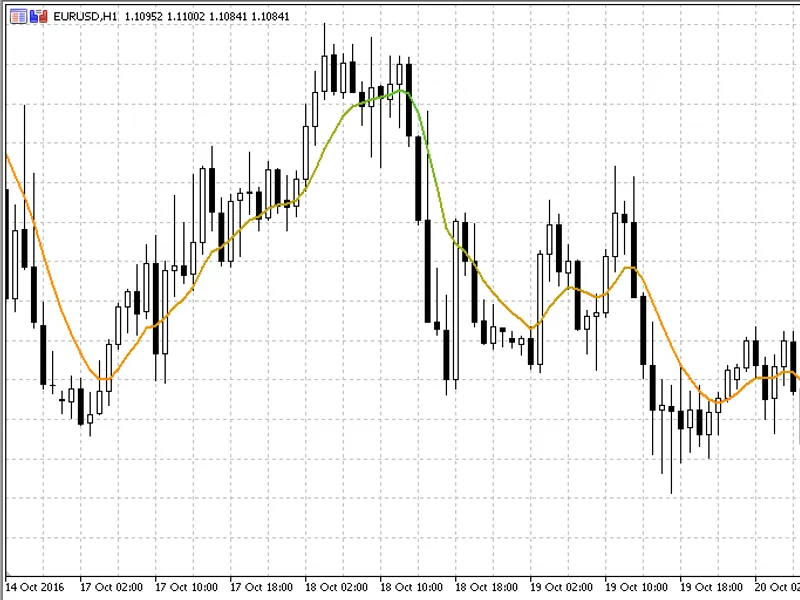
This is the double smoothed EMA. Its name is similar to the Double EMA (DEMA), but it is calculated differently, making it a variation of DEMA. The Double Smooth EMA is faster than...
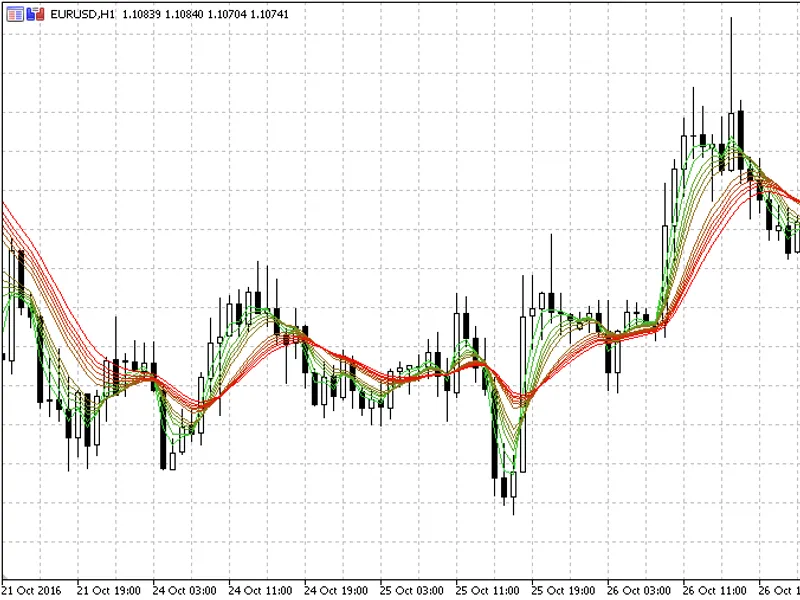
The Guppy Multiple Moving Average (GMMA) is a powerful technical analysis tool that enhances trend analysis and trading strategy selection. It utilizes two sets of moving averages ...
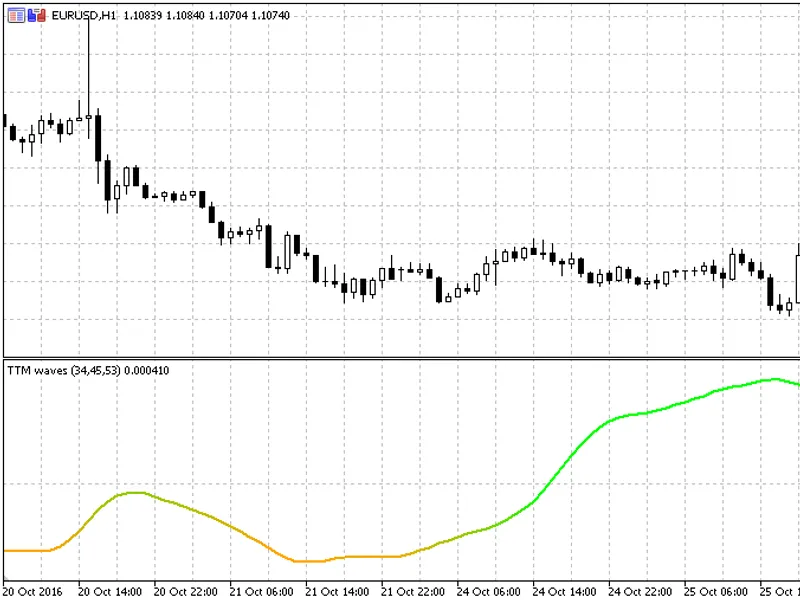
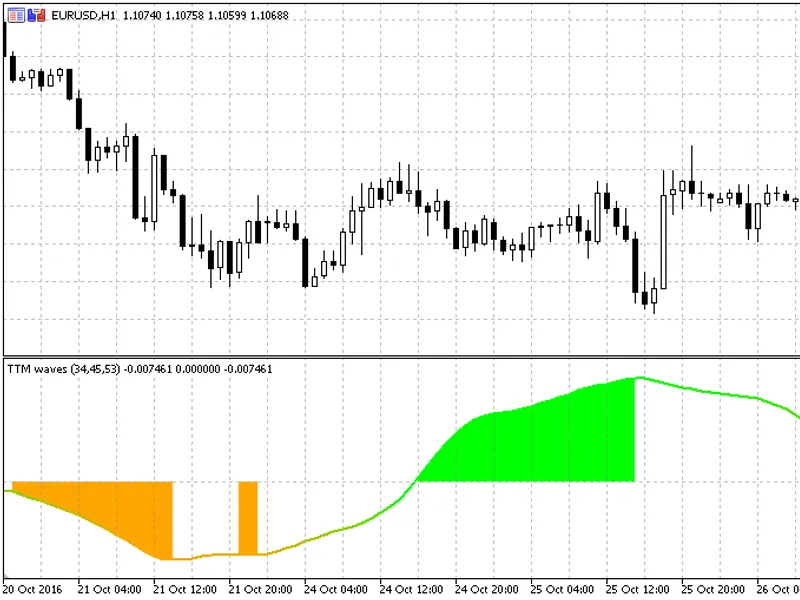
The TTM Waves Indicator is a powerful tool for traders, offering a comprehensive set of parameters to customize your trading experience.Here are the parameters for each wave:TTM Wa...
This is a 5-indicator suite named 'TT M Waves, 2.0'. It offers traders a reliable toolset within the MetaTrader ecosystem. The indicators adhere to the standard MT4/MT5 framework, ...
This is a 5-indicator package named 'RS i of MA C D Double'. It offers traders a reliable set of tools within the MetaTrader platform. The indicators adhere to the standard MT4/MT5...
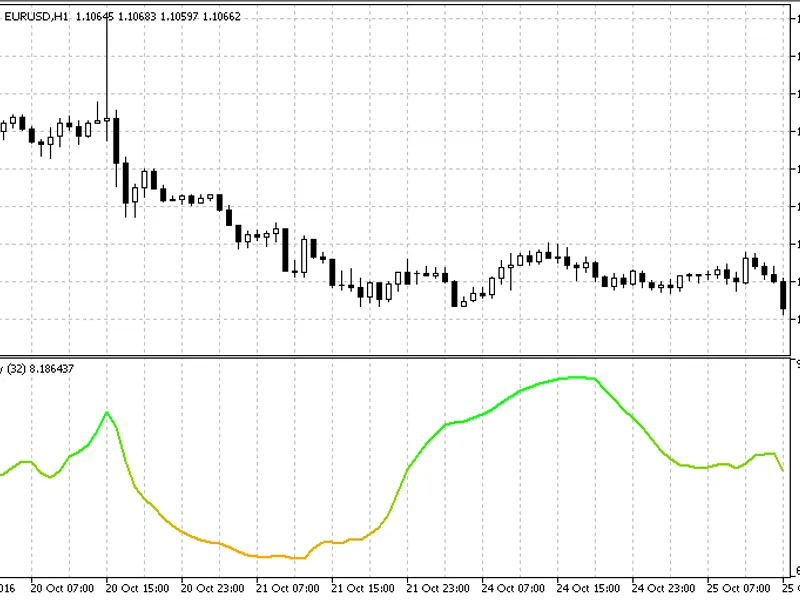
This indicator displays normalized velocity, typically using gradient coloring by default.To customize the coloring:- Set color steps to less than 2 to disable gradient coloring.- ...
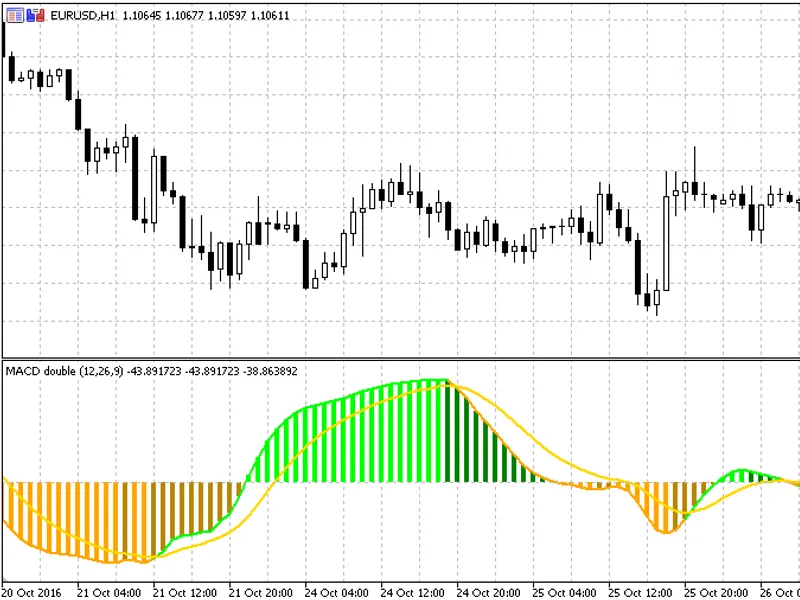
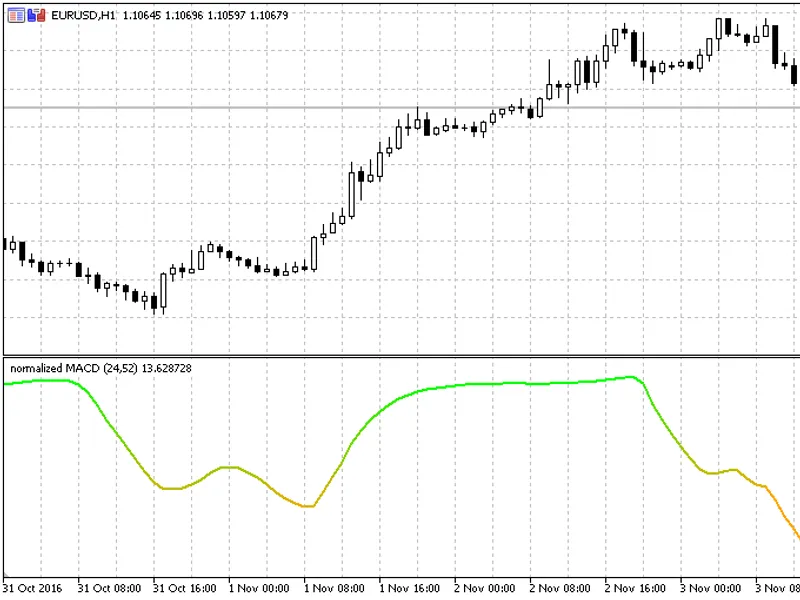
As useful as MACD is, it may lack a crucial element: bounds.This indicator is typically used to identify trends and potential reversals by measuring the relationship between two mo...
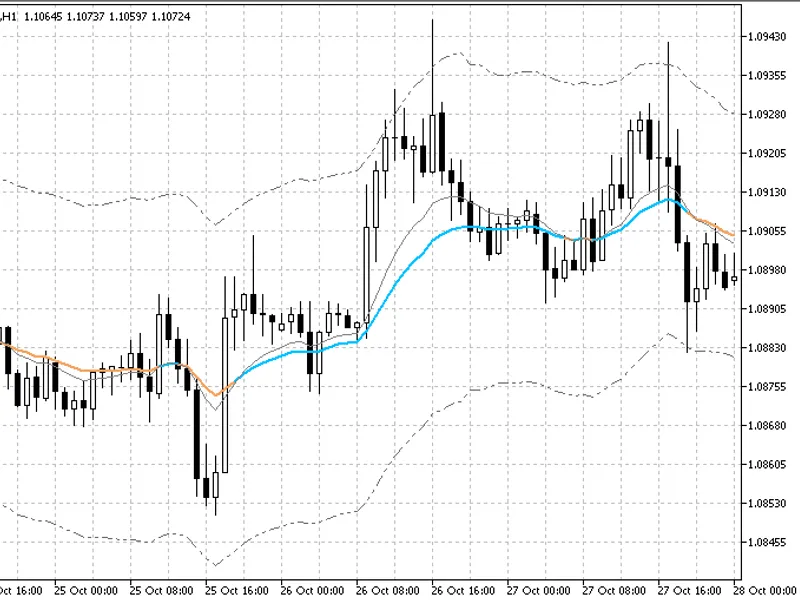
Envelope or channel lines are set parallel to the moving average. The two channel lines should contain approximately 95% of all prices for the past two to three months on a daily c...
The Aroon indicator is a powerful tool for traders, offering insights into market trends and potential reversals. It consists of two key components:- Aroon Up: This line assesses t...
This is a 5-indicator tool named 'Aroon On Chart'. Designed for MetaTrader 4/5, it offers reliable functionality, adhering to standard conventions. Easy to install, it caters to bo...
This indicator, named 'Aroon Oscillator on Chart', is a valuable tool for traders using the MetaTrader platform. It adheres to the standard conventions of MT4/MT5, ensuring a seaml...
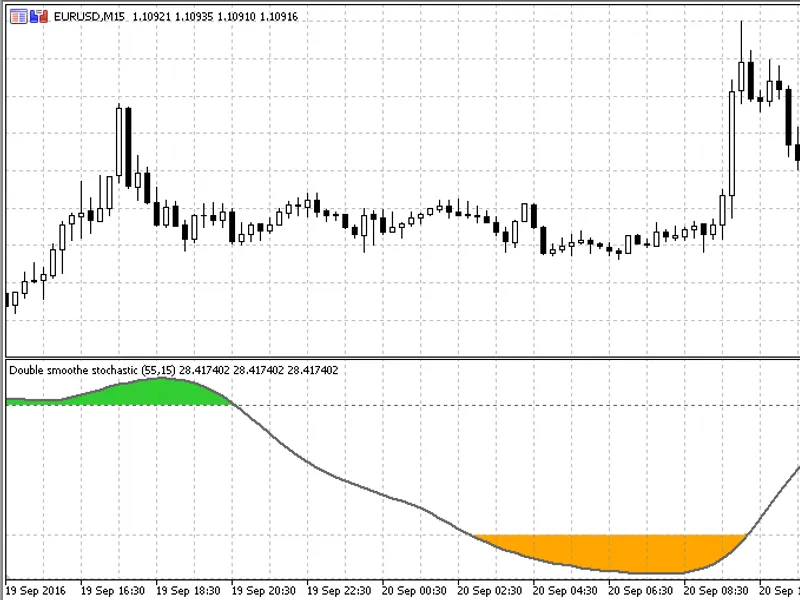
This indicator provides a double-smoothed stochastic with enhanced features for MetaTrader 4/5.It offers an extended selection of price types, including 20 different price options....
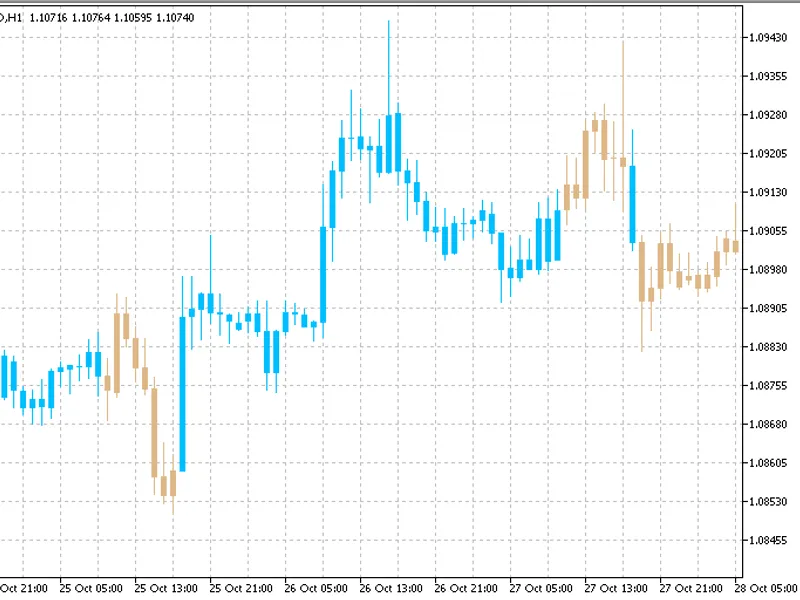
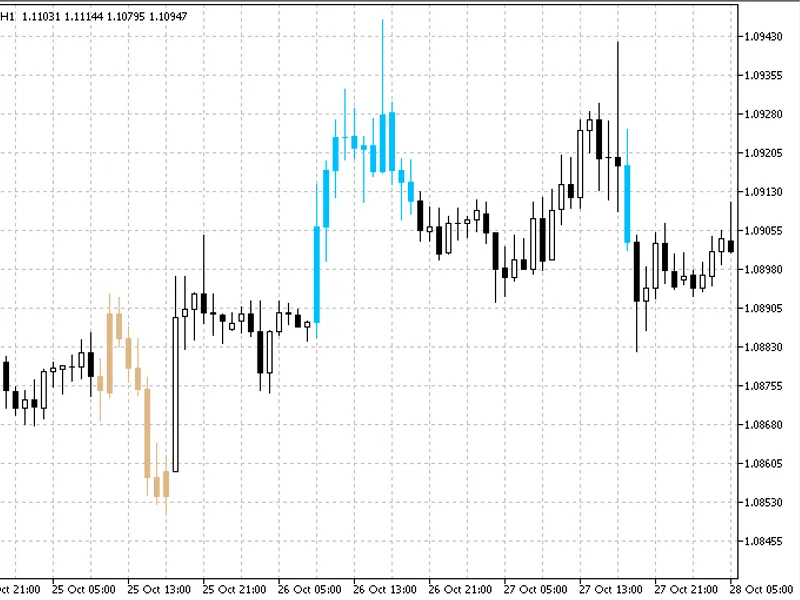
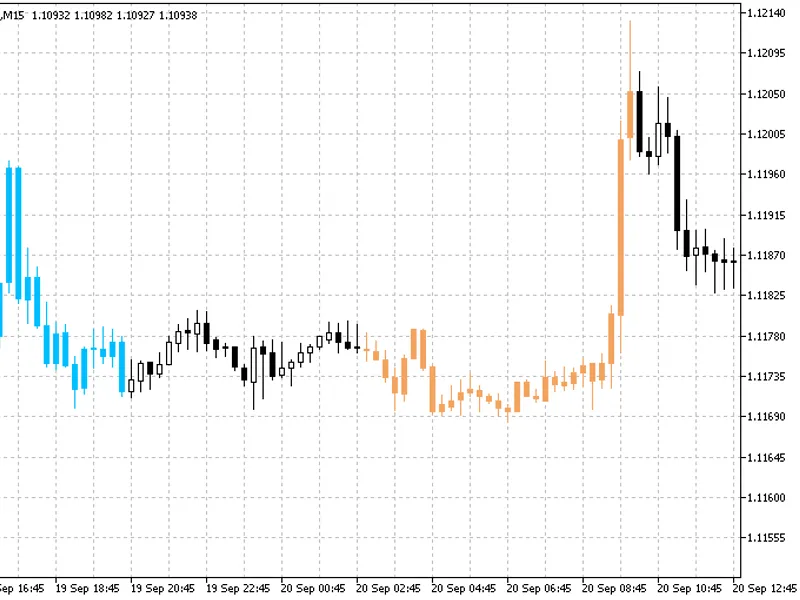
This is an on-chart indicator that displays the double smoothed stochastic values directly on the price chart. The indicator is based on the popular stochastic oscillator, which is...
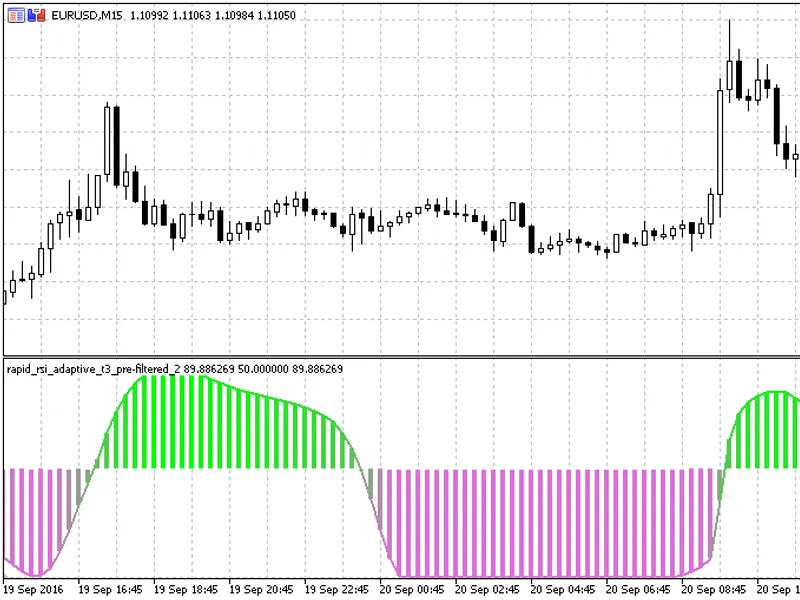
Rapid RSI, a variation of Cutler's RSI, is enhanced with adaptive calculation and T3 price pre-filtering for smoother results.Gradient colors are applied to aid visual analysis, ma...
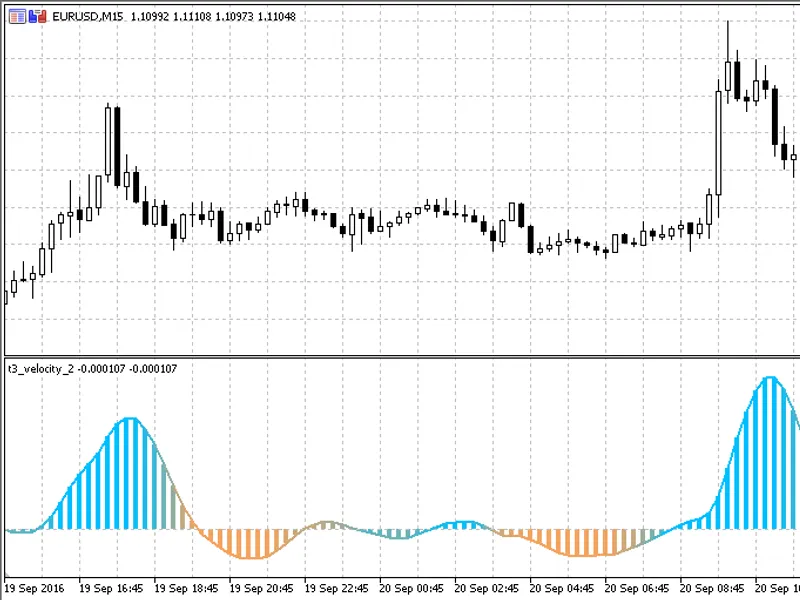
T3 Velocity is an innovative indicator that goes beyond traditional velocity smoothing. It utilizes the T3 technique to derive velocity, resulting in an exceptionally smooth moment...
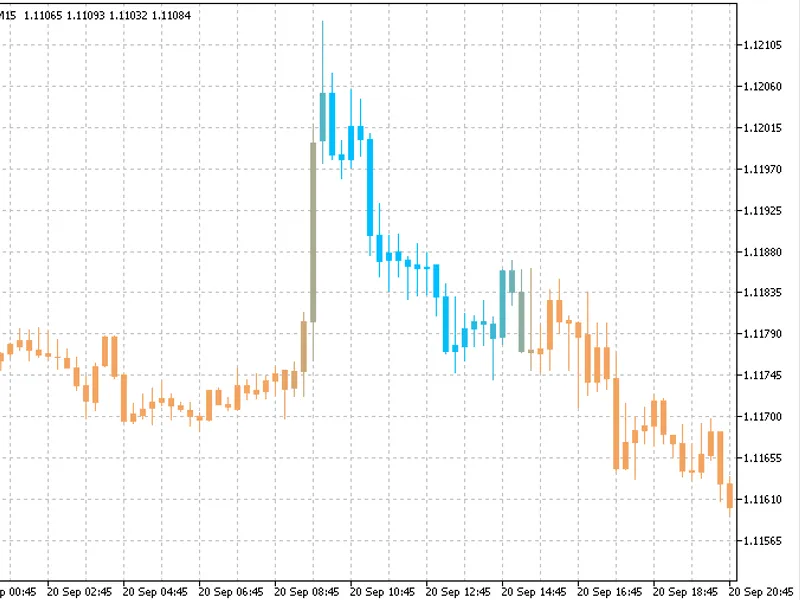
This indicator displays the T3 Velocity on the chart, offering a comprehensive view of its performance.A key feature is the gradient color scheme, which requires careful monitoring...
This comprehensive indicator suite, named 'RS I Experiment', offers a robust set of 5 tools tailored for MetaTrader 4/5 platforms. Designed with a user-friendly approach, it adhere...
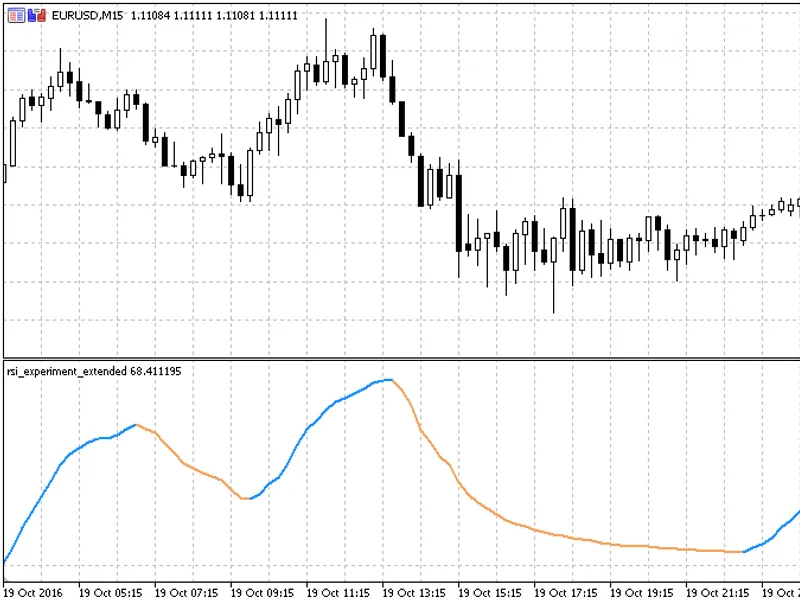
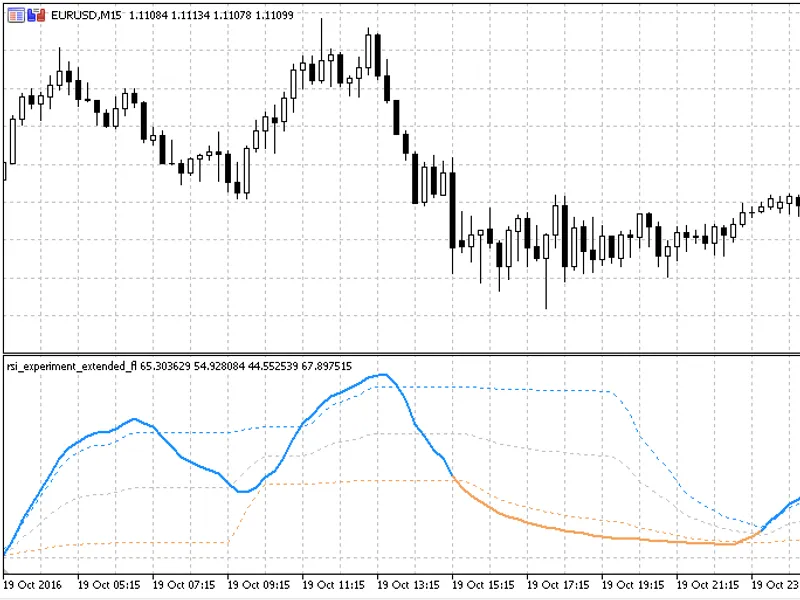
Experiment with floating levels for the Relative Strength Index (RSI).This experiment aims to explore the potential of using floating levels to enhance the RSI indicator's effectiv...
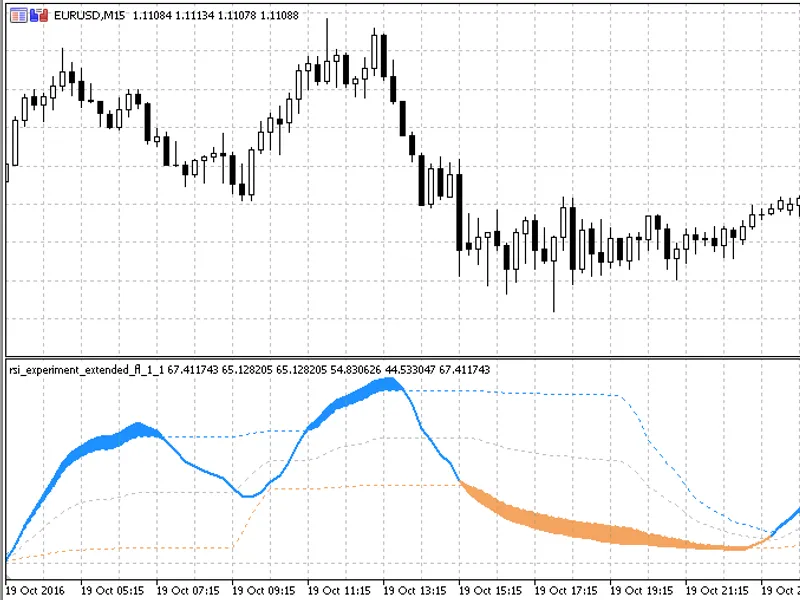
This indicator adds filled areas to your charts when floating levels are crossed.A simple yet effective way to visualize price movements and identify potential trends....
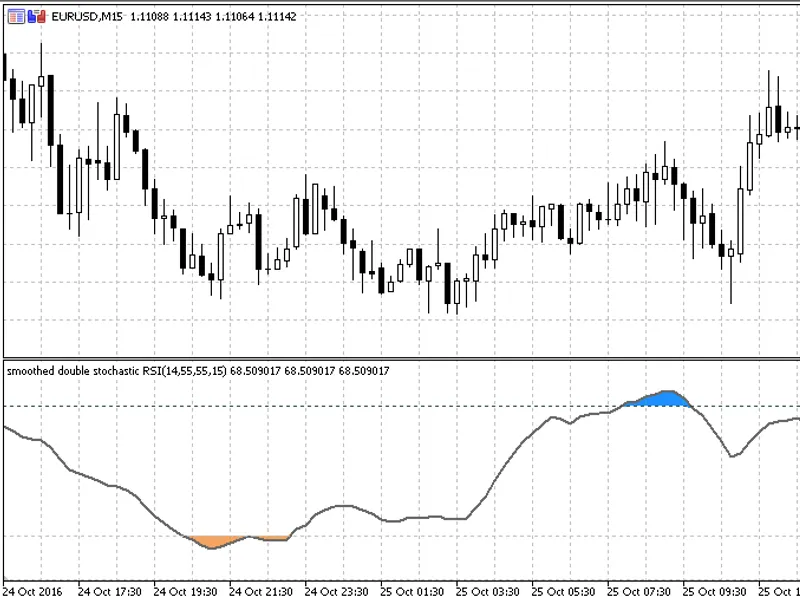
A double stochastic indicator based on the Relative Strength Index (RSI).This indicator can also function as a simple stochastic of RSI if one of the stochastic periods is set to a...