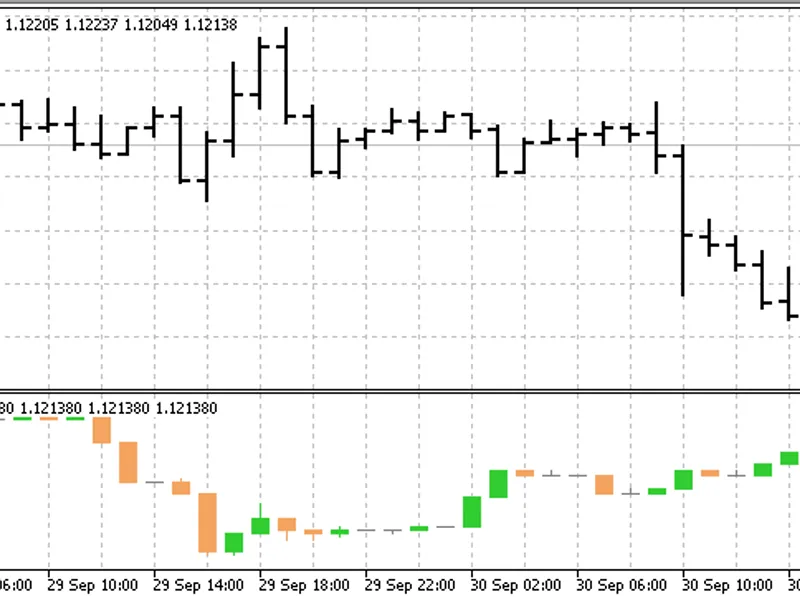
This indicator generates custom timeframe candles based on a specified time interval in seconds. Unlike traditional indicators, it operates independently of bars or ticks, ensuring...
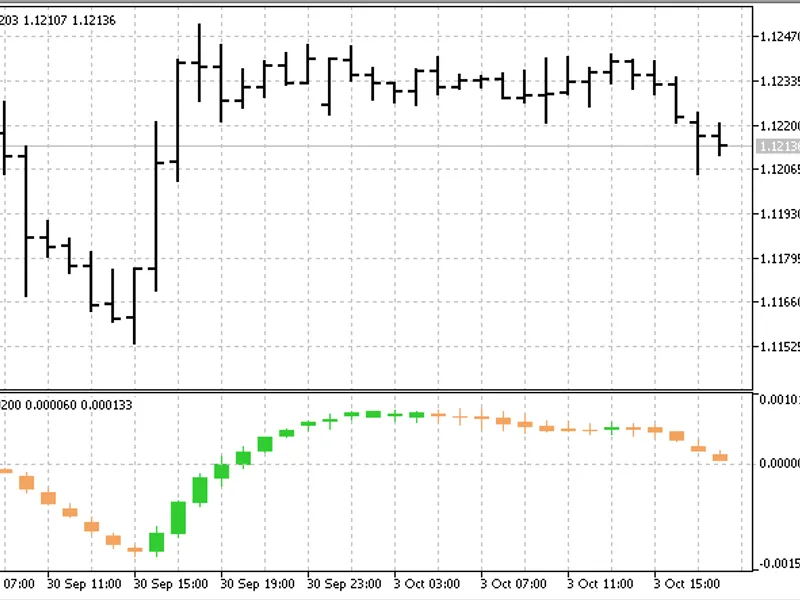
This indicator calculates four MACD values (of open, close, high, and low) and constructs MACD candles from these values.The color of the candles and the trend they indicate depend...
This indicator automatically identifies the minimum and maximum values within a specified period and draws Fibonacci zones between these bounds. The highest high and lowest low of ...
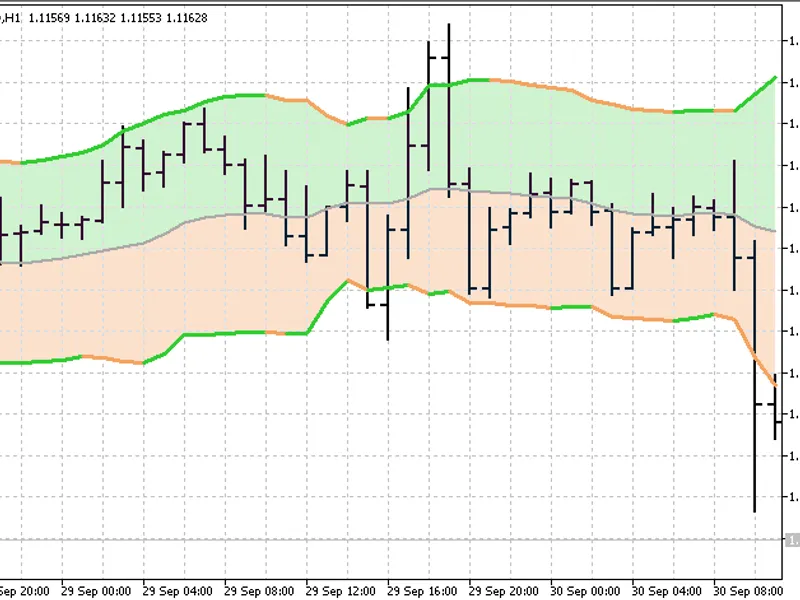
This indicator offers Bollinger Bands with a unique feature: the ability to choose between two deviation types.While the difference may seem minor, it provides valuable flexibility...
This indicator provides a basic introduction to quantiles and their application in technical analysis.The Quantile Bands indicator constructs bands using three quantile values, off...
This indicator alerts you when a new bar forms on the chart. It offers customizable alerts through text, sound, and email notifications.You can configure the alert settings to suit...
This indicator is a powerful tool for traders, providing a clear visual representation of market trends and potential turning points.It calculates and displays fast and slow moving...
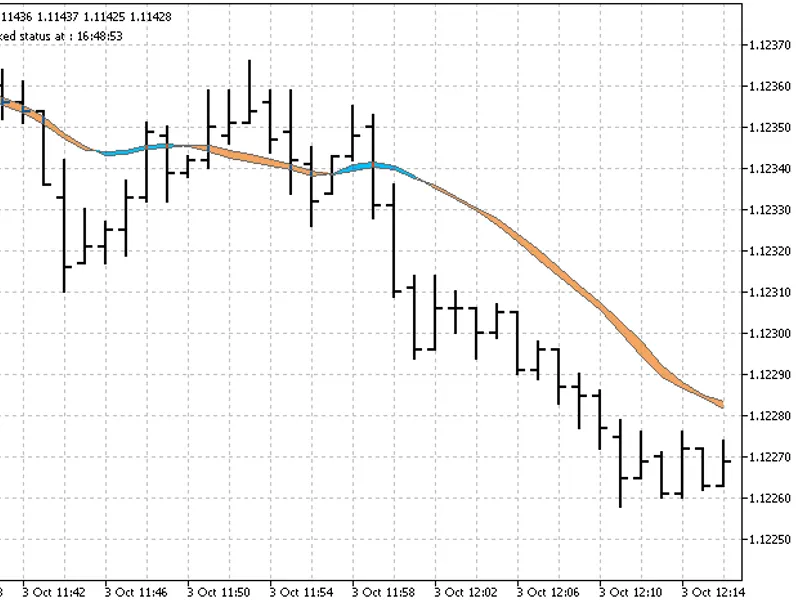
This indicator displays candles based on four moving averages: the average of open, close, high, and low prices. It includes four types of moving averages: simple, smoothed, linear...
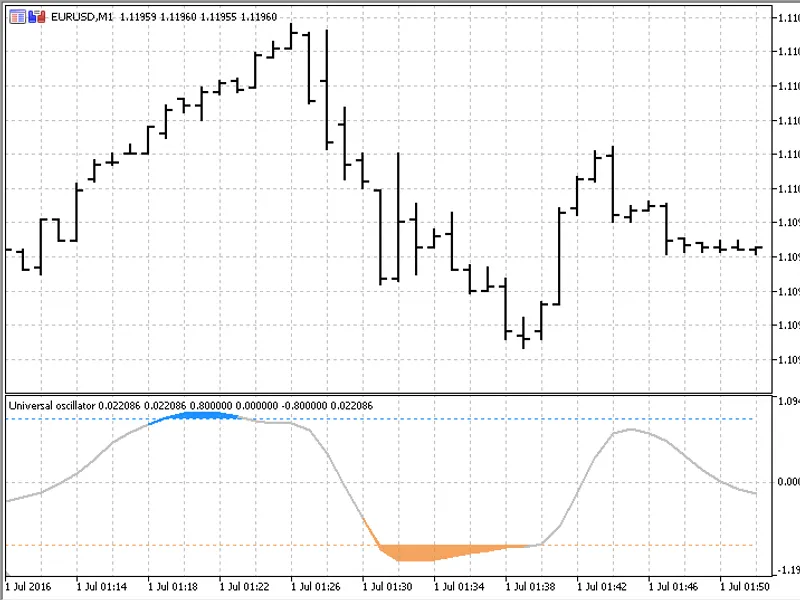
This oscillator is an enhanced version of the Relative Strength Index (RSI) with a customizable color scheme for overbought and oversold areas.Input Parameters:- Period for Oscilla...
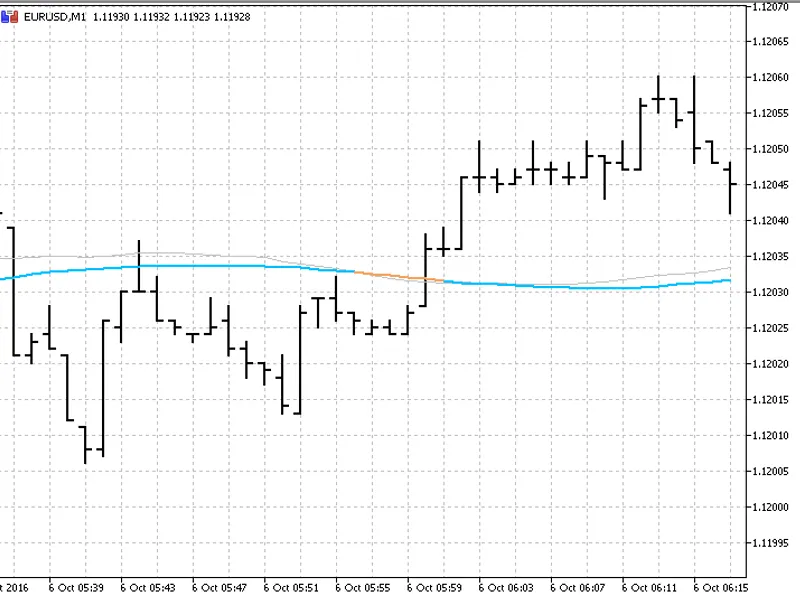
This is the 'Middle-High-Low Moving Average' indicator, which is a correlation of two averages. It is not a single average but a combination of two averages: a regular average and ...
RSI with the option of price smoothing prior to RSI calculation, enabling additional signal filtering.The input parameters include the RSI calculation period and the method for det...
The ALMA (Arnaud Legoux Moving Average) indicator is a powerful tool that smooths out price fluctuations and highlights trends by applying a moving average twice.This enhanced vers...
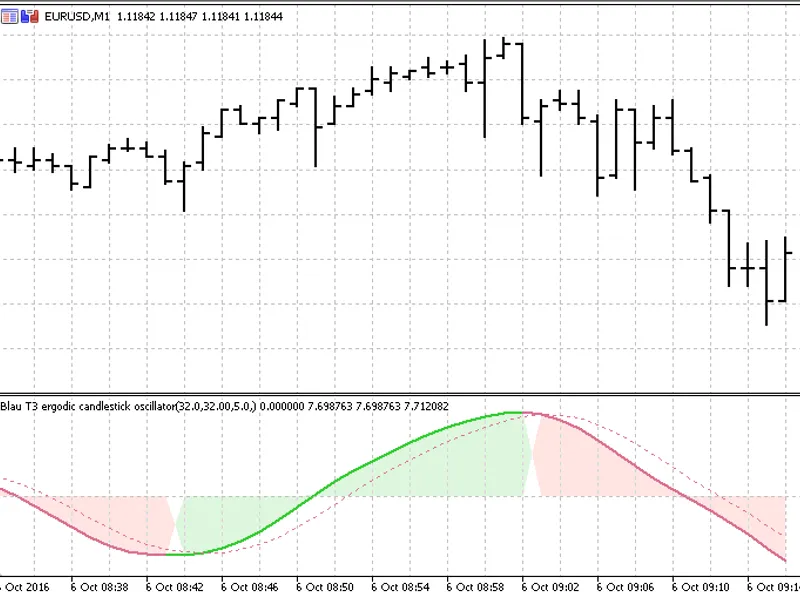
T3 Ergodic Candlestick Oscillator is a momentum indicator developed by W. Blau. It is designed to analyze candlestick patterns and provide insights into the size and direction of t...
This indicator provides an adaptive Laguerre filter with a comprehensive set of 20 price types.The Laguerre filter is a versatile tool for technical analysis, offering a range of o...
This indicator introduces modifications to the original concept by Linda Rashke. The original indicator uses only period 1 and exclusively employs EMA for calculations.The updated ...
A new oscillator has been developed to minimize computational lag, rejecting very low-frequency and high-frequency components to reduce noise. This modification introduces the 'cal...
The Fisher Transform Indicator is a powerful tool for analyzing market trends. Originally developed in 2026 by John Ehlers, this indicator has become a popular choice for traders.I...
The indicator with the timeframe selection option in the input parameters.This indicator requires the volume_weighted_ma_stdev.mq5 indicator file. Place it in \mql5\indicators.Fig....
This indicator fills the chart with a colored background, displaying the latest value as a price label. It allows for rounding channel levels to a specified number of digits, set v...
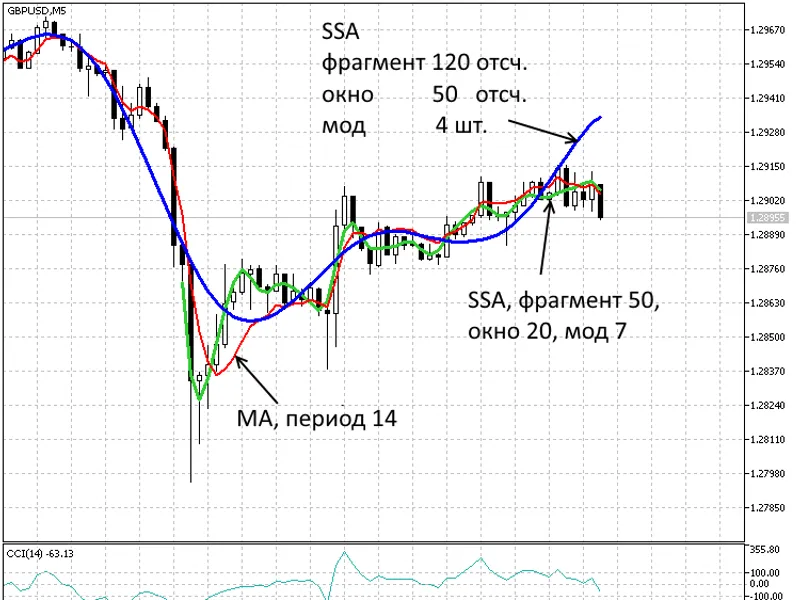
Extracting trend and filtering noises using Singular Spectrum Analysis (SSA). Adjusting the indicator parameters allows control over the smoothness of the extracted trend and noise...
The Fisher Oscillator Signal indicator is a powerful tool for trend analysis and trading signals.Based on the Fisher transform, this indicator identifies overbought and oversold co...
This indicator displays a sequence of candlesticks, each representing the result of processing relevant price time series through the Volume Weighted MA algorithm. This approach of...
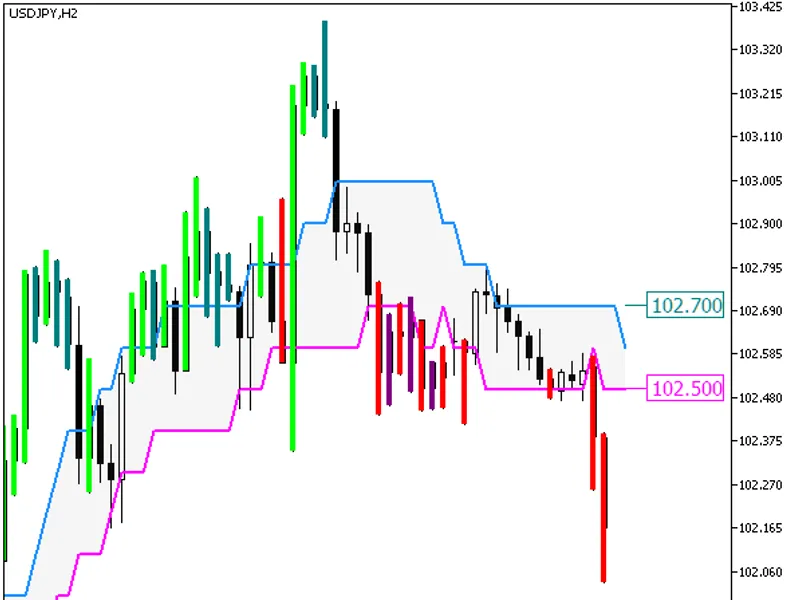
The indicator implements a breakout system using a channel based on the high and low price series processed by the algorithm.When the price exits the gray channel, the bar color ch...
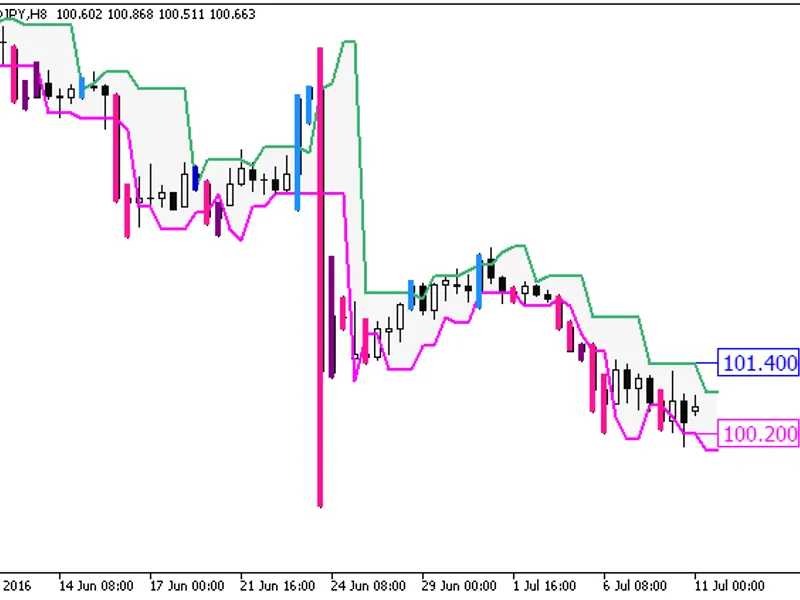
The indicator implements a breakout system using a channel based on the high and low price series processed by the algorithm.When the price exits the gray channel, the bar color ch...
Trendlaboratory Ltd. has introduced new input parameters and added three new functions to the indicator code: buysignal(), sellsignal(), and getstringtimeframe().The functions buys...
The Fisher Org HTF indicator offers a unique feature: the ability to select the timeframe directly from the input parameters.This indicator relies on the fisher_org_v1.mq5 file, wh...
The indicator with the timeframe selection option available in input parameters.The indicator requires ytg_price_peak.mq5 indicator file. Place it in \mql5\indicators.Fig.1. The yt...
The Darvas Boxes System HTF indicator offers a versatile timeframe selection feature in its input parameters.To utilize this indicator, ensure you have the darvasboxes_system.mq5 i...
This indicator implements a breakout system using the channel, allowing for the rounding of channel levels to a specified number of digits and displaying the latest breakout levels...
The Donchian Channels System indicator with a timeframe selection option in the input parameters.This indicator requires the Donchian_Channels_System.mq5 file. Place this file in \...
Indicator of intraday volatility with no lag.This tool suggests the trading area for intraday strategies by calculating the optimum time for trading when quotes are changing rapidl...
The PChannel System HTF indicator offers a unique feature: the ability to select the timeframe directly from the input parameters.To utilize this indicator, ensure you have the pch...
The indicator implements a breakout system using the channel, allowing for the rounding of channel levels to a specified number of digits and displaying the latest breakout levels ...
This indicator displays a vertical histogram of price distribution.The original version was written in MQL4 and published in 2026.Fig. 1: Price Distribution Indicator...
This indicator displays a vertical histogram with the distribution of extreme prices.Indicator Input Parameters:The original version of this indicator was written in MQL4 and publi...
A vertical histogram displaying the distribution of lows, this indicator provides valuable insights into price trends.The indicator's input parameters offer flexibility for customi...
This indicator displays a vertical histogram of high price distributions. It was originally written in MQL4 and published in 2026.The indicator's input parameters allow for customi...
This indicator has been updated with new input parameters and additional functionality.Three new functions have been added to the indicator code: buysignal(), sellsignal(), and get...
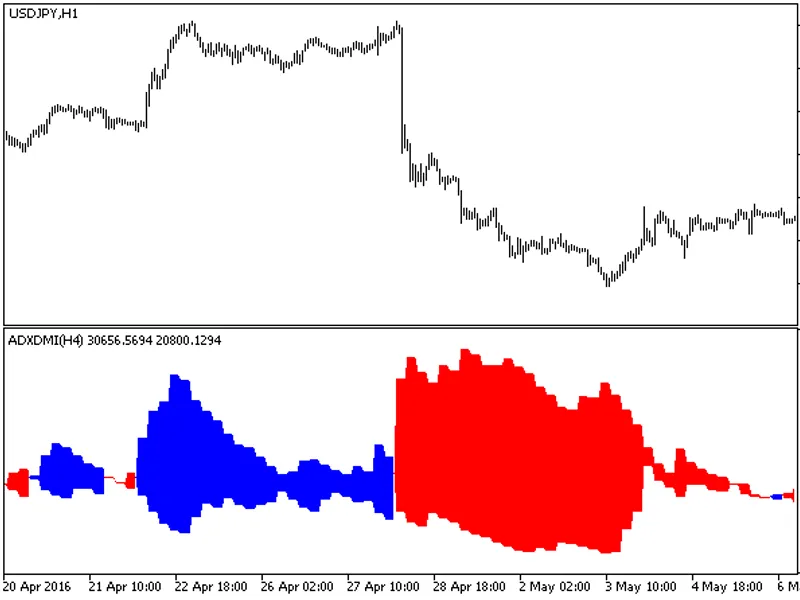
The indicator with the timeframe selection option available in the input parameters.The indicator requires the ADXDMI.mq5 indicator file. Place it in <terminal_data_folder>\m...
The CCI Histogram HTF indicator offers a timeframe selection feature in its input parameters.This indicator relies on the cci_histogram.mq5 file, which should be placed in the <...
The indicator displays the breakthrough line.It utilizes the SmoothAlgorithms.mqh library classes, which should be copied to \mql5\include. The use of these classes was explained i...
The automation of graphical constructions, such as channels, trends, and fibo grids, relies on identifying 'refined movements' in price data, i.e., tracking price changes from loca...
The indicator plots price channels and Fibonacci levels based on the latest zigzag peaks.Indicator Input Parameters:The indicator requires the compiled Zigzag_NK_Color.mq5 indicato...
The indicator with the timeframe selection option in the input parameters.This indicator requires the dtrend.mq5 indicator file. Place it in <terminal_data_folder>\mql5\indic...
The indicator with the timeframe selection option in the input parameters.The indicator requires the i-cai.mq5 indicator file. Place it in \mql5\indicators.Fig. 1. The i-cai_htf in...
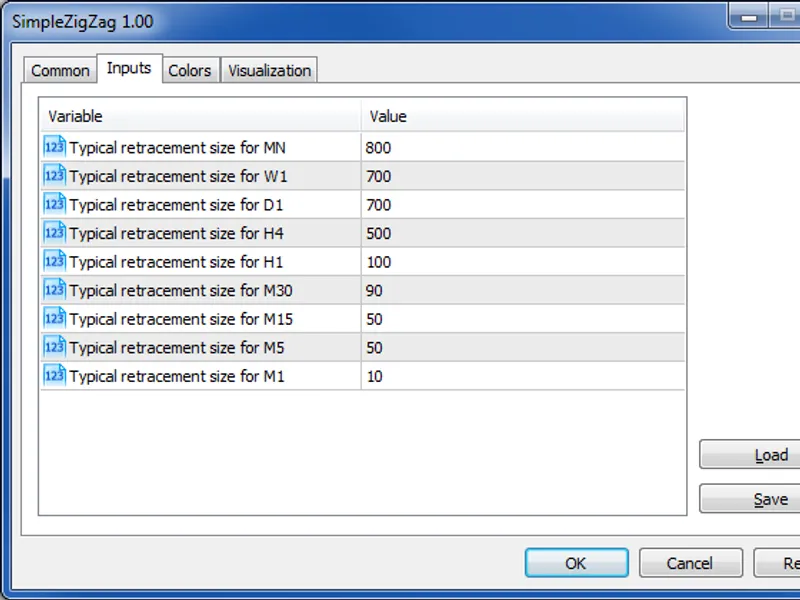
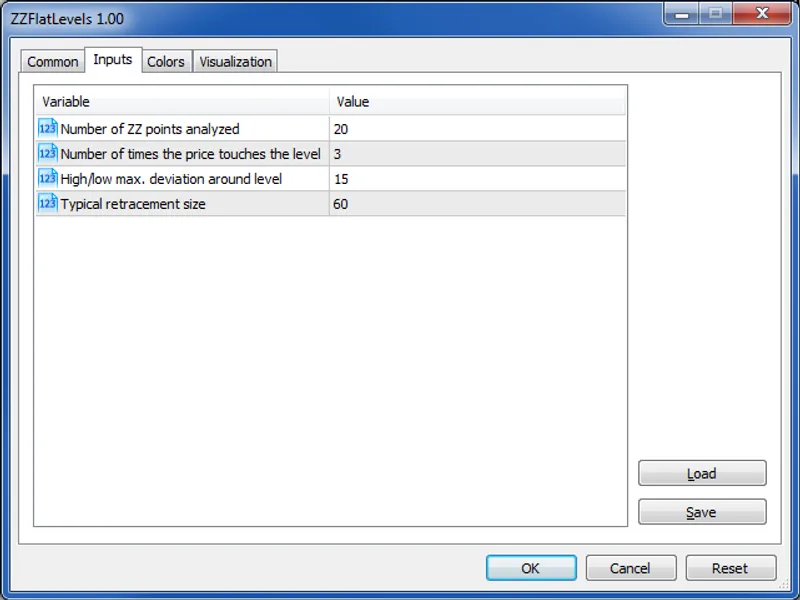
The Simple Zigzag indicator is a powerful tool for automating technical analysis. This indicator, named ZZLevels, builds upon the Simple Zigzag by identifying flat boundaries, supp...