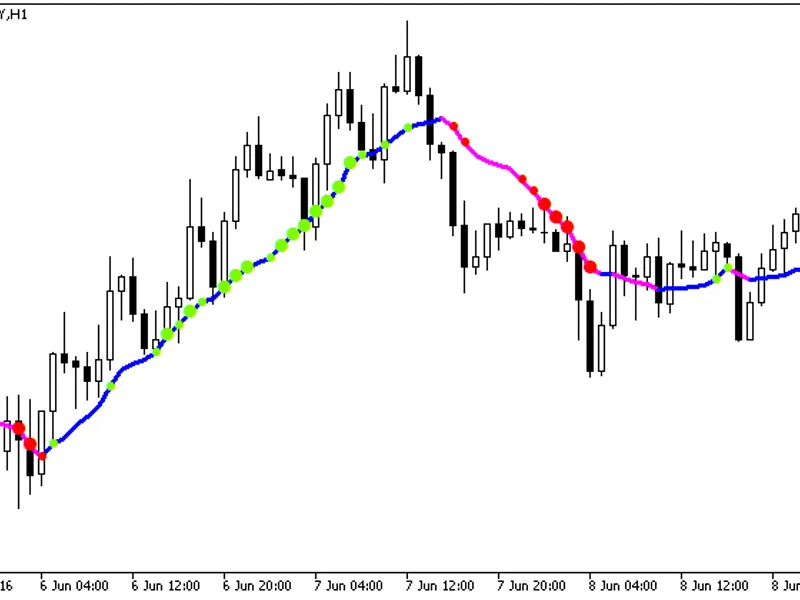
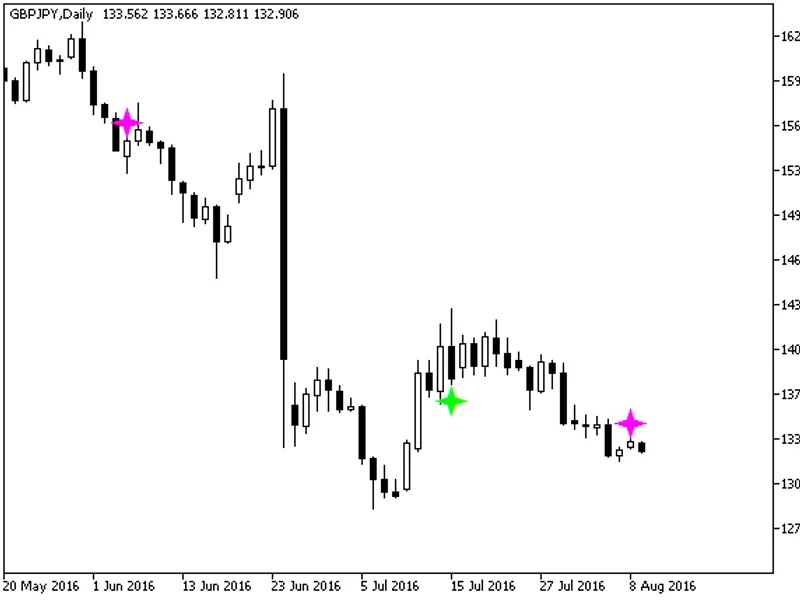
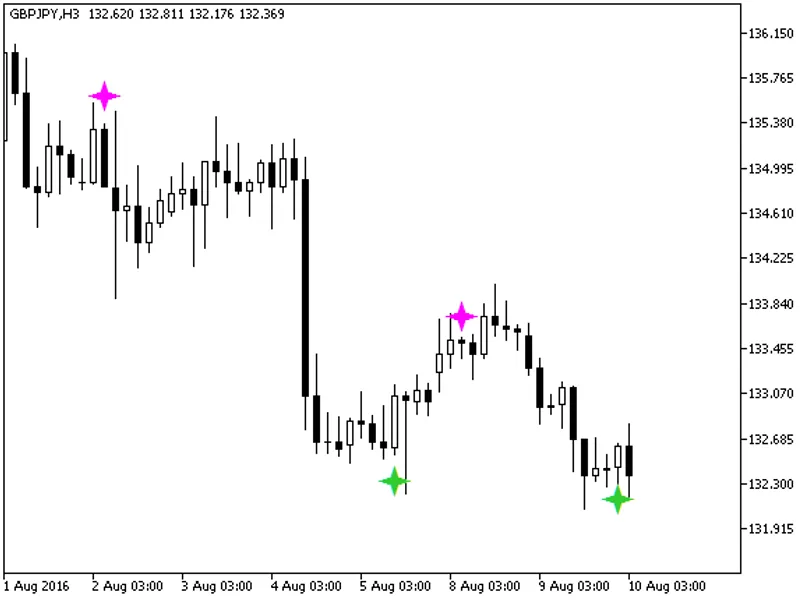
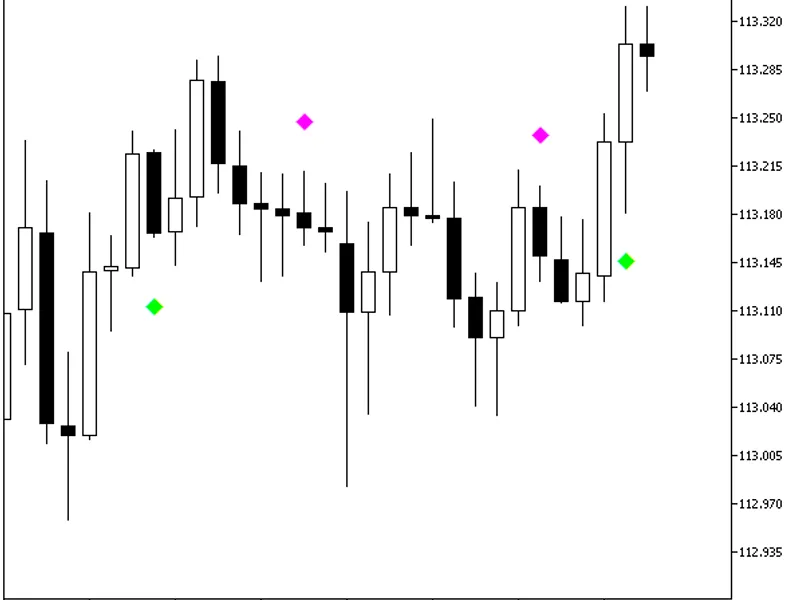
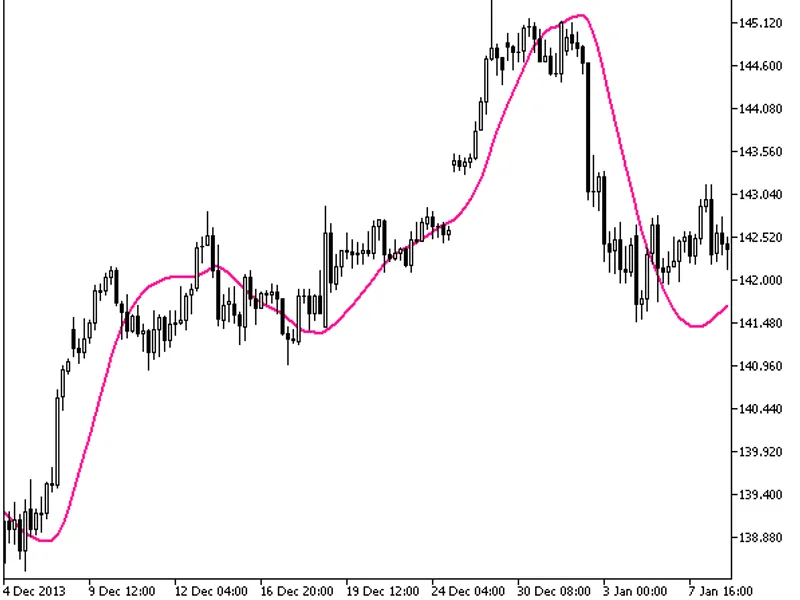
Statbars to the indicator with additional trend strength indication using colored dots based on the standard deviation algorithm.If the standard deviation of the volume_weighted_ma...
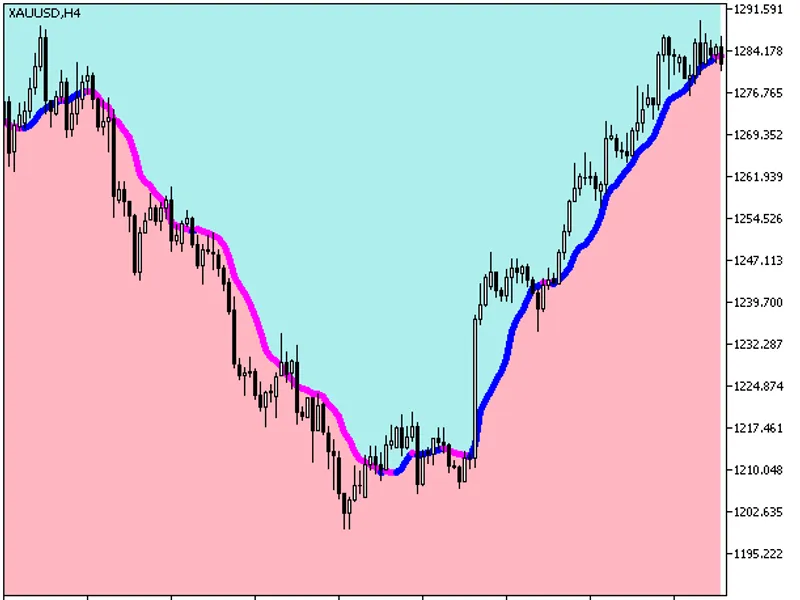
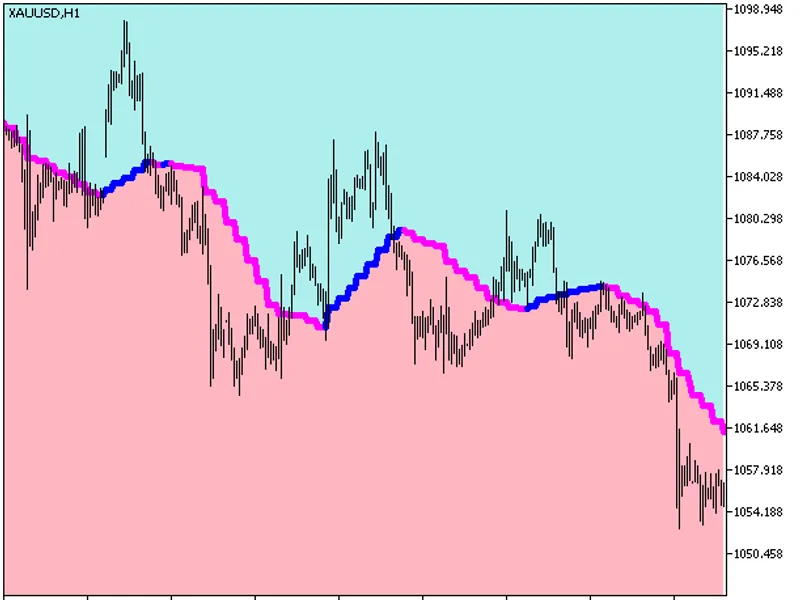
The Volume Weighted MA Cloud indicator is a powerful tool that enhances the standard moving average by incorporating volume data. It calculates a volume-weighted moving average and...
KomposterThis indicator introduces new input parameters and enhances functionality with three new functions: buysignal(), sellsignal(), and getstringtimeframe().The buysignal() and...
The indicator with the timeframe selection option in the input parameters.This indicator requires the volume_weighted_ma_cloud.mq5 indicator file. Place it in <terminal_data_fol...
This indicator offers a straightforward method to determine the current direction of a currency pair. As seen in the image, the last line provides clear buy or sell signals. By add...
This tool is designed to record tick data in a structured format, capturing datetime, bid, ask, and volume information.Key features:- Continuous recording: The recorder operates pe...
The indicator places a panel on your chart that displays 5 economic events from the Forex Factory calendar. You can filter events by high, medium, or low impact, speeches, holidays...
This indicator calculates the profit or loss of current orders on a symbol. You can drag and drop lines to display the current profit or loss.Parameters:- To count in money or pips...
The indicator offers a timeframe selection feature in its input parameters.Note: The indicator requires the ravi_histogram.mq5 file, which should be placed in \mql5\indicators.Fig....
An alternative to the Bollinger Bands® channel, this indicator features a colored inner area within the channel.The original indicator was written in MQL4 and first published in 20...
RobofxThis indicator presents a color histogram that displays the strength and direction of the current trend. The histogram is colored based on the input parameters for overbought...
This indicator introduces new input parameters and additional functionality.Three new functions have been added to the indicator code: buysignal(), sellsignal(), and getstringtimef...
DSS Bressert Sign Alert Indicator
New input parameters have been introduced.
Three new functions have been added to the end of the indicator code: buysignal(), sellsignal(), and ...
The indicator displays candlesticks of a higher timeframe as color-filled rectangles, with colors based on indicator values.Candlestick bodies are colored emerald green or purple, ...
WellxThis indicator has been updated with new input parameters and additional functionality.Three new functions have been added to the indicator code: buysignal(), sellsignal(), an...
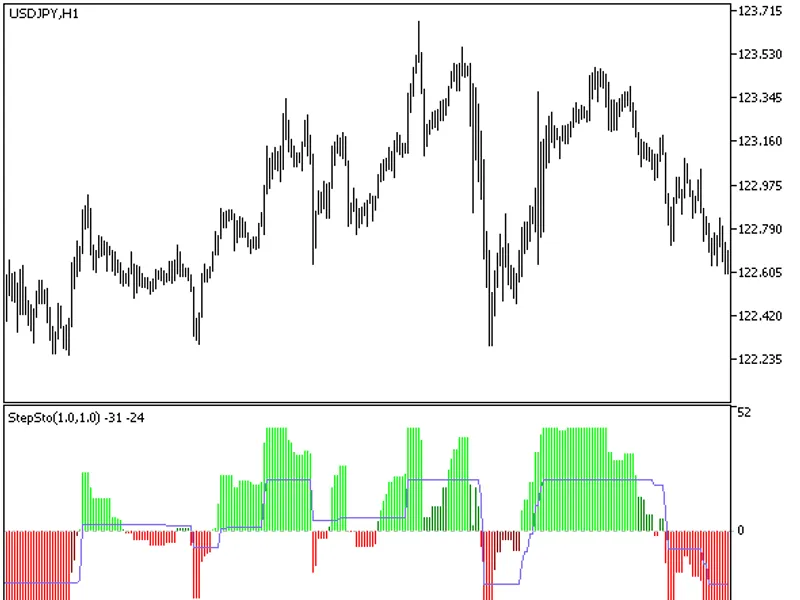
Deso'reganThis indicator calculates the smoothed difference between the main and signal lines of the Stochastic Oscillator, presenting it as a colored histogram.The indicator utili...
Deso'reganThis indicator displays the smoothed difference between the main and signal lines of the RVI oscillator as a colored histogram.The indicator utilizes the SmoothAlgorithms...
The indicator offers a timeframe selection feature in its input parameters.Note: The indicator requires the xtrendlessos.mq5 indicator file. Place it in \mql5\indicators.Fig. 1: Xt...
The XPFE Indicator with Timeframe SelectionThis indicator offers the flexibility to choose the timeframe in the input parameters.Note: The indicator requires the XPFE.mq5 file. Ens...
The STLM digital filter implemented as a sequence of candlesticks. Candlesticks are generated by applying the ColorSTLM_Histogram indicator algorithm to relevant price time series....
This indicator is a hybrid of the Slow Adaptive Trend Line (SATL) digital filter and the JMA adaptive smoothing algorithm.The average is calculated as follows:where:SATL() — value ...
The AFL Winner indicator provides a visual representation of indicator entries into overbought and oversold areas using color-coded histograms. Pale histogram tones indicate a simp...
The XChannel HTF indicator offers a unique feature: the ability to select the timeframe directly from the input parameters.To utilize this indicator, ensure you have the xchannel.m...
The ATR Channels HTF indicator offers a unique feature: the ability to select the timeframe.This indicator requires the atr_channels.mq5 file, which should be placed in the <ter...
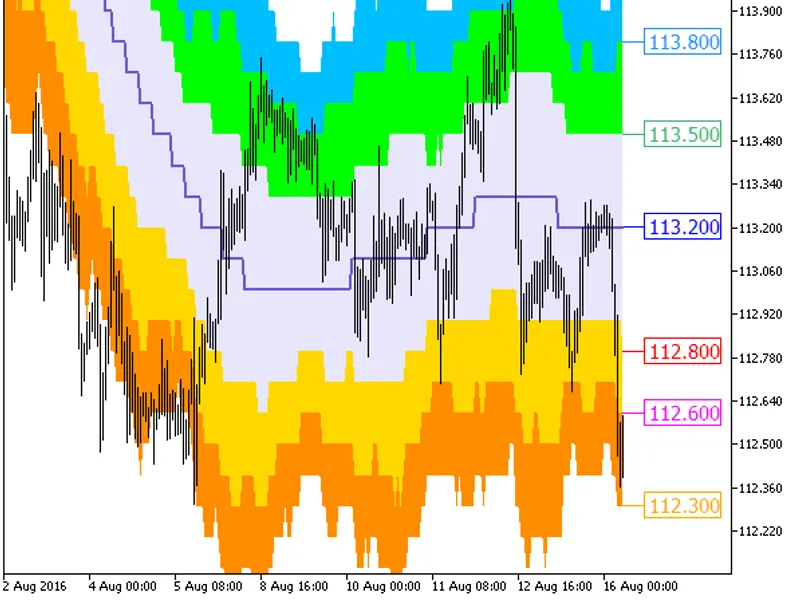
Three channels using the ATR indicator, based on one moving average, drawn as a colored cloud, with the display of the last values as price labels and the option to round channel l...
The MACD histogram, based on the FATL and SATL digital filters with color indication of trends.The indicator uses SmoothAlgorithms.mqh library classes (copy it to \mql5\include).Fi...
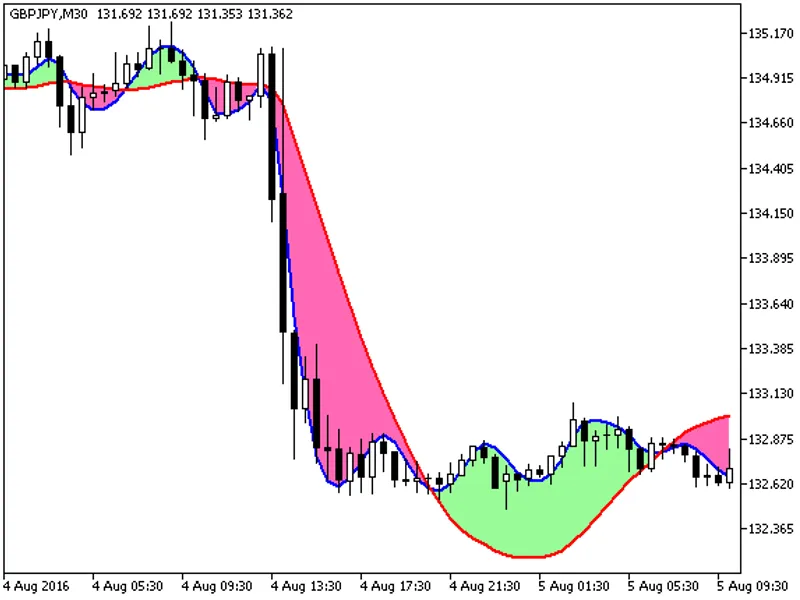
This indicator is based on smoothed Fatl and Satl digital filters and the signal trend cloud between them.The indicator utilizes the smoothalgorithms.mqh library classes, which sho...
This indicator introduces new input parameters and additional functionality to the original Elliott Wave Oscillator.New functions added: buysignal(), sellsignal(), and getstringtim...
A simple trend indicator that calculates the rise and fall in high and low prices.Calculation formula:i4_drf_v2=100 * (psum - nsum) / periodwhere:psum — the number of candles in th...
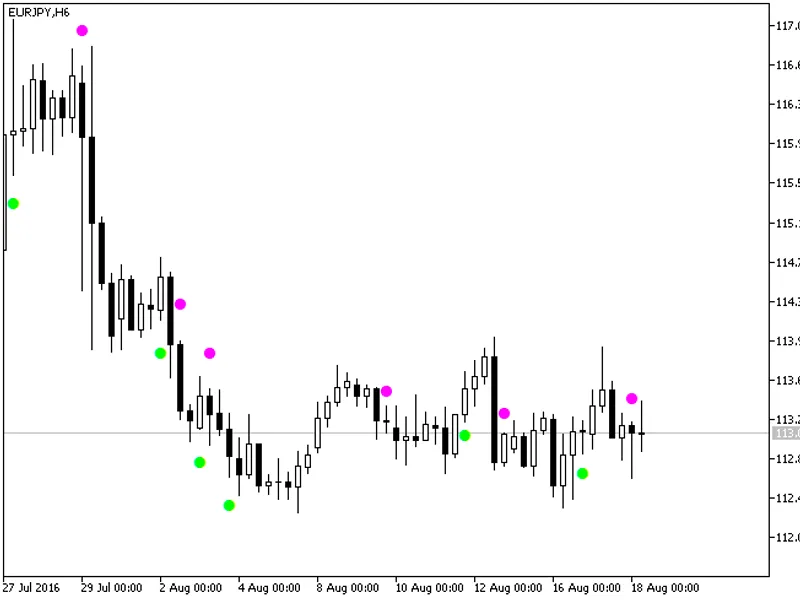
The BS Living Now indicator identifies market extremums, resembling the standard fractals indicator. While similar in appearance, they differ in their underlying calculations and f...
The CronosChaikin_Signal indicator provides insights into the current trend by utilizing the values of the indicator with a fixed timeframe.It generates signals based on the relati...
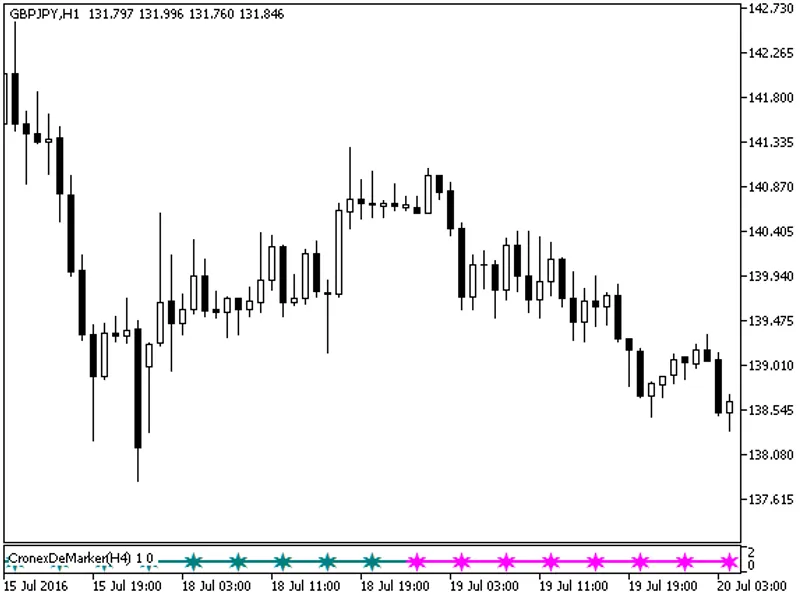
The CronExDeMarker_Signal indicator provides valuable insights into the current trend by utilizing the values of the CronExDeMarker indicator with a fixed timeframe.This indicator ...
The indicator offers a timeframe selection feature in its input parameters.Note: The indicator requires the pricechannel_stop_digit.mq5 file. Place this file in the <terminal_da...
The OSHMA HTF indicator offers a unique feature: the ability to select the timeframe.This indicator relies on the OSHMA.mq5 file, which should be placed in the following directory:...
J.B.This moving average indicator has the ability to change the averaging algorithm.The indicator uses smoothalgorithms.mqh library classes (copy it to \mql5\include). The use of t...
The indicator with the timeframe selection option in the input parameters.Requires the FloatPivot.mq5 indicator file. Place it in /mql5/indicators.Fig.1. The FloatPivot_HTF indicat...
The Float Pivot Digit indicator features a color-filled channel, presented as a cloud, with price labels displaying the latest values. It allows for precise control over channel le...
The RSI indicator is implemented as candlesticks, offering a unique visual representation of price action. This indicator provides valuable insights by displaying candlesticks that...
This indicator offers a timeframe selection feature in its input parameters.To use this indicator, you need the balanceofpower_histogram.mq5 indicator file. Place it in <termina...
IgoradTrend indicator. The location of the histogram and the signal line of the indicator relative to the 0 level can serve as the reference mark to determine the trend. The inters...
The indicator with the timeframe selection option available in the input parameters:This indicator requires the rvidiff.mq5 indicator file. Place it in \mql5\indicators.Fig.1. The ...
This indicator is based on two moving averages from the book by John Ehlers. It provides a unique visualization of market trends and potential reversal points.The Laguerre Filter C...
This indicator offers a timeframe selection option within its input parameters.To use this indicator, you need the stochasticdiff.mq5 indicator file. Place it in the <terminal_d...
The Price Position Indicator provides valuable insights into price movements relative to a specific angle. It displays the position of the price in the point of angle when the pric...
The Price Position indicator is a powerful tool that provides valuable insights into price movements relative to a specific angle. It offers traders a unique perspective by indicat...
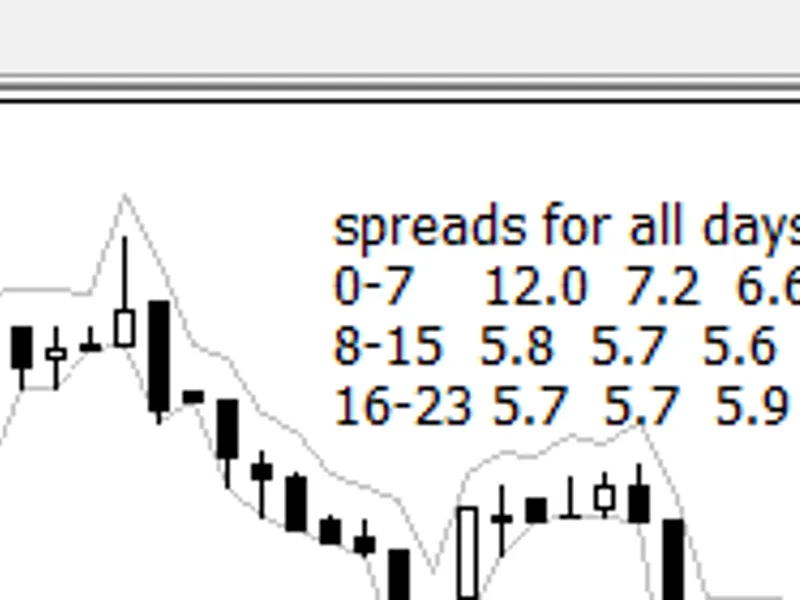
This tool provides valuable insights for optimizing your Expert Advisor (EA) entries by analyzing historical spread data for specific instruments.Each line represents an 8-hour per...
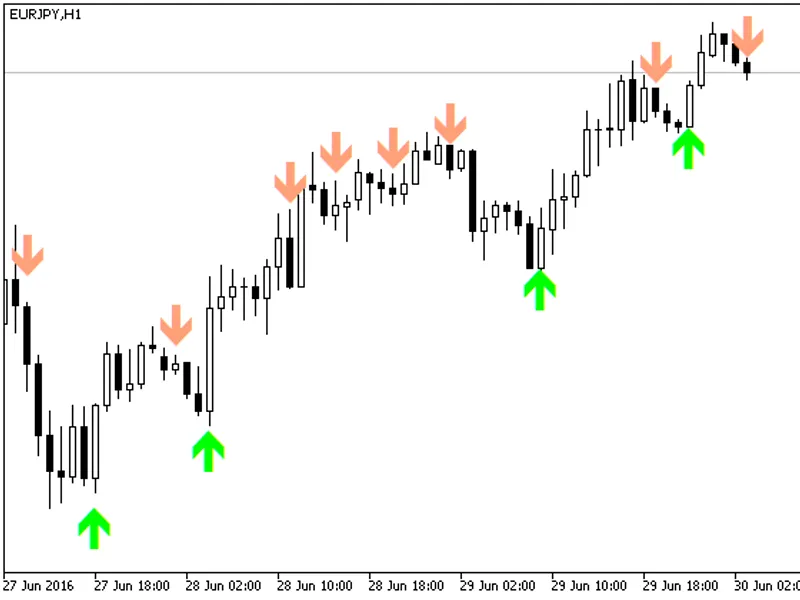
Each buy and sell will be marked by an arrow that indicates the correct direction, aiding you in deciding when to buy or sell at the optimal time. The red arrow signifies selling, ...