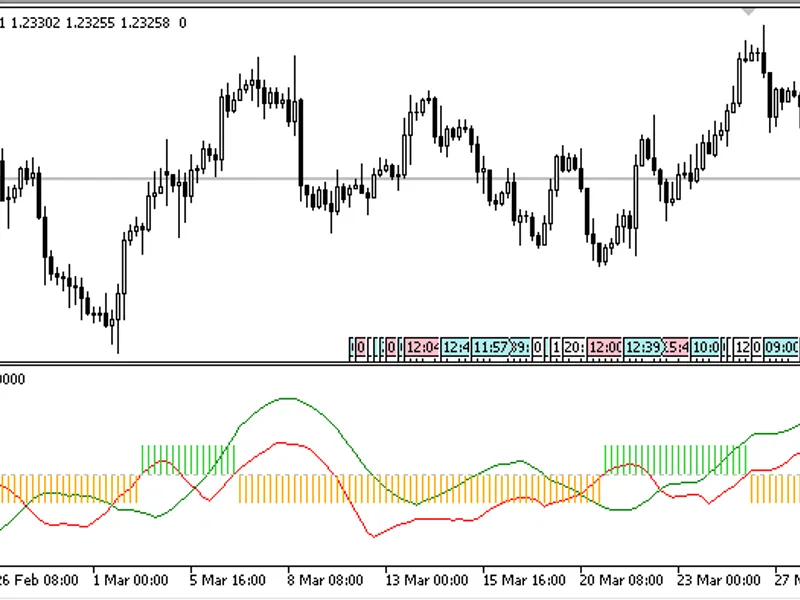
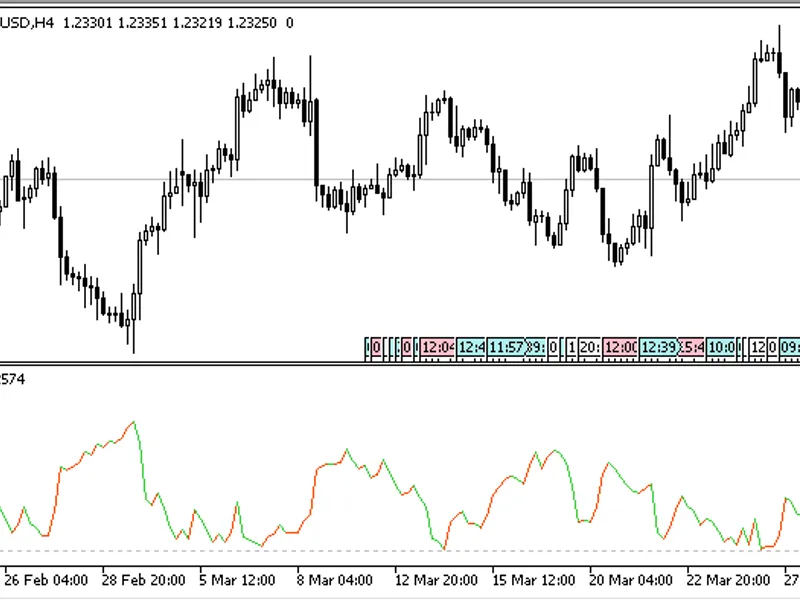
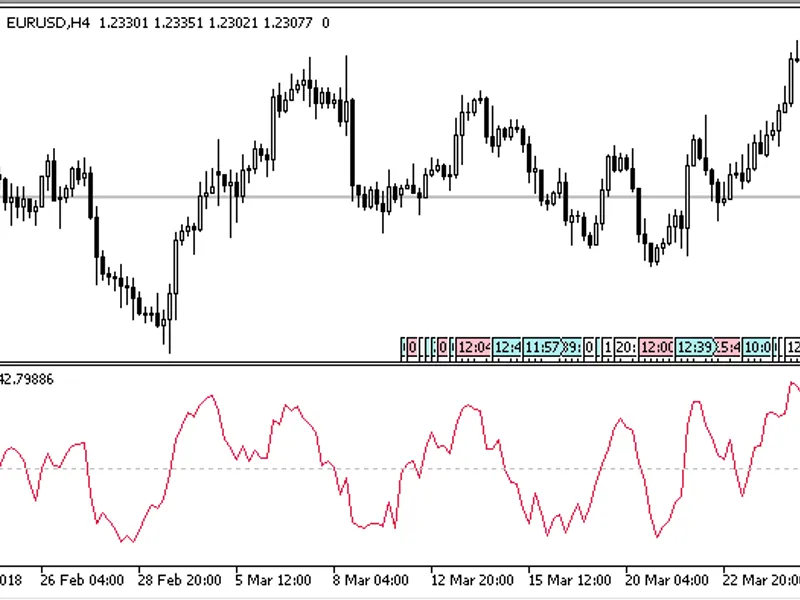
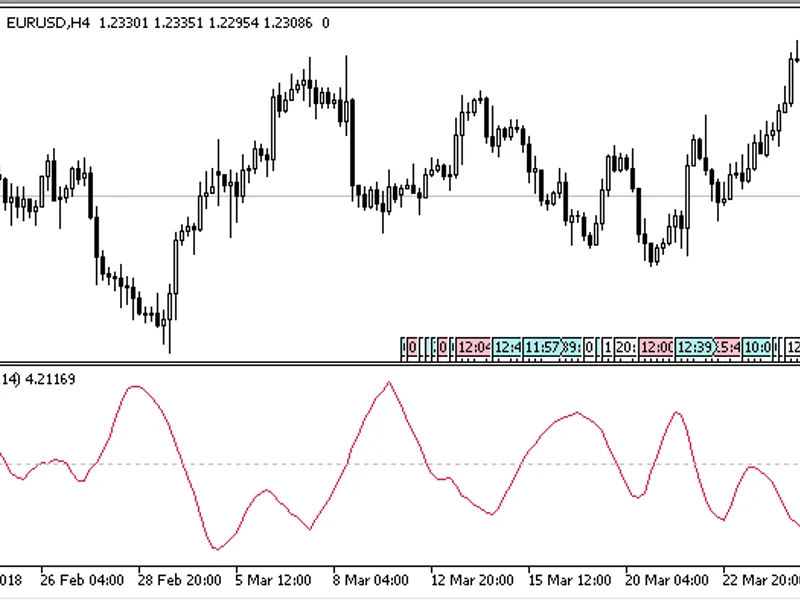
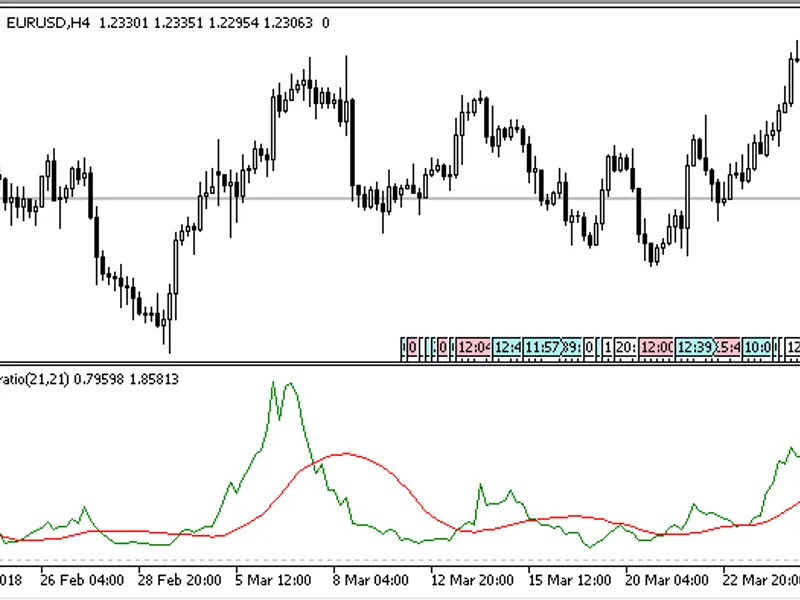
the indicator is drawn as two lines and a histogram:td index- the trend index;direction- trend direction line;signal- trade direction histogram. it has two parameters:period- calcu...
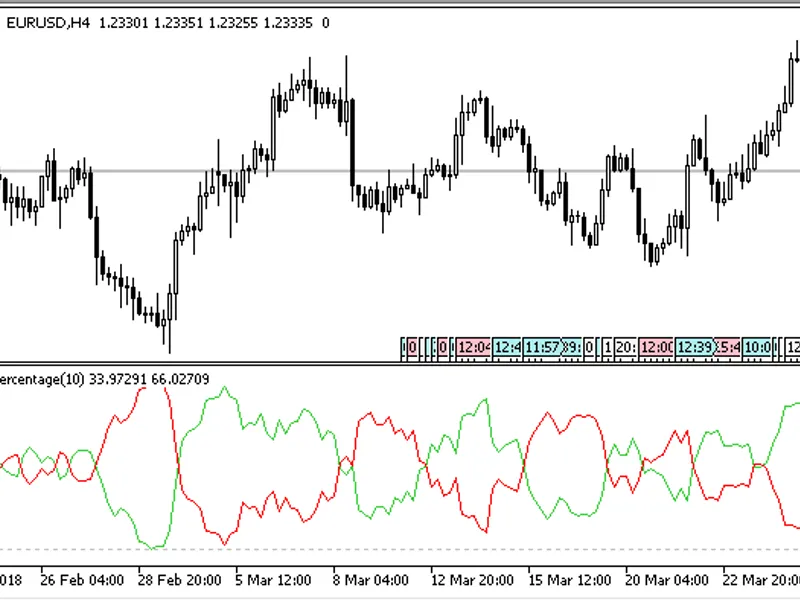
the indicator shows the percentage ratio of bullish and bearish bars in the given interval.it has two parameters:period- calculation period;applied price- price used for calculatio...
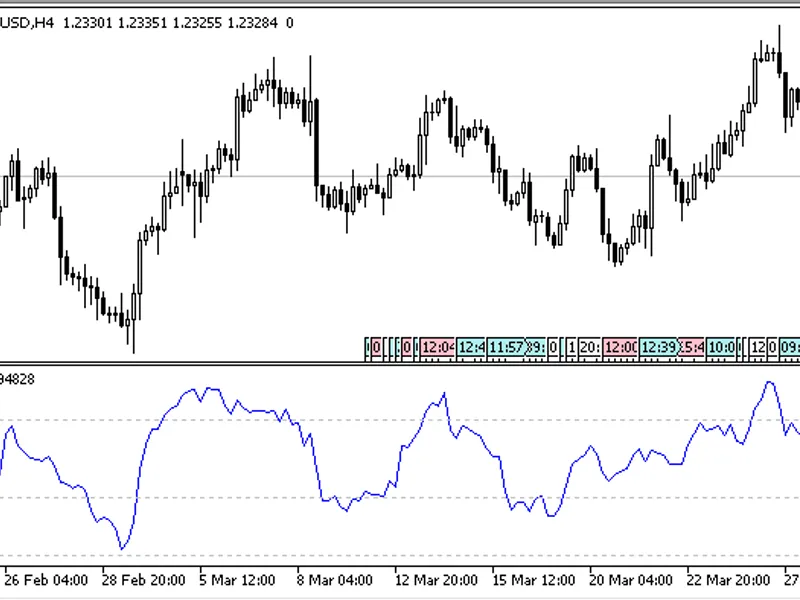
the indicator shows a line of the unsmoothed rsi in a separate chart window.it has four input parameters:period- calculation period;applied price- the calculation price;overbought-...
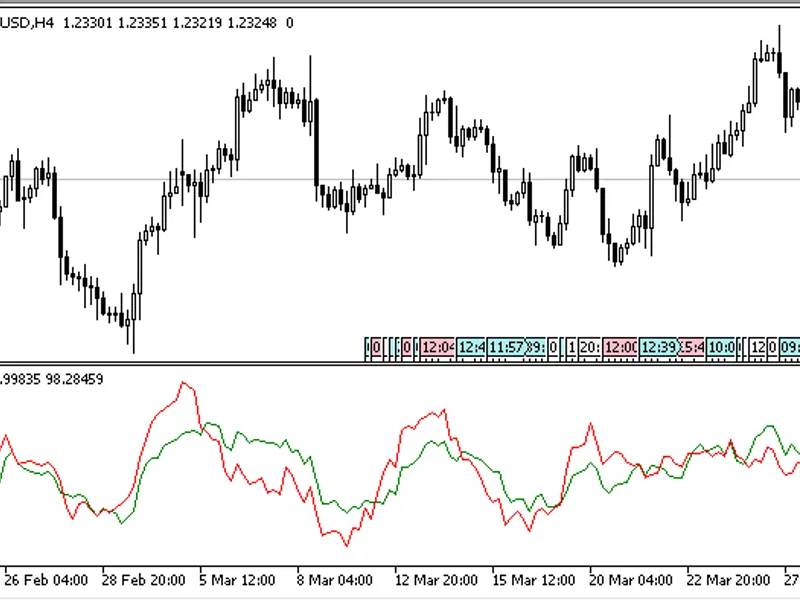
the oscillator indicator shows the velocity/acceleration.the indicator has three input parameters:velocity period- velocity calculation period;acceleration period- acceleration cal...
the volatility index oscillator (vix).it has two parameters:period - calculation period (default 22)drawing style:line - a colored line histogram - a colored histogram the original...
the indicator shows the ratio of two moving averages calculated using the high/low and open/close values for a given period.it has one input parameter:period - calculation period...
the indicator predicts a probable price reversal. the reversal of the indicator line suggests that the price direction may change soon.the indicator has three input parameters:fast...
the indicator shows the ratio between bullish and bearish candlesticks over the specified period.the indicator has three input parameters:period - calculation periodsmoothing perio...
the dma indicator, in which the period parameter is the number of days n in the below calculation formula.the indicator has two input parameters:period - calculation periodapplied ...
the oscillator indicator shows a ratio between bullish and bearish candlesticks over the selected period.it has two parameters:period - calculation periodmethod - the method of smo...
an indicator of larry williams' cot indexit has one input parameter:period - calculation period calculation: movingavg(open-close, bars used in average)/movingavg(range,bars used i...
an indicator of larry williams' cot index (), with a different calculation formulait has one input parameter:period - calculation period calculation: movingavg(close - close[period...
a trend indicator drawn using the cci and atr values. it draws on a chart a colored line indicating three directions: uptrend, downtrend and flat.it has two parameters:cci period- ...
the indicator is similar to bollinger bands, but has a signal ("mirror") line.it has four input parameters:period - calculation periodma period- ma line calculation perioddeviation...
this indicator is a result of an attempt to combine the theory of movement stability with the hodrick-prescott filter.the hodrick-prescott filter is a method for smoothing the time...
the indicator shows on a chart high and low levels over the specified time interval, which is set as hours and minutes of the period beginning and end.the indicator shows two zones...
the expert advisor works in a channel drawn by the indicator.the indicator itself is not required for the ea operation, since its data are calculated inside the ea.the ea trades on...
a further development of .an expert advisor based on the ibands (bollinger bands) indicator. when a signal is received, the ea closes opposite positions (see 'features' for details...
a simple signal indicator.when the direction of the moving average, which is calculated using close prices, changes, a signal arrow is drawn on the chart:if the direction of the mo...
a simple indicator, which marks candlesticks with the maximum and minimum volume over a given period on a price chart.it has one input parameter:period- indicator calculation perio...
t3 ma is an adaptive moving average developed by tim tillson, first presented in his article 'smoothing techniques for more accurate signals'.it has lower lagging and better noise ...
this oscillator indicator displays volumes taking into account the direction of the candlestick. if a candlestick is bullish, then the positive histogram of the volume appears, on ...
pearson product-moment correlation coefficient (pearson's pcc) displays the linear relation between the moving average values of two instruments ranging from -1 to +1. when the cha...
this oscillator indicator displays the percentage ratio of prices and candlestick sizes in a given range.it has two parameters:period - calculation period (the range)use last perio...
the prevailing trend oscillator shows the prevailing trend as two components - the bullish and the bearish one, which are represented as two indicator lines: up for the bullish com...
the smart money index (smi) shows investors' mood and is based on intraday price patterns.most traders (who are emotional and sensitive to news) overreact to the beginning of the t...
the indicator shows two components (bullish and bearish) of a moving average over a given period, in a separate window.the indicator has three input parameters:period - period for ...
the indicator shows two components (bullish and bearish) of a moving average of volumes, over a given period, in a separate window.it has two parameters:period - period for calcula...
the volatility bands indicator is similar to the standard bollinger bands.it has four input parameters:period band - period for calculating the bandsperiod - period for smoothing t...
the volatility band 2 indicator is similar to the standard bollinger bands, and is a modification of with the following difference: instead of a separate 'low band adjustment', thi...
the indicator draws on a price chart a line, constructed by the method of polynomial interpolation between two node lines.it has four input parameters:length- the initial distance ...
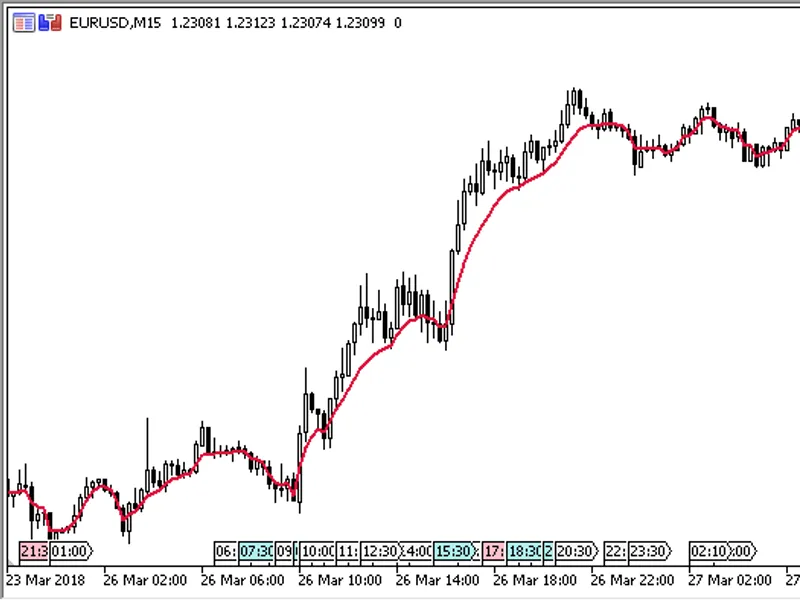
alan hull's moving average.since the classical moving average is calculated using symbol's prices received in the past period, that ma lags behind the current price activity. this ...
instantaneous trendline by j.ehlers is calculated by the following formula:if i<=7:itrend[i] = (price[i] + 2*price[i-1] + price[i-2])/4 if i>7:itrend[i] = c1*price[i] + c2*pr...
a moving average calculated by the least squares method.the indicator has two input parameters:period- calculation period;applied price- price used for calculations. calculation:ls...
the indicator displays possible stoploss levels on the price chart. levels are shown separately for long and short positions.it has two parameters:period- calculation period;coeffi...
universal trailing of positions and pending orders. the expert advisor can also open positions and place pending orders.the ex can:trail stop levels for orders of any type (market ...
regularized ema by cris satchwell.it has two parameters:period- period;applied price- price used for calculations. calculation:rema[i] = (rema[i-1]*(1 + 2*lambda) + alpha*(price[i]...
the rmo oscillator has been created by rahul mohindar. the purpose of the oscillators is to find trends.the general recommendation is to trade in the direction of the intersection ...
the indicator shows on a price chart possible support/resistance levels.calculation formula:wheremax, min - the highest and the lowest price in the range from (i-period) to (i-1) t...
the indicator displays possible stoploss levels on the price chart. levels are shown separately for long and short positions. the indicator is similar to , but has a different calc...
this trend oscillator displays the dominant direction of close prices of candlesticks over the specified period.it has two parameters:period- period;method- calculation method. cal...